. 2024 Apr;271(4):1824-1836.
doi: 10.1007/s00415-023-12104-3. Epub 2023 Dec 8.

Reduced tear fluid production in neurological diseases: a cohort study in 708 patients

Affiliations

Reduced tear fluid production in neurological diseases: a cohort study in 708 patients

Elena Luib et al. J Neurol. 2024 Apr.

Abstract

Background: Tear fluid (TF) production is an important component of normal ocular function. It is regulated by parasympathetic and sympathetic innervation. Because parasympathetic nerve fibers originate in the brainstem, pathology in this brain region may affect TF production. For example, a reduction in TF production has been described in patients with Parkinson's disease (PD).

Methods: TF was collected at one center from 772 individuals, 708 of which were patients with different neurological diseases, and 64 healthy controls. Wetting lengths (WL) were recorded using Schirmer test strips with a collection time of 10 min.

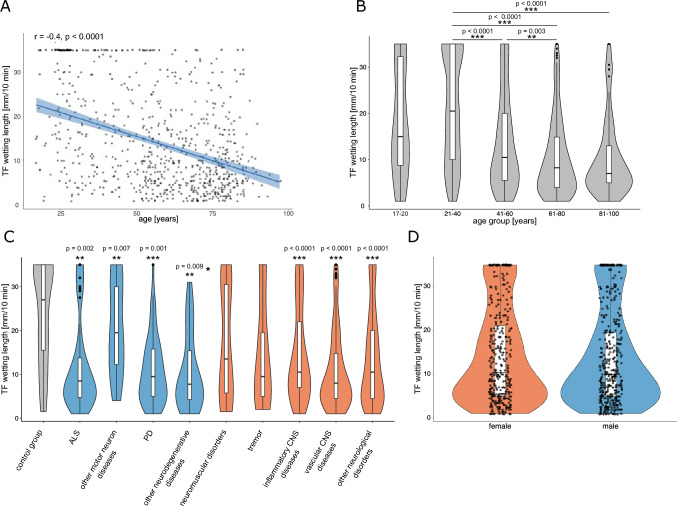
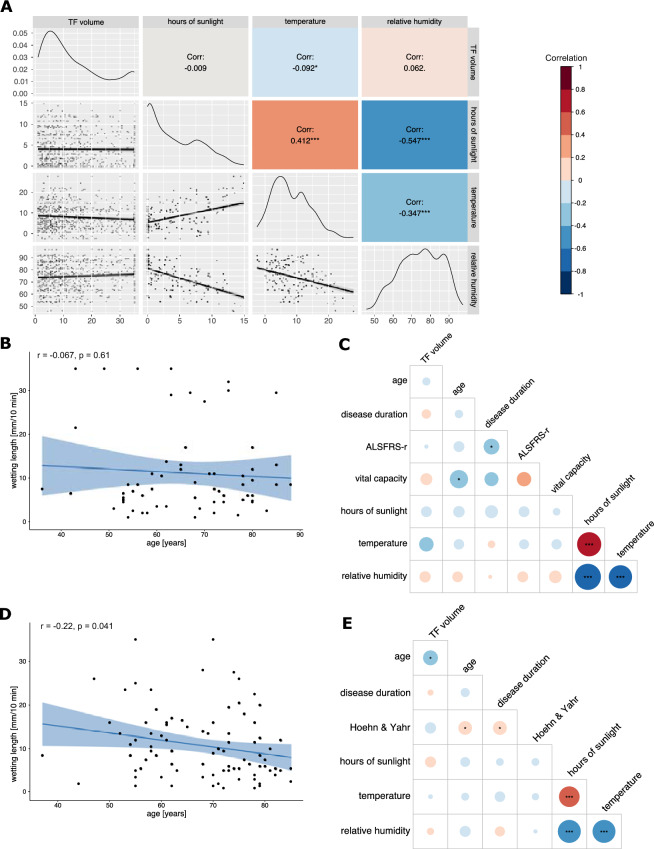
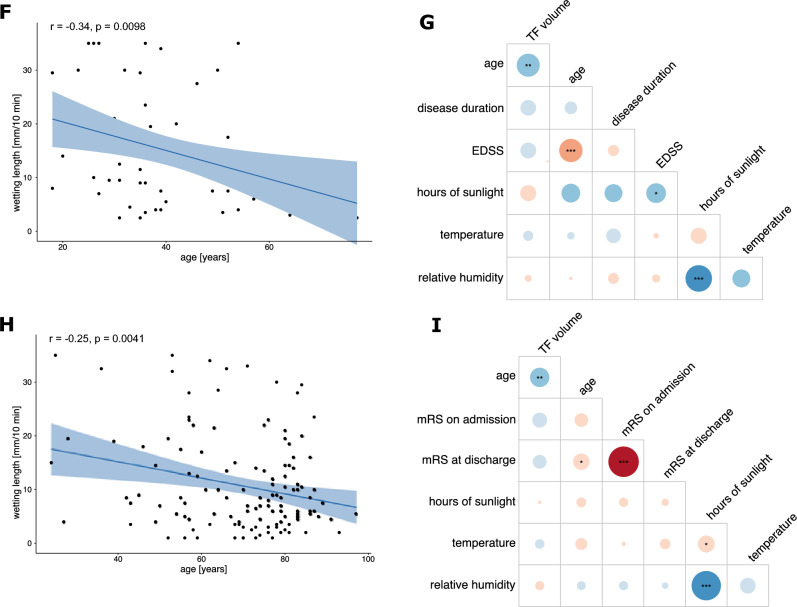
Results: WL correlated negatively with age and was significantly reduced in subgroups of patients with neurodegenerative diseases (NDDs) (PD, Amyotrophic lateral sclerosis (ALS), other motor neuron diseases (MNDs)), as well as inflammatory/autoimmune/infectious central nervous system (CNS) diseases and vascular CNS diseases (VCDs), even if corrected for age or sex. While temperature had a significant negative effect on TF production, other environmental factors, such as hours of sunlight and humidity, did not.

Conclusion: WL was altered in many neurological diseases compared to healthy controls. Most importantly, we observed a reduction of WL in NDDs, independent of age or sex. This study highlights the potential of WL as an easily obtainable parameter and suggests functional alterations in the autonomic innervation in various neurological disorders.

Keywords: Neurodegeneration; Neurological diseases; Tear fluid; Wetting length.


Conflict of interest statement

The authors declare that they have no conflict of interest.

Figures

Fig. 1
Fig. 1
Analysis of TF WL in different ND groups. A Using Pearson’s correlation, a moderate negative correlation between WL (mm/10 min) and age (years) was observed (n = 772). Regression line is shown in blue with 95% confidence intervals in light blue as well as all individual data points. B Analysis of the distribution of TF WL in mm/10 min in five different age groups revealed significant differences between the age groups 21–40 (n = 167) and 41–60 (n = 208), 21–40 and 61–80 (n = 302), 21–40 and 81–100 (n = 80) and between age groups 41–60 and 61–80 (Kruskal–Wallis test and pairwise Wilcoxon rank sum test with Bonferroni post-hoc testing). Data is displayed in violin plots with inlayed box plots. C Division of the total cohort into 9 disease subgroups (NDDs are shown in blue, other NDs in red) and a control group without signs of ND (grey). Comparison of mean WL in the 9 subgroups with the control group, using age- and sex-corrected multiple linear regression analysis, revealed significantly reduced TF production in 7 of 9 groups compared to controls: ALS, other MNDs, PD, other NDDs, inflammatory/ autoimmune/ infectious CNS diseases, VCDs and other NDs. Data is displayed in violin plots with inlayed box plots. D Comparison of wetting lengths in female (red) and male (blue) subjects showed no significant difference using age-corrected multiple linear regression analysis. Data is displayed in violin plots with inlayed box plots as well as all individual data points. Inlayed boxplots for all graphs show median and 1st and 3.rd quartile. Observations with a distance from the border of the box larger than 1.5 × interquartile range are shown as individual dots; *p < 0.05, **p < 0.01, ***p < 0.001
Fig. 2
Fig. 2
Correlation analysis between TF WL, environmental and clinical parameters in the overall cohort and the PD, ALS, MS and VCDs subgroups A Correlogram depicting the Pearson’s Correlation between TF volume and hours of sunlight, temperature and relative humidity in the overall cohort (n = 772). A weak, significant correlation between temperature and TF volume is shown. Upper half notes the correlation and the corresponding significance levels indicated by asterisks, the diagonal row shows the data distribution and the bottom half shows the regression line with 95% confidence intervals and individual data points. B, D, F, H Pearson correlation between TF volume and age in the ALS (B), PD (D), MS (F) and VCDs (H) subgroups. Regression line is shown in blue with 95% confidence interval in light blue as well as all individual data points. C, E, G, I Correlation plots between TF WL, clinical and meteorological data for the ALS (C, n = 65, PD (E, n = 94), MS (G, n = 56) and VCDs (I, n = 135) cohort respectively. Size and color of the circles correlate to the strength of the correlation. Significances are shown as asterisks inside the circles. Pearson’s correlation coefficient is shown for all but Hoehn & Yahr scale, EDSS and mRS, for which Kendall’s tau is displayed. Significance levels are shown as *p < 0.05, **p < 0.01, ***p < 0.001 for all. The correlation index color legend is applicable for all correlograms
Fig. 2
Fig. 2
Correlation analysis between TF WL, environmental and clinical parameters in the overall cohort and the PD, ALS, MS and VCDs subgroups A Correlogram depicting the Pearson’s Correlation between TF volume and hours of sunlight, temperature and relative humidity in the overall cohort (n = 772). A weak, significant correlation between temperature and TF volume is shown. Upper half notes the correlation and the corresponding significance levels indicated by asterisks, the diagonal row shows the data distribution and the bottom half shows the regression line with 95% confidence intervals and individual data points. B, D, F, H Pearson correlation between TF volume and age in the ALS (B), PD (D), MS (F) and VCDs (H) subgroups. Regression line is shown in blue with 95% confidence interval in light blue as well as all individual data points. C, E, G, I Correlation plots between TF WL, clinical and meteorological data for the ALS (C, n = 65, PD (E, n = 94), MS (G, n = 56) and VCDs (I, n = 135) cohort respectively. Size and color of the circles correlate to the strength of the correlation. Significances are shown as asterisks inside the circles. Pearson’s correlation coefficient is shown for all but Hoehn & Yahr scale, EDSS and mRS, for which Kendall’s tau is displayed. Significance levels are shown as *p < 0.05, **p < 0.01, ***p < 0.001 for all. The correlation index color legend is applicable for all correlograms

References

    1. Abusharha AA, Pearce EI. The Effect of low humidity on the human tear film. Cornea. 2013;32:429–434. doi: 10.1097/ICO.0b013e31826671ab. - DOI - PubMed
    1. Abusharha AA, Pearce EI, Fagehi R. Effect of Ambient temperature on the human tear film. Eye Contact Lens: Sci Clin Pract. 2016;42:308–312. doi: 10.1097/ICL.0000000000000210. - DOI - PubMed
    1. Akasaki Y, Inomata T, Sung J, Nakamura M, Kitazawa K, Shih KC, Adachi T, Okumura Y, Fujio K, Nagino K, Midorikawa-Inomata A, Kuwahara M, Hirosawa K, Huang T, Morooka Y, Shokirova H, Eguchi A, Murakami A. Prevalence of comorbidity between dry eye and allergic conjunctivitis: a systematic review and meta-analysis. J Clin Med. 2022;11:3643. doi: 10.3390/jcm11133643. - DOI - PMC - PubMed
    1. Bagheri H, Berlan M, Senard J, Rascol O, Montastruc J. Lacrimation in Parkinson's disease. Clin Neuropharmacol. 1994;17:89–91. doi: 10.1097/00002826-199402000-00010. - DOI - PubMed
    1. Beckman K, Luchs J, Milner M. Making the diagnosis of Sjögren’s syndrome in patients with dry eye. Clin Ophthalmol. 2015 doi: 10.2147/OPTH.S80043. - DOI - PMC - PubMed