. 2024 Jul;61(7):4130-4145.
doi: 10.1007/s12035-023-03819-5. Epub 2023 Dec 8.

Posttreatment with PaPE-1 Protects from Aβ-Induced Neurodegeneration Through Inhibiting the Expression of Alzheimer's Disease-Related Genes and Apoptosis Process That Involves Enhanced DNA Methylation of Specific Genes

Affiliations

Posttreatment with PaPE-1 Protects from Aβ-Induced Neurodegeneration Through Inhibiting the Expression of Alzheimer's Disease-Related Genes and Apoptosis Process That Involves Enhanced DNA Methylation of Specific Genes

Bernadeta A Pietrzak-Wawrzyńska et al. Mol Neurobiol. 2024 Jul.

Abstract

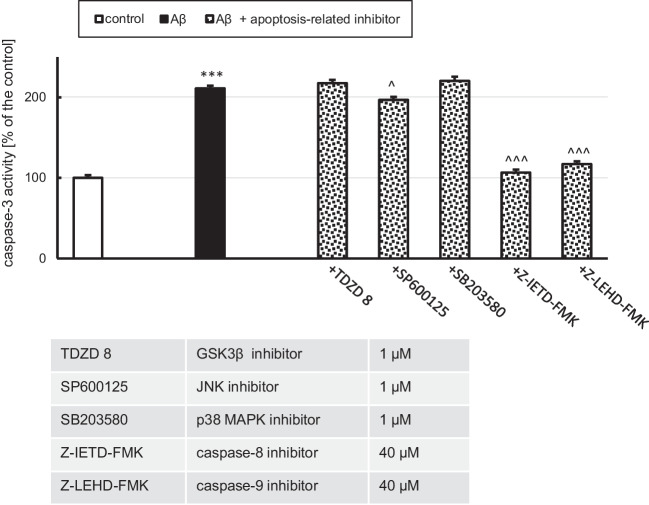
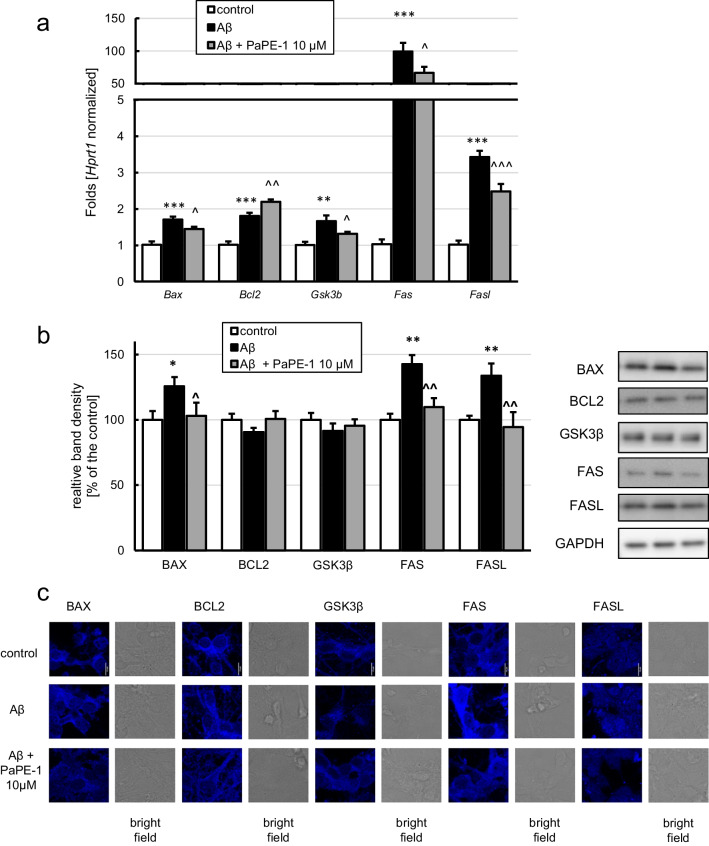
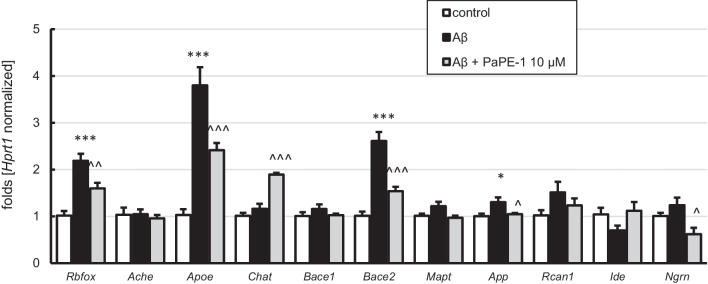
Targeting the non-nuclear estrogen receptor (ER) signaling has been postulated as novel therapeutic strategy for central nervous system pathologies. Recently, we showed that newly designed PaPE-1 (Pathway Preferential Estrogen-1), which selectively activates ER non-nuclear signaling pathways, elicited neuroprotection in a cellular model of Alzheimer's disease (AD) when it was applied at the same time as amyloid-β (Aβ). Since delayed treatment reflects clinical settings better than cotreatment does, current basic study proposes a novel therapeutic approach for AD that relies on a posttreatment with PaPE-1. In this study, mouse neuronal cell cultures treated with preaggregated Aβ1-42 (10 µM) showed the presence of extracellular Aβ1-42, confirming the adequacy of the AD model used. We are the first to demonstrate that a 24-h delayed posttreatment with PaPE-1 decreased the degree of Aβ-induced neurodegeneration, restored neurite outgrowth, and inhibited the expression of AD-related genes, i.e., Rbfox, Apoe, Bace2, App, and Ngrn, except for Chat, which was stimulated. In addition, PaPE-1 elicited anti-apoptotic effects by inhibiting Aβ-induced caspase activities as well as attenuating apoptotic chromatin condensation, and in these ways, PaPE-1 prevented neuronal cell death. Posttreatment with PaPE-1 also downregulated the Aβ-affected mRNA expression of apoptosis-specific factors, such as Bax, Gsk3b, Fas, and Fasl, except for Bcl2, which was upregulated by PaPE-1. In parallel, PaPE-1 decreased the protein levels of BAX, FAS, and FASL, which were elevated in response to Aβ. PaPE-1 elicited a decrease in the BAX/BCL2 ratio that corresponds to increased methylation of the Bax gene. However, the PaPE-1-evoked Bcl2 gene hypermethylation suggests other PaPE-1-dependent mechanisms to control Aβ-induced apoptosis.

Keywords: Alzheimer’s disease; Amyloid-β; Caspases; Neuroprotection; Non-nuclear estrogen receptor signaling; Primary neocortical cell cultures.


Conflict of interest statement

The authors declare no competing interests.

Figures

Fig. 1
Fig. 1
Immunofluorescent labeling of Aβ (green staining) and the neuronal marker MAP2 (blue staining) in primary neocortical cell cultures treated with 10 μM Aβ for 30 h. Bright-field images are also shown. Staining showed the intra- and extracellular distribution of Aβ in neuronal cell cultures
Fig. 2
Fig. 2
Aβ at a concentration of 10 μM increased caspase-3 activity. Inhibition of caspase-8 and caspase-9 prevented Aβ-induced caspase-3 overactivity, while JNK inhibition slightly attenuated the Aβ-induced effect. Each bar represents the mean ± SEM of three independent experiments, consisting of 10 replicates per group. ***p < 0.001 versus the control and ^p < 0.05, ^^^p < 0.001 versus Aβ-treated cells
Fig. 3
Fig. 3
PaPE-1 (5 and 10 μM) partially reversed Aβ-induced caspase-9 (b) and caspase-3 activity (c) but did not impact caspase-8 elevation (a). Each bar represents the mean ± SEM of three independent experiments, consisting of 10 replicates per group. ***p < 0.001 versus the control and ^^^p < 0.001 versus Aβ-treated cells
Fig. 4
Fig. 4
Fluorescent labeling of viable cells using calcein AM (green stain) and cell nuclei using Hoechst 33342 (blue stain) (a). PaPE-1 (10 μM) partially reversed the Aβ-induced decrease in cell viability (b) and increase in chromatin condensation (c). Each bar represents the mean ± SEM of the mean fluorescence intensity measured from 15 whole photos per group in calcein AM staining or 30 nuclei per picture with five pictures per group in Hoechst 33342 staining. ***p < 0.001 versus the control and ^^^p < 0.001 versus Aβ-treated cells
Fig. 5
Fig. 5
PaPE-1 (10 μM) affected Aβ-increased mRNA expression (a) and protein levels (b) of apoptosis-specific factors. Each bar represents the mean ± SEM of three independent experiments, consisting of five replicates per group. **< 0.01 and ***p < 0.001 versus the control cultures; ^p <0.05, ^^p < 0.01 and ^^^p < 0.001 versus Aβ-treated cells. Immunofluorescent labeling of BAX, BCL2, GSK3β, FAS, and FASL (c) confirmed the results obtained using western blotting. Scale bar equals 10 μm in all images
Fig. 6
Fig. 6
The methylation rates of the Bax (a) and Bcl2 (b) genes were altered by both Aβ (10 μM) and posttreatment with PaPE-1 (10 μM). The results are presented as the mean ± SEM. There were three independent experiments, consisting of five replicates per group. **p < 0.01 and ***p < 0.001 compared to the control group; ^p < 0.05 and ^^^p < 0.001 compared to the cultures exposed to Aβ
Fig. 7
Fig. 7
Fluoro-Jade C was used to stain degenerating neurons (a, b). PaPE-1 decreased the Aβ-induced increase in the degree of neurodegeneration. Each bar represents the mean ± SEM of three independent experiments, consisting of 10 replicates per group. ***p < 0.001 versus the control and ^^^p < 0.001 versus Aβ-treated cells
Fig. 8
Fig. 8
PaPE-1 (10 μM) partially reversed the Aβ-induced decrease in neurite outgrowth (a, b). Each bar represents the mean ± SEM of the mean fluorescence intensity measured from 23 to 25 photos per group. ***p < 0.001 versus the control and ^^^p < 0.001 versus Aβ-treated cells
Fig. 9
Fig. 9
Aβ (10 μM) and PaPE-1 (10 μM) affected the mRNA expression levels of AD-related genes. Each bar represents the mean ± SEM of three independent experiments, consisting of five replicates per group. *p < 0.05 and ***p < 0.001 versus the control cultures; ^p < 0.05, ^^p < 0.01, and ^^^p < 0.001 versus Aβ-treated cells

References

    1. Thinakaran G, Koo EH. Amyloid precursor protein trafficking, processing, and function. J Biol Chem. 2008;283(44):29615–29619. doi: 10.1074/jbc.R800019200. - DOI - PMC - PubMed
    1. Shimohama S. Apoptosis in Alzheimer’s disease–an update. Apoptosis. 2000;5(1):9–16. doi: 10.1023/a:1009625323388. - DOI - PubMed
    1. Huang YR, Liu RT. The toxicity and polymorphism of β-amyloid oligomers. Int J Mol Sci. 2020;21(12):4477. doi: 10.3390/ijms21124477. - DOI - PMC - PubMed
    1. Sharma VK, Singh TG, Singh S, Garg N, Dhiman S. Apoptotic pathways and Alzheimer’s disease: probing therapeutic potential. Neurochem Res. 2021;46(12):3103–3122. doi: 10.1007/s11064-021-03418-7. - DOI - PubMed
    1. Thornberry NA, Rano TA, Peterson EP, Rasper DM, Timkey T, Garcia-Calvo M, Houtzager VM, Nordstrom PA et al (1997) A combinatorial approach defines specificities of members of the caspase family and granzyme B. Functional relationships established for key mediators of apoptosis. J Biol Chem 272(29):17907–17911. 10.1074/jbc.272.29.17907 - PubMed

MeSH terms

Substances