. 2024 Feb;11(7):e2306899.
doi: 10.1002/advs.202306899. Epub 2023 Dec 8.

An Autologous Macrophage-Based Phenotypic Transformation-Collagen Degradation System Treating Advanced Liver Fibrosis

Affiliations

An Autologous Macrophage-Based Phenotypic Transformation-Collagen Degradation System Treating Advanced Liver Fibrosis

Bo-Wen Duan et al. Adv Sci (Weinh). 2024 Feb.

Abstract

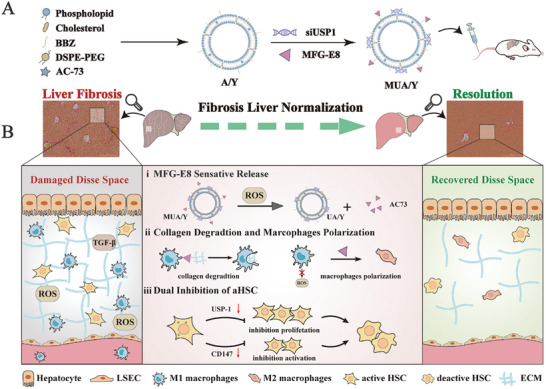
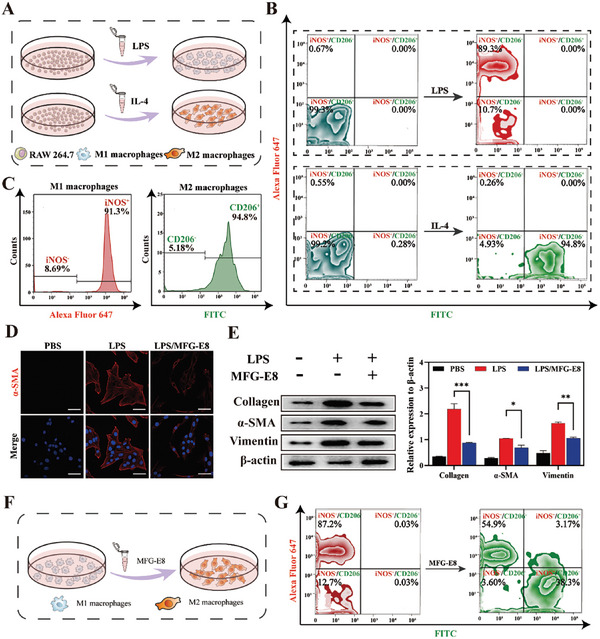
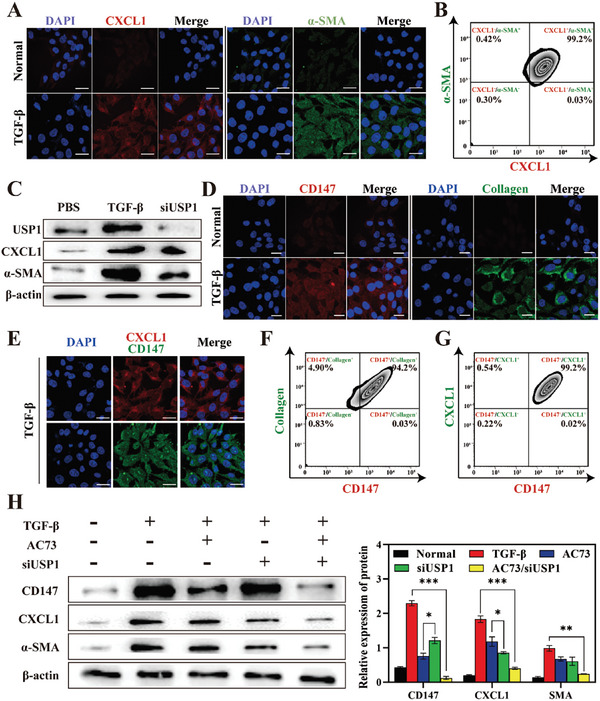
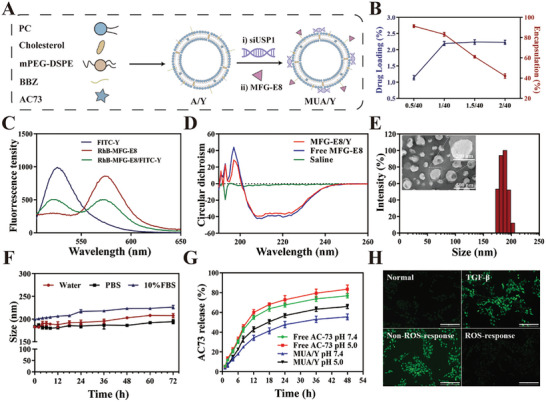
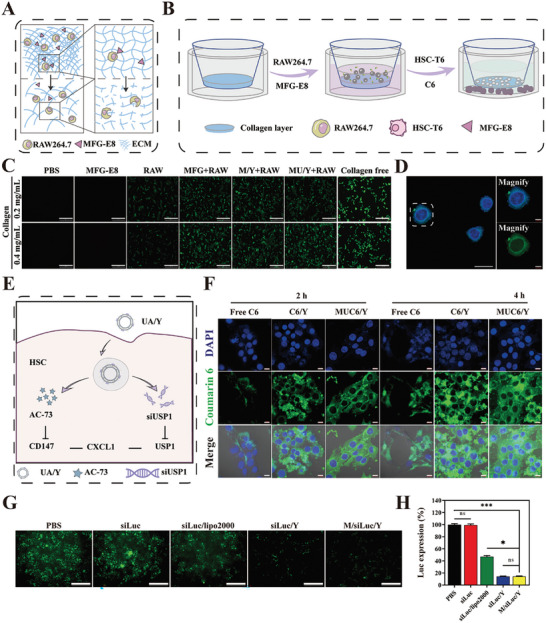
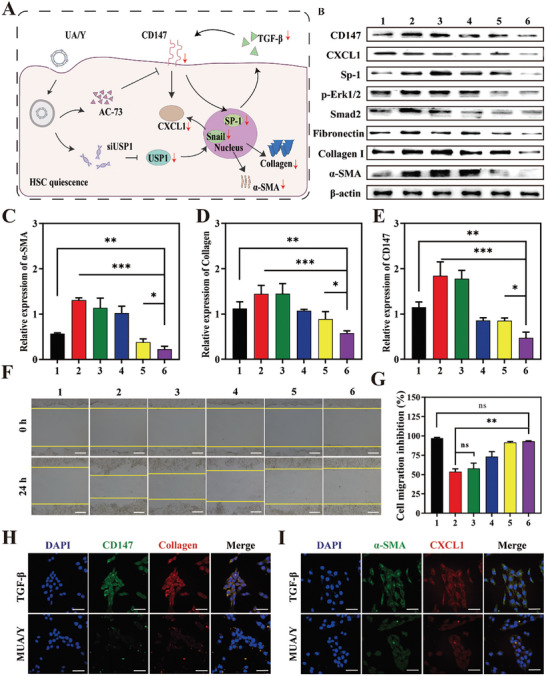
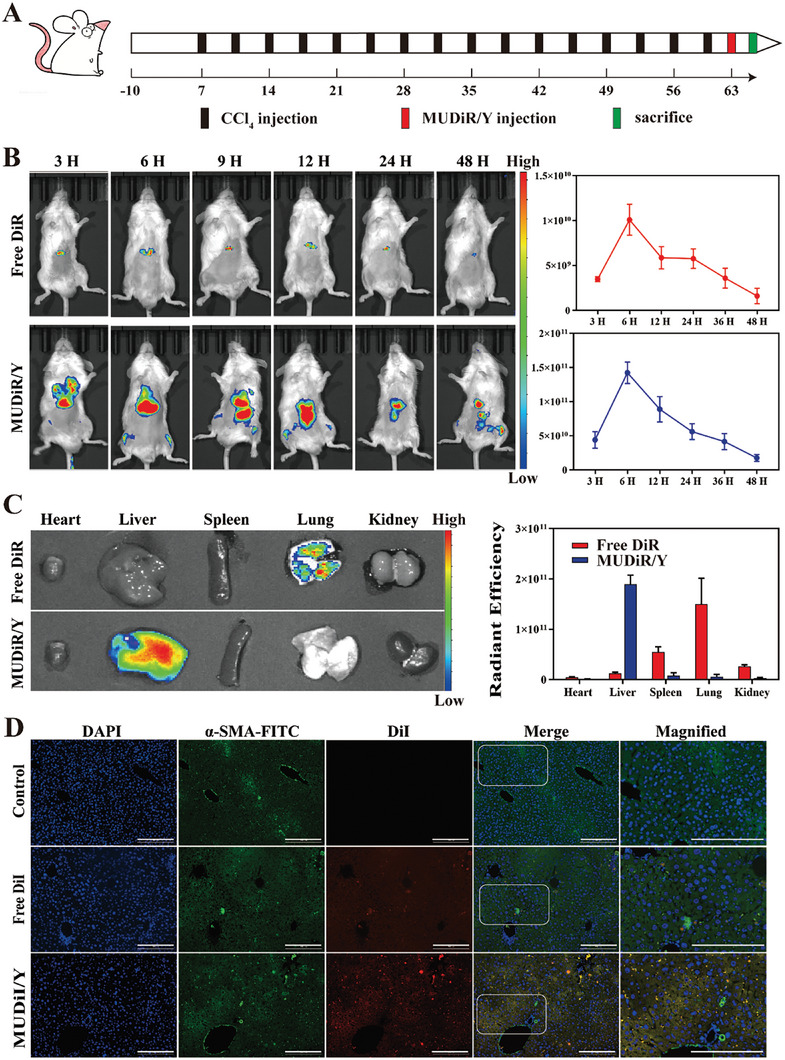
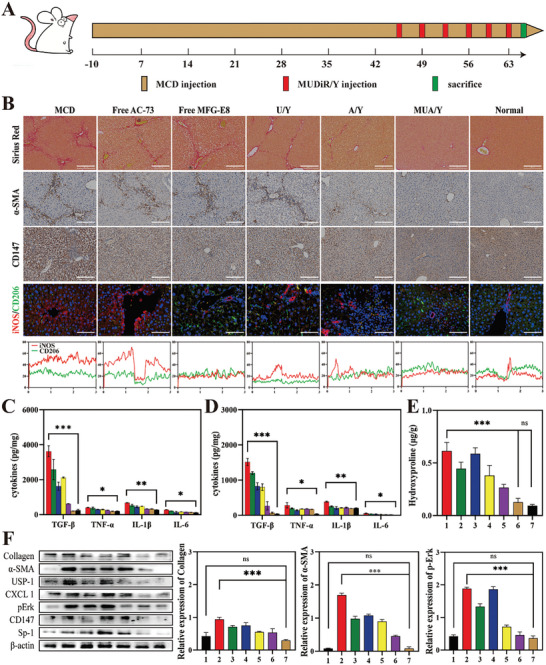
In advanced liver fibrosis (LF), macrophages maintain the inflammatory environment in the liver and accelerate LF deterioration by secreting proinflammatory cytokines. However, there is still no effective strategy to regulate macrophages because of the difficulty and complexity of macrophage inflammatory phenotypic modulation and the insufficient therapeutic efficacy caused by the extracellular matrix (ECM) barrier. Here, AC73 and siUSP1 dual drug-loaded lipid nanoparticle is designed to carry milk fat globule epidermal growth factor 8 (MFG-E8) (named MUA/Y) to effectively inhibit macrophage proinflammatory signals and degrade the ECM barrier. MFG-E8 is released in response to the high reactive oxygen species (ROS) environment in LF, transforming macrophages from a proinflammatory (M1) to an anti-inflammatory (M2) phenotype and inducing macrophages to phagocytose collagen. Collagen ablation increases AC73 and siUSP1 accumulation in hepatic stellate cells (HSCs) and inhibits HSCs overactivation. Interestingly, complete resolution of liver inflammation, significant collagen degradation, and HSCs deactivation are observed in methionine choline deficiency (MCD) and CCl4 models after tail vein injection of MUA/Y. Overall, this work reveals a macrophage-focused regulatory treatment strategy to eliminate LF progression at the source, providing a new perspective for the clinical treatment of advanced LF.

Keywords: advanced hepatic fibrosis; hepatic stellate cells; in situ collagen degradation; inflammation; lipid nanoparticle; macrophages.


Conflict of interest statement

The authors declare no conflict of interest.

Figures

Scheme 1
Scheme 1
Schematic illustration of the MUA/Y lipid nanoparticles. A)The formation of A/Y and MUA/Y lipid nanoparticles. B) Under high ROS conditions in vivo, i) MFG‐E8 was released ii) and subsequently induced macrophage phenotype transformation and phagocytosis of collagen, iii) then AC73 and siUSP‐1 inhibited HSCs activation and proliferation, thereby exerting an anti‐LF effect.
Figure 1
Figure 1
Macrophages influence the progression of LF. A) The process of M1 and M2 macrophages induced by LPS and IL‐4. B‐C) Detection of iNOS and CD206 expression in M1 and M2 macrophages by flow cytometry. D) CLSM images of immunofluorescence staining of α‐SMA of HSC after activated by M1 macrophage supernatant. Scale bar = 20 µm. E) Western blot analysis of α‐SMA in HSCs induced by M1 macrophages supernatant. The expression of collagen I, α‐SMA, and vimentin were normalized to the expression of β‐actin (n = 3). F) The process of M1 macrophage phenotype reversion by MFG‐E8. G) Detection of iNOS and CD206 expression by flow cytometry after incubation with MFG‐E8. Data represented mean ± SD, *p < 0.05, ***p < 0.001.
Figure 2
Figure 2
Expression of CXCL1 and CD147 in activated HSCs. A) CLSM images of CXCL1 (red) and α‐SMA (green) immunostaining in activated and quiet HSCs. Scale bars = 10 µm. B) Detection of CXCL1 and SMA expression in activated HSCs by flow cytometry. C) Western blot analysis of USP1, CXCL1, and α‐SMA in HSCs after undergoing different treatments. (n = 3, mean ± SD). D) CLSM images of CD147 (red) and collagen I (green) immunostaining in activated and quiet HSCs. Scale bars = 10 µm. E) CLSM images of CXCL1 (red) and CD147 (green) immunostaining in HSCs after being stimulated by TGF‐β. Scale bars = 10 µm. F,G) Detection of CXCL1/collagen I and CD147/CXCL1 co‐expression in activated HSCs by flow cytometry. H) Western blot analysis of CD147, CXCL1, and α‐SMA in HSCs after undergoing different treatments. The expression of CD147, CXCL1, and α‐SMA were normalized to the expression of β‐actin. (n = 3). Data represented mean ± SD, *p < 0.05, **p < 0.01, ***p < 0.001.
Figure 3
Figure 3
Characterization of MUA/Y lipid nanoparticles. A) The illustration on the formation of A/Y and MUA/Y. B) The DLE% and EE% of AC73 in MUA/Y lipid nanoparticles at different drug/phospholipid ratios (n = 3). C) The fluorescent spectrum of FITC excited RhB treated with RhB‐MFG‐E8@FITC/Y lipid nanoparticles. D) The structural changes of MFG‐E8 were verified by circular dichroism (CD). E) Size distribution and TEM result of MUA/Y. TEM Scale bar = 500 nm. F) In vitro colloidal stability of MUA/Y in water, PBS, and FBS for 72 h (n = 3). G) Time‐dependent AC73 release of free AC73 and MUA/Y in PBS at pH 5.0, and 7.4 (n = 3). H) ROS response ability of MUA/Y lipid nanoparticles. Scale bars = 100 µm. Data were represented as mean ± SD.
Figure 4
Figure 4
Characterization of collagen phagocytosis, cellular uptake, and endosome escape of MUA/Y lipid nanoparticles. A) The process of collagen phagocytosis mediates by MFG‐E8. B) The process of MFG‐E8 mediated macrophages ablate collagen. C) Fluorescence intensity in HSCs detected by fluorescence microscopy. Scale bars = 100 µm. D) FITC‐modified collagen was endocytosed by RAW264.7. The image was captured by CLSM. Scale bars = 10 µm. E) The process of MUA/Y endocytosed escape in HSCs. F) CLSM images of cellular uptake of free C6, C6/Y, and MUC6/Y under 2 and 4 h. Scale bars = 20 µm. G) Transfection efficiency of siLuc loaded lipid nanoparticles detected by fluorescence microscopy. Scale bars = 100 µm. H) Semiquantitative analyze of the Luc positive area of fluorescent cells. (n = 3). Data represented mean ± SD. ns: no significant difference, *p < 0.05, ***p < 0.001.
Figure 5
Figure 5
Mechanisms of MUA/Y lipid nanoparticles in HSCs. A) Mechanisms of HSCs activation and recovery after treatment. B) The expression of CXCL1, CD147, Sp‐1, Erk1/2, Smad2, fibronectin, collagen I, and α‐SMA in HSCs undergoing different formulations. 1 means PBS group, 2 means TGF group, 3 means free AC73 group, 4 means siUSP1/Y, 5 means AC/Y, 6 means UA/Y. C–E) Densitometric quantification of western blotting results in each group. The expression of α‐SMA, collagen I and CD147 were normalized to β‐actin. (n = 3). F) Images for cell scratch assay of HSCs at 0 and 24 h (n = 3). Scale bars = 100 µm. G) Semi‐quantified of the scratch area of each group, the scratch area in each groups were normalized to PBS group (n = 3). H,I) CLSM images of CD147 (green)/CoI (red) and SMA (green)/CXCL1 (red) immunostaining in HSCs after treatment (n = 3). Scale bars = 100 µm. Data were represented as mean ± SD, ns: no significant difference, *p < 0.05, **p < 0.01, ***p < 0.001.
Figure 6
Figure 6
Biodistribution and Intrahepatic distribution of MUA/Y lipid nanoparticles after intravenous injection. Mice received DIR‐loaded liposomes and free DiR administration 72 h after the last CCl4 injection. A) Schedule of the establishment of the mice LF model. B) Images of DiR tissue distribution in fibrotic mice in different groups at the indicated time points (n = 3) and quantities analysis of fluorescence intensity. C) Images of DiR distribution in main organ in different groups at the indicated time points (n = 3) and quantities analysis of fluorescence intensity. D) Analysis of the intrahepatic distribution of the AC73 (DiI) in fibrotic liver. Scale bars = 100 µm.
Figure 7
Figure 7
MUA/Y effectively inhibited the progression of MCD‐induced LF. A) Establishment and treatment strategy of advanced LF model. B) Representative images of Sirius red, α‐SMA, CD147 immunohistochemistry, and iNOS/CD206 immunofluorescence stained liver sections, scale bars = 100 µm. C,D) TGF‐β, IL‐1β, IL‐6, and TNF‐α levels in serum and liver tissue (n = 3). E) The hydroxyproline (Hyp) level in the liver of mice in each treatment group (n = 3). The group sequence was similar to Figure 7B. F) The expression level of Collagen I, α‐SMA, p‐Erk, CXCL1, CD147, USP1, Sp‐1 undergoing different formulation and the Semi‐quantitative analysis of Collagen I, α‐SMA, p‐Erk. 1 means normal, 2 means fibrosis group, 3 means free AC73 group, 4 means free MFG group, 5 means U/Y group, 6 means A/Y group and 7 means MUA/Y. The expression of α‐SMA, collagen I and p‐Erk were normalized to the expression of β‐actin. Data were represented as mean ± SD. *p < 0.05, **p < 0.01, ***p < 0.001, ns: no significant difference.

References

    1. Shetty S., Patten D., Rantakari P., Weston C., Jalkanen S., Salmi M., Adams D., Lancet 2017, 389, S15.
    1. Reig M., Cabibbo G., J. Hepatol. 2021, 74, 1225. - PubMed
    1. Rosen H. R., Ghany M. G., Chung R. T., Lok A. S. F., Hepatology 2017, 66, 1020. - PMC - PubMed
    1. Fan R., Li G., Yu N., Chang X., Arshad T., Liu W.‐Y., Chen Y., Wong G. L.‐H., Jiang Y., Liang X., Chen Y., Jin X.‐Z., Dong Z., Leung H. H.‐W., Wang X.‐D., Zeng Z., Yip T. C.‐F., Xie Q., Tan D., You S., Ji D., Zhao J., Sanyal A. J., Sun J., Zheng M.‐H., Wong V. W.‐S., Yang Y., Hou J., Clin. Gastroenterol. Hepatol. 2023, 21, 3070. - PubMed
    1. Fang W., Deng Z., Benadjaoud F., Yang C., Shi G.‐P., Transl. Res. 2020, 222, 28. - PMC - PubMed

Publication types