. 2023 Dec 1;6(12):e2346864.
doi: 10.1001/jamanetworkopen.2023.46864.

US County-Level Variation in Preterm Birth Rates, 2007-2019

Affiliations

US County-Level Variation in Preterm Birth Rates, 2007-2019

Sadiya S Khan et al. JAMA Netw Open. .

Abstract

Importance: Preterm birth is a leading cause of preventable neonatal morbidity and mortality. Preterm birth rates at the national level may mask important geographic variation in rates and trends at the county level.

Objective: To estimate age-standardized preterm birth rates by US county from 2007 to 2019.

Design, setting, and participants: This serial cross-sectional study used data from the National Center for Health Statistics composed of all live births in the US between 2007 and 2019. Data analyses were performed between March 22, 2022, and September 29, 2022.

Main outcomes and measures: Age-standardized preterm birth (<37 weeks' gestation) and secondarily early preterm birth (<34 weeks' gestation) rates by county and year calculated with a validated small area estimation model (hierarchical bayesian spatiotemporal model) and percent change in preterm birth rates using log-linear regression models.

Results: Between 2007 and 2019, there were 51 044 482 live births in 2383 counties. In 2007, the national age-standardized preterm birth rate was 12.6 (95% CI, 12.6-12.7) per 100 live births. Preterm birth rates varied significantly among counties, with an absolute difference between the 90th and 10th percentile counties of 6.4 (95% CI, 6.2-6.7). The gap between the highest and lowest counties for preterm births was 20.7 per 100 live births in 2007. Several counties in the Southeast consistently had the highest preterm birth rates compared with counties in California and New England, which had the lowest preterm birth rates. Although there was no statistically significant change in preterm birth rates between 2007 and 2019 at the national level (percent change, -5.0%; 95% CI, -10.7% to 0.9%), increases occurred in 15.4% (95% CI, 14.1%-16.9%) of counties. The absolute and relative geographic inequalities were similar across all maternal age groups. Higher quartile of the Social Vulnerability Index was associated with higher preterm birth rates (quartile 4 vs quartile 1 risk ratio, 1.34; 95% CI, 1.31-1.36), which persisted across the study period. Similar patterns were observed for early preterm birth rates.

Conclusions and relevance: In this serial cross-sectional study of county-level preterm and early preterm birth rates, substantial geographic disparities were observed, which were associated with place-based social disadvantage. Stability in aggregated rates of preterm birth at the national level masked increases in nearly 1 in 6 counties between 2007 and 2019.


Conflict of interest statement

Conflict of Interest Disclosures: Dr Khan reported receiving grants from the National Institutes of Health during the conduct of the study and outside the submitted work. Dr Mehran reported receiving grants from Abbott, Abiomed, Affluent Medical, Alleviant Medical, Amgen, AM-Pharma, Applied Therapeutics, Arena, AstraZeneca, AtriCure Inc, Biosensors, Biotronik, Boston Scientific, Bristol-Myers Squibb, CardiaWave, CeloNova, Chiesi, Concept Medical, CSL Behring, Cytosorbents, Daiichi Sankyo, Duke, Element Science, Faraday, Humacyte, Idorsia, I-Laser, Janssen, Magenta, MedAlliance, Medscape, Mediasphere, Medtelligence, Medtronic, MJH Healthcare, Novartis, OrbusNeich, Penumbra, PhaseBio, Philips, Pi-Cardia, PLx Pharma, Protembis, RenalPro, RM Global, Shockwave, Transverse Medical Inc, Vivasure, Zoll, Applied Therapeutics, Elixir Medical, and Stel, having a spouse with equity in ControlRad, receiving personal fees from Affluent Medical, Cardiovascular Research Foundation, Daiichi Sankyo Brasil, E.R. Squibb & Sons, Esperion Science/Innovative Biopharma, Europa Group/Boston Scientific, Gaffney Events, Educational Trust, Ionis Pharmaceuticals, J-CalC, Novartis, NovoNordisk, Vectura, VoxMedia, IQVIA, McVeigh Global, Overcome, Primer Healthcare of New Jersey, Radcliffe, SL Solutions, Tarsus Medical Education, and WebMD, and serving on the American Medical Association Scientific Advisory Board, the Women in Innovations Committee of the Society for Cardiovascular Angiography & Interventions, and the Board of Trustees of the American College of Cardiology during the conduct of the study. No other disclosures were reported.

Figures

Figure 1.
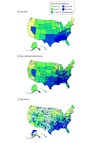
Figure 1.. Age-Standardized Preterm Birth Rates in 2019 Among US States, Combined Statistical Areas, and Counties, for Those Aged 15 to 44 Years
Age-standardized rates of preterm (<37 weeks’ gestation) are displayed across varying geographic scales in the US, with darker blue representing higher rates. For a county to be included on these maps, the estimated rates were required to be reliable (ie, the credible interval width was less than the point estimate) and the total number of births was 100 or greater for every year in the study period.
Figure 2.
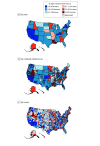
Figure 2.. Total Percent Change in Age-Standardized Preterm Birth Rates Between 2007 and 2019 Among US States, Combined Statistical Areas, and Counties, for Those Aged 15 to 44 Years
County-level percent change is displayed for preterm births (<37 weeks’ gestation), with darker red representing greater increases and darker blue representing greater decreases between 2007 and 2019 in the US. Mapped values are the point estimates of percent change calculated using log-linear regression from estimated rates. For a county to be included on these maps, the estimated rates were required to be reliable (ie, the credible interval width was less than the point estimate) and the total number of births was 100 or greater for every year in the study period.
Figure 3.
Figure 3.. Distributions of Trends Among US Counties for Preterm Birth Between 2007 and 2019 Overall and Stratified by 5-Year Age Groups
The proportion of counties with varying magnitudes of increases and decreases are displayed for the overall sample as well as in each 5-year age stratum. Statistically significant increases were calculated using log-linear regression based on 95% CIs that did not overlap with 0.

References

    1. Goldenberg RL, Culhane JF, Iams JD, Romero R. Epidemiology and causes of preterm birth. Lancet. 2008;371(9606):75-84. doi:10.1016/S0140-6736(08)60074-4 - DOI - PMC - PubMed
    1. Martin JA, Hamilton BE, Osterman M. Births in the United States, 2020. NCHS Data Brief. 2021;(418):1-8. - PubMed
    1. Blencowe H, Cousens S, Oestergaard MZ, et al. . National, regional, and worldwide estimates of preterm birth rates in the year 2010 with time trends since 1990 for selected countries: a systematic analysis and implications. Lancet. 2012;379(9832):2162-2172. doi:10.1016/S0140-6736(12)60820-4 - DOI - PubMed
    1. Grandi SM, Filion KB, Yoon S, et al. . Cardiovascular disease-related morbidity and mortality in women with a history of pregnancy complications: systematic review and meta-analysis. Circulation. 2019;139(8):1069-1079. doi:10.1161/CIRCULATIONAHA.118.036748 - DOI - PubMed
    1. Nuyt AM, Lavoie JC, Mohamed I, Paquette K, Luu TM. Adult consequences of extremely preterm birth: cardiovascular and metabolic diseases risk factors, mechanisms, and prevention avenues. Clin Perinatol. 2017;44(2):315-332. doi:10.1016/j.clp.2017.01.010 - DOI - PubMed

Publication types