

A Biobanking System for Diagnostic Images: Architecture Development, COVID-19-Related Use Cases, and Performance Evaluation
- PMID: 38064636
- PMCID: PMC10760513
- DOI: 10.2196/42505
A Biobanking System for Diagnostic Images: Architecture Development, COVID-19-Related Use Cases, and Performance Evaluation
Abstract
Background: Systems capable of automating and enhancing the management of research and clinical data represent a significant contribution of information and communication technologies to health care. A recent advancement is the development of imaging biobanks, which are now enabling the collection and storage of diagnostic images, clinical reports, and demographic data to allow researchers identify associations between lifestyle and genetic factors and imaging-derived phenotypes.
Objective: The aim of this study was to design and evaluate the system performance of a network for an operating biobank of diagnostic images, the Bio Check Up Srl (BCU) Imaging Biobank, based on the Extensible Neuroimaging Archive Toolkit open-source platform.
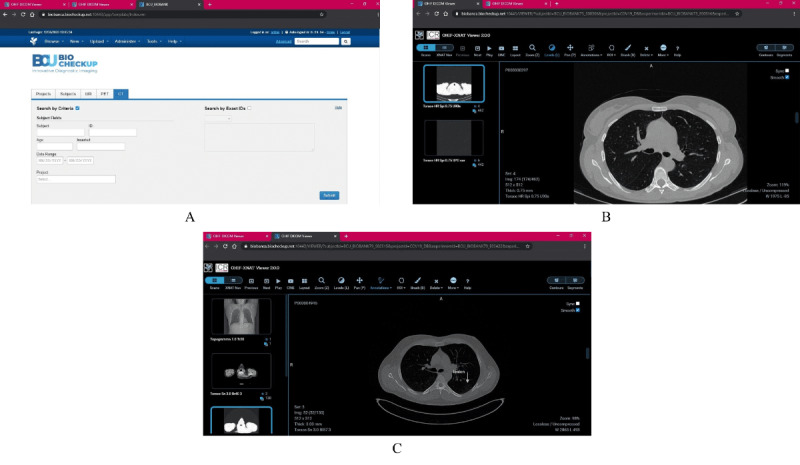
Methods: Three usage cases were designed focusing on evaluation of the memory and computing consumption during imaging collections upload and during interactions between two kinds of users (researchers and radiologists) who inspect chest computed tomography scans of a COVID-19 cohort. The experiments considered three network setups: (1) a local area network, (2) virtual private network, and (3) wide area network. The experimental setup recorded the activity of a human user interacting with the biobank system, which was continuously replayed multiple times. Several metrics were extracted from network traffic traces and server logs captured during the activity replay.
Results: Regarding the diagnostic data transfer, two types of containers were considered: the Web and the Database containers. The Web appeared to be the more memory-hungry container with a higher computational load (average 2.7 GB of RAM) compared to that of the database. With respect to user access, both users demonstrated the same network performance level, although higher resource consumption was registered for two different actions: DOWNLOAD & LOGOUT (100%) for the researcher and OPEN VIEWER (20%-50%) for the radiologist.
Conclusions: This analysis shows that the current setup of BCU Imaging Biobank is well provisioned for satisfying the planned number of concurrent users. More importantly, this study further highlights and quantifies the resource demands of specific user actions, providing a guideline for planning, setting up, and using an image biobanking system.
Keywords: COVID-19; biobank; diagnostics; eHealth; network performance.
©Giuseppina Esposito, Ciro Allarà, Marco Randon, Marco Aiello, Marco Salvatore, Giuseppe Aceto, Antonio Pescapè. Originally published in JMIR Formative Research (https://formative.jmir.org), 21.12.2023.
Conflict of interest statement
Conflicts of Interest: None declared.
Figures


References
-
- Behar JA, Liu C, Kotzen K, Tsutsui K, Corino VDA, Singh J, Pimentel MAF, Warrick P, Zaunseder S, Andreotti F, Sebag D, Kopanitsa G, McSharry PE, Karlen W, Karmakar C, Clifford GD. Remote health diagnosis and monitoring in the time of COVID-19. Physiol Meas. 2020 Nov 10;41(10):10TR01. doi: 10.1088/1361-6579/abba0a. https://europepmc.org/abstract/MED/32947271 - DOI - PMC - PubMed
-
- Whaiduzzaman M, Hossain MR, Shovon AR, Roy S, Laszka A, Buyya R, Barros A. A privacy-preserving mobile and fog computing framework to trace and prevent COVID-19 community transmission. IEEE J Biomed Health Inform. 2020 Dec;24(12):3564–3575. doi: 10.1109/JBHI.2020.3026060. https://europepmc.org/abstract/MED/32966223 - DOI - PMC - PubMed
-
- World Health Organization Future of digital health systems. WHO Symposium on the Future of Digital Health Systems in the European Region; February 6-8, 2019; Copenhagen, Denmark. 2019.
-
- Zhang H, Zhang J, Zhang H, Nan Y, Zhao Y, Fu E, Xie Y, Liu W, Li W, Zhang H, Jiang H, Li C, Li Y, Ma R, Dang S, Gao B, Zhang X, Zhang T. Automated detection and quantification of COVID-19 pneumonia: CT imaging analysis by a deep learning-based software. Eur J Nucl Med Mol Imaging. 2020 Oct 14;47(11):2525–2532. doi: 10.1007/s00259-020-04953-1. https://europepmc.org/abstract/MED/32666395 10.1007/s00259-020-04953-1 - DOI - PMC - PubMed
LinkOut - more resources
Full Text Sources
Miscellaneous
