. 2023 Dec 7;30(12):1658-1673.e10.
doi: 10.1016/j.stem.2023.11.006.

SON is an essential m6A target for hematopoietic stem cell fate

Affiliations

SON is an essential m6A target for hematopoietic stem cell fate

Hanzhi Luo et al. Cell Stem Cell. .

Abstract

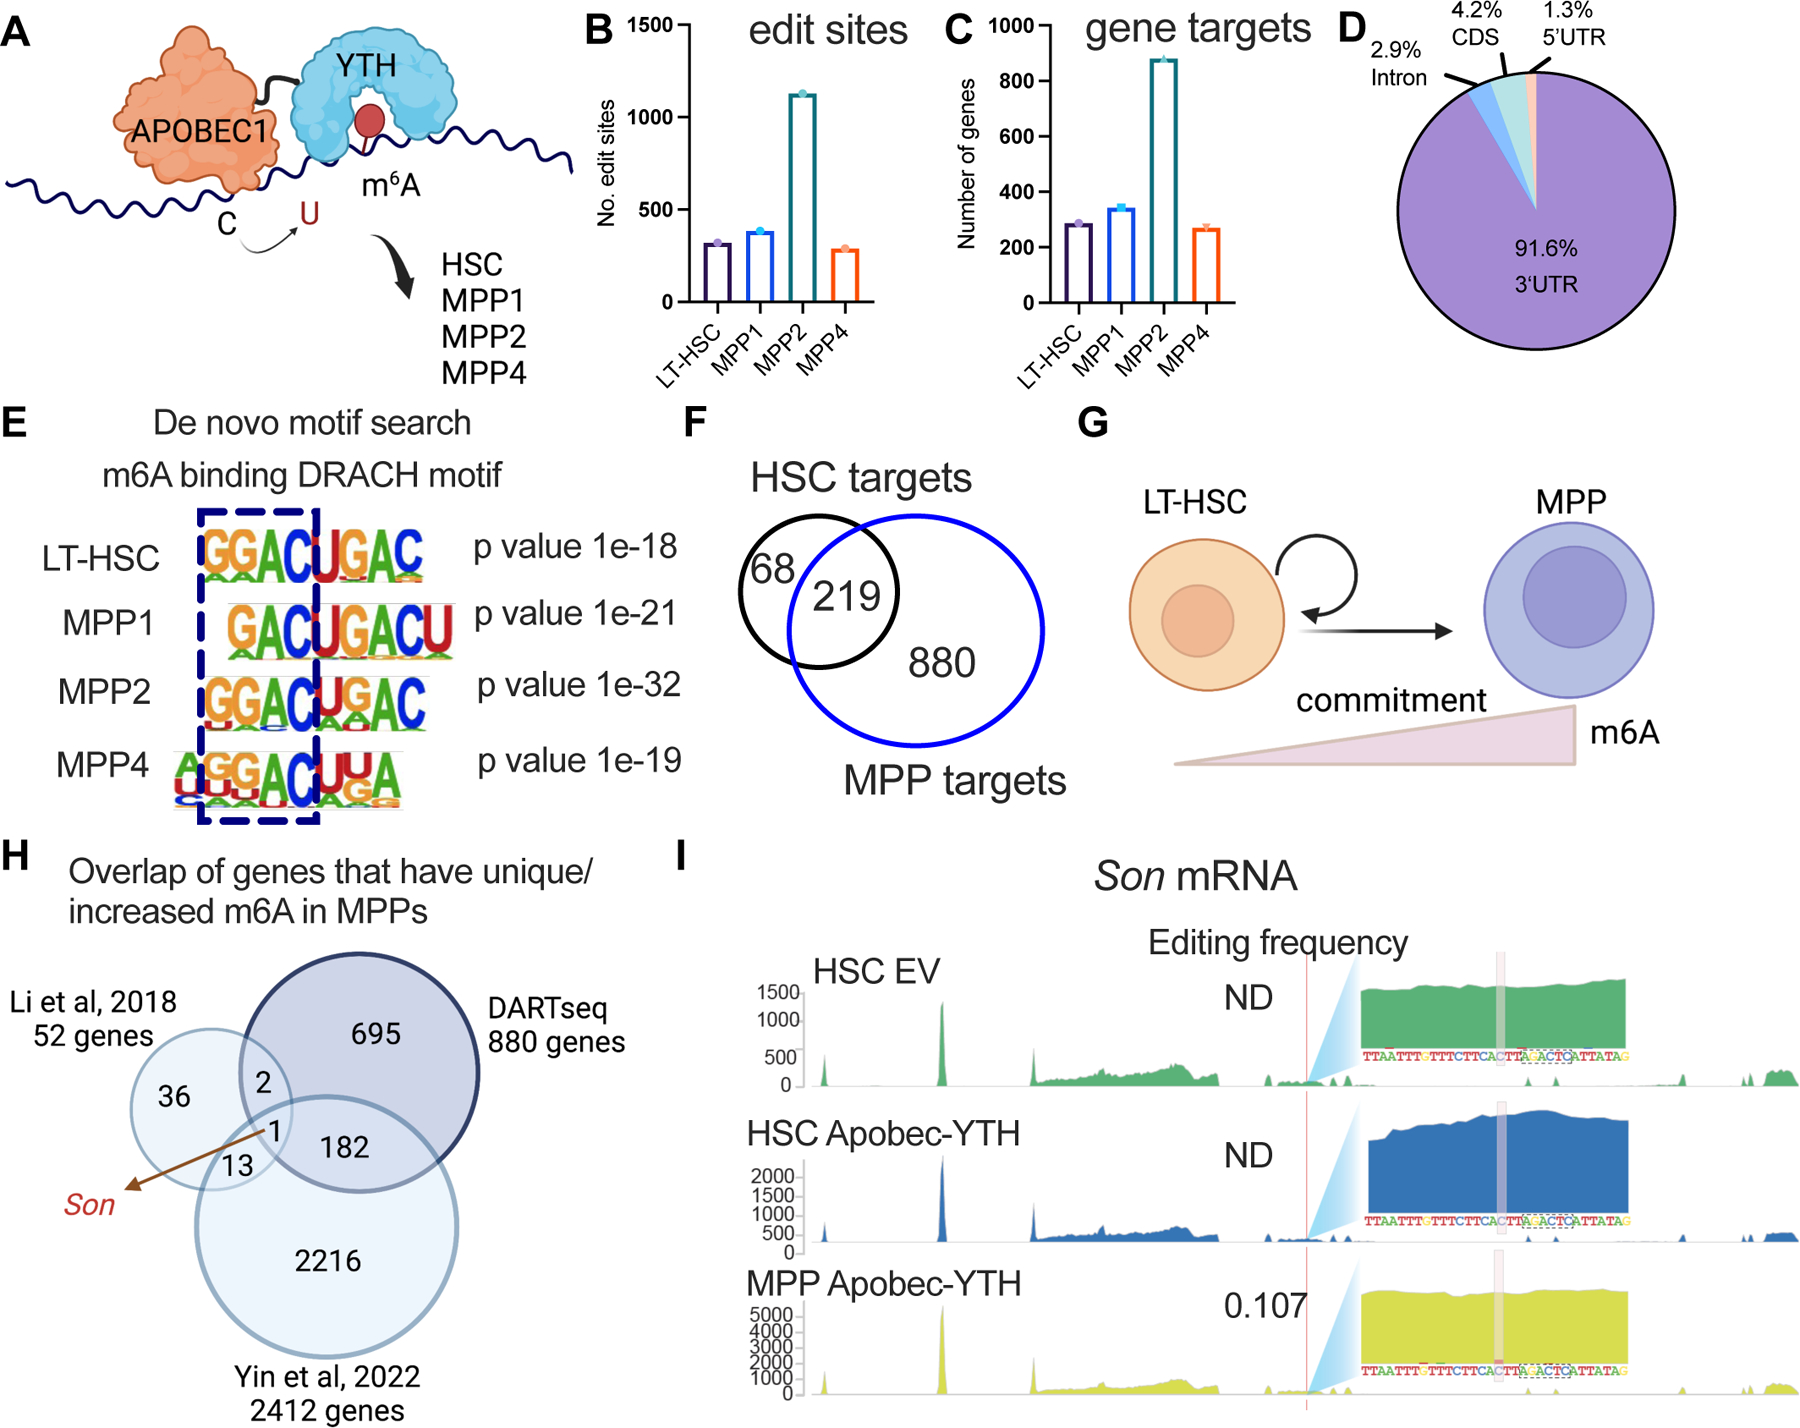
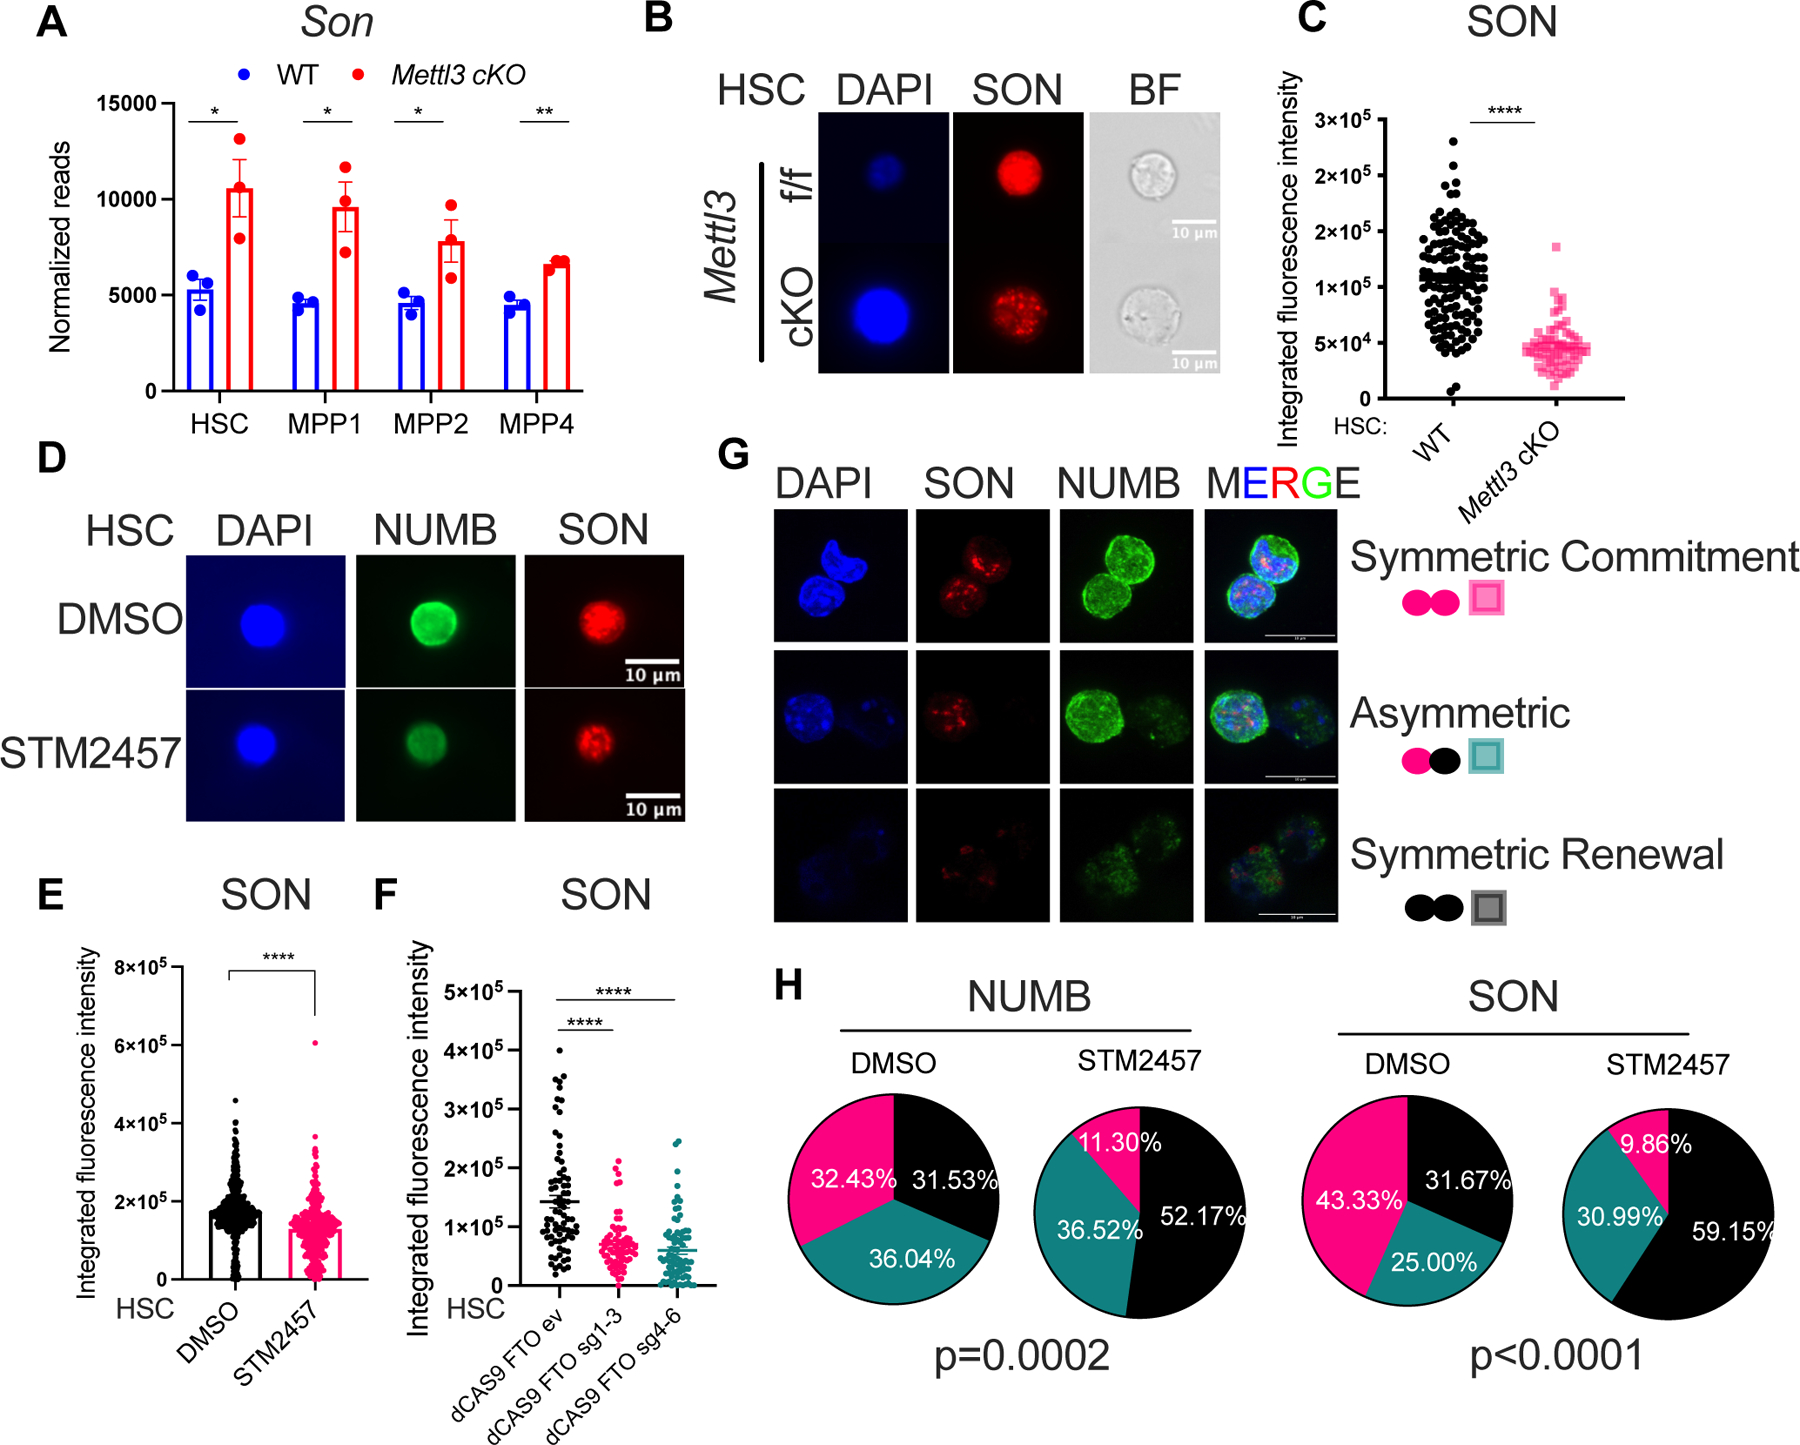
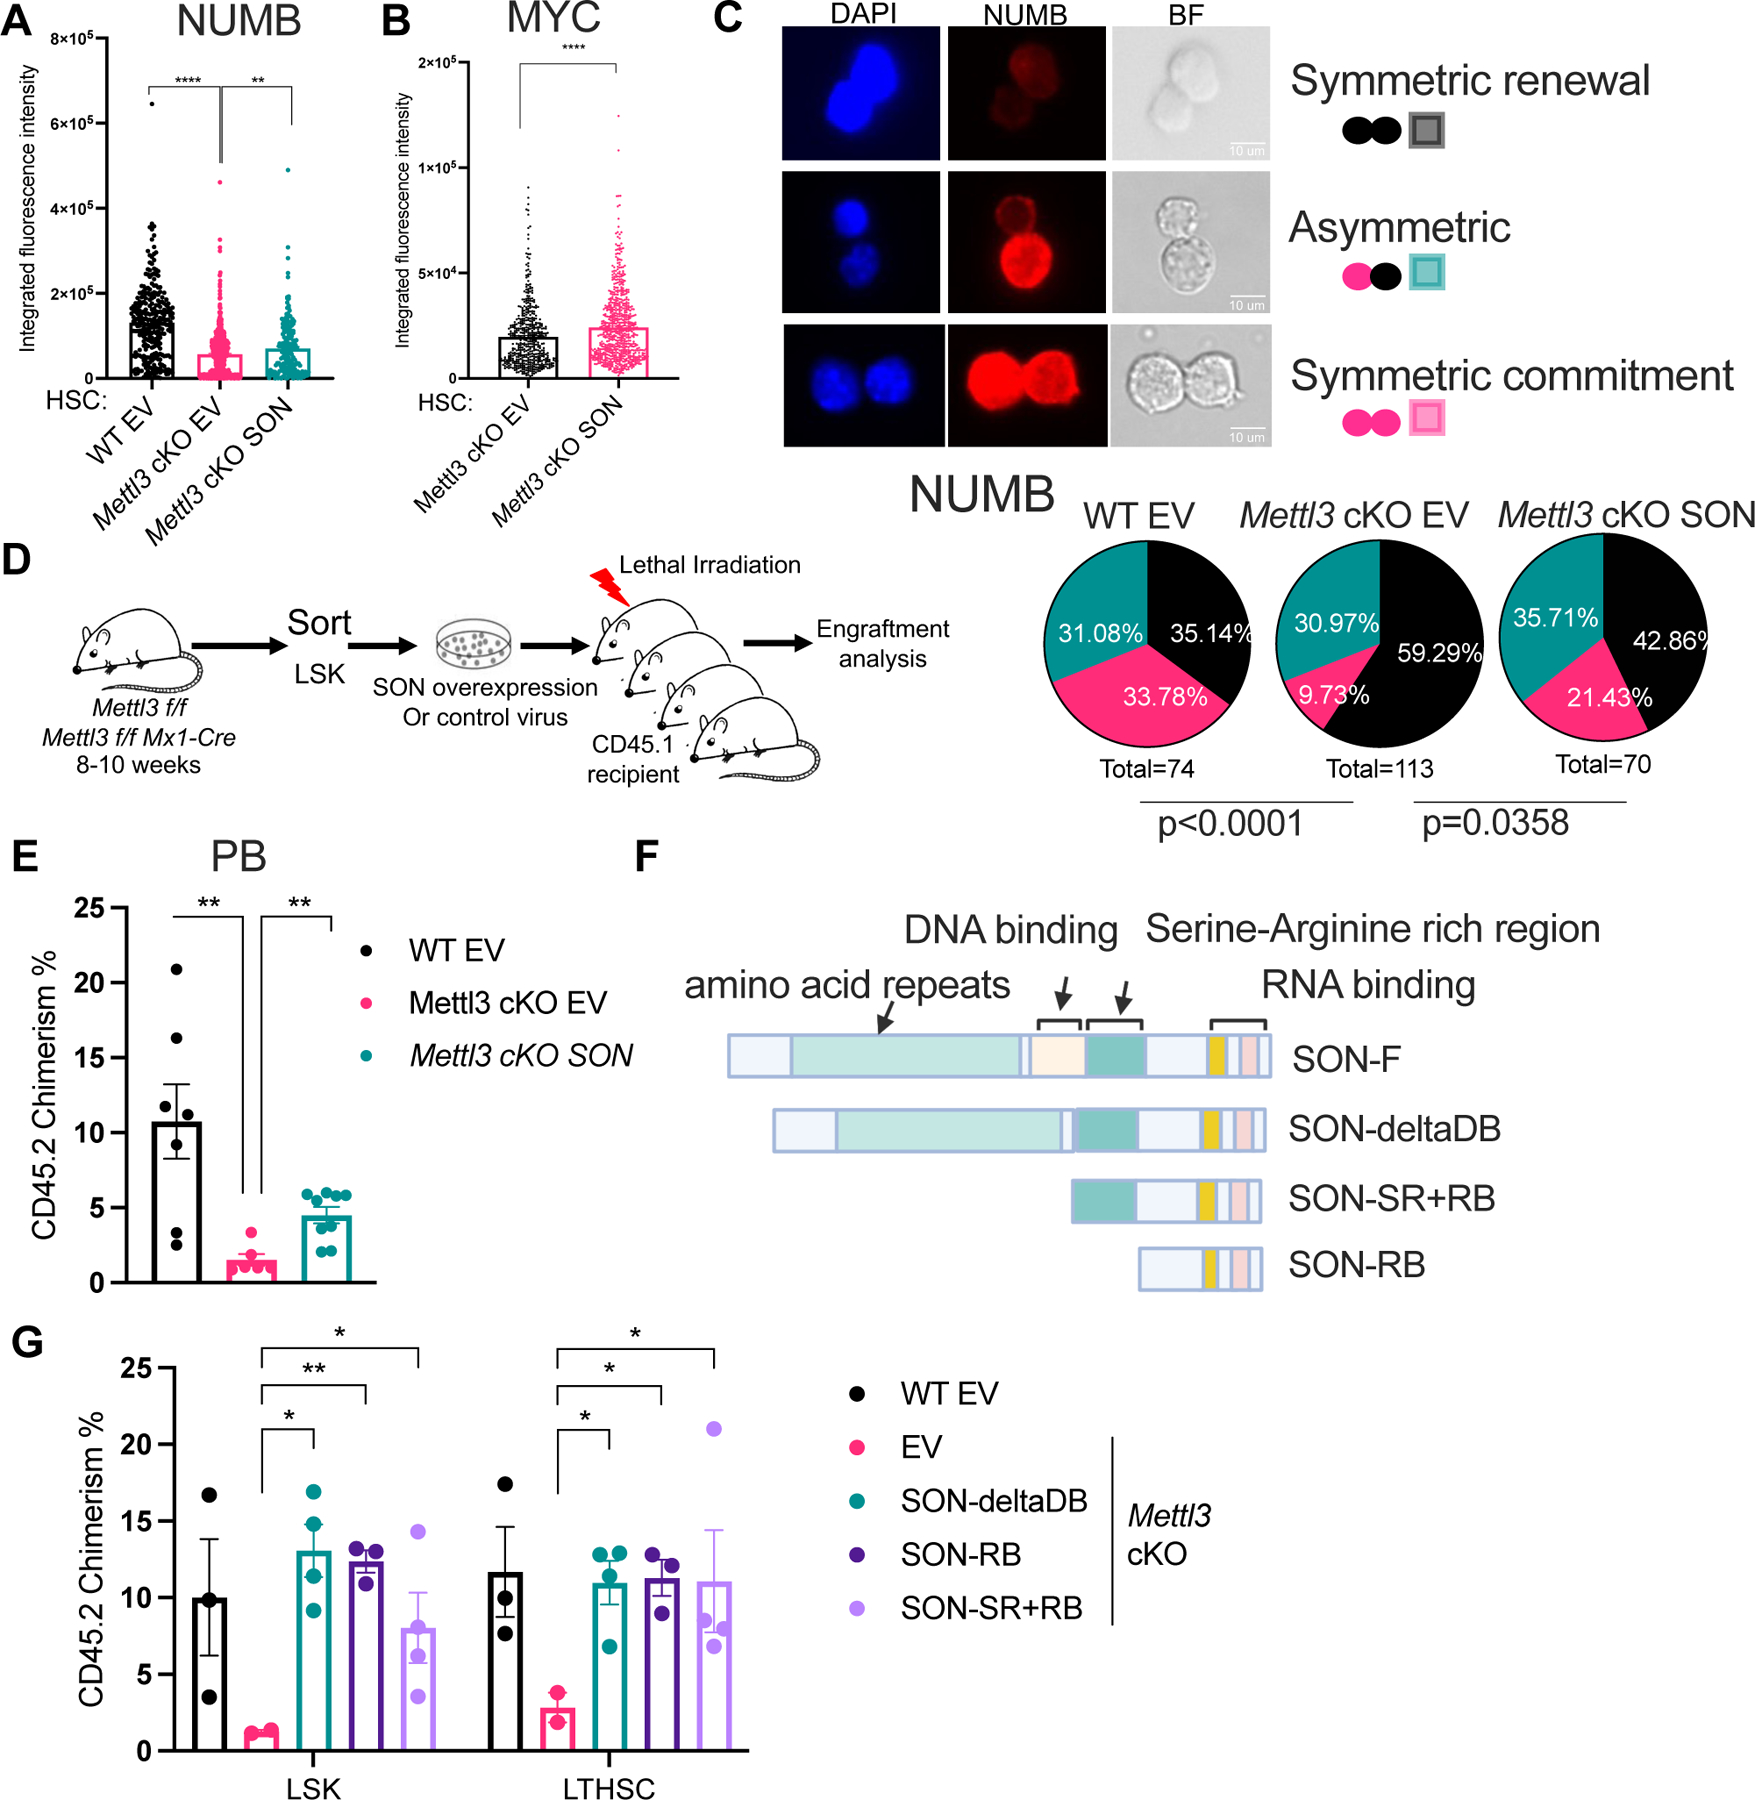
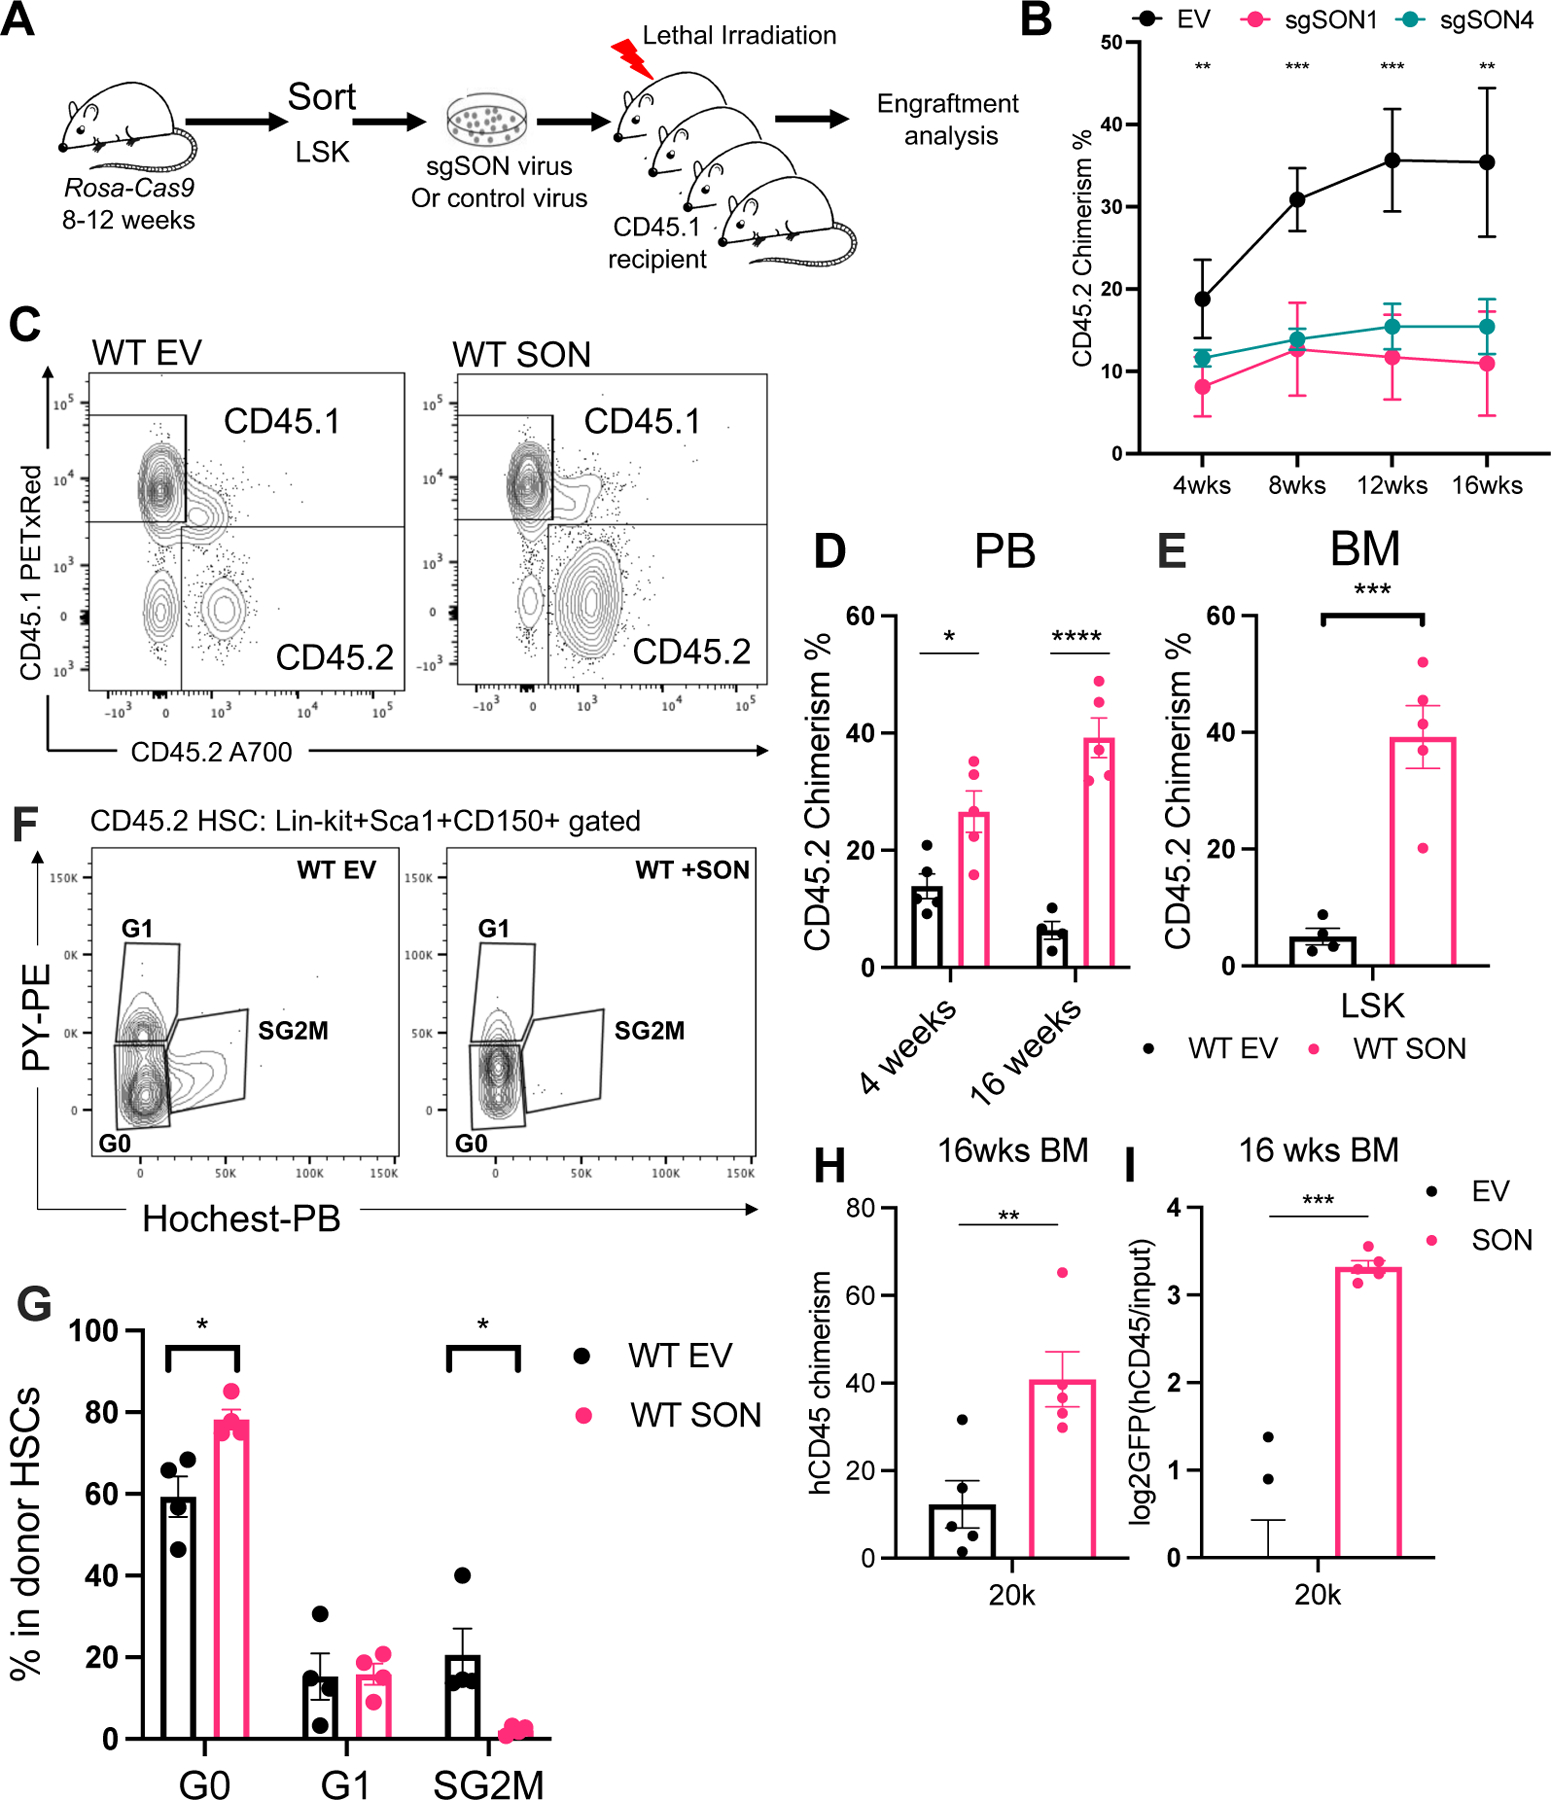
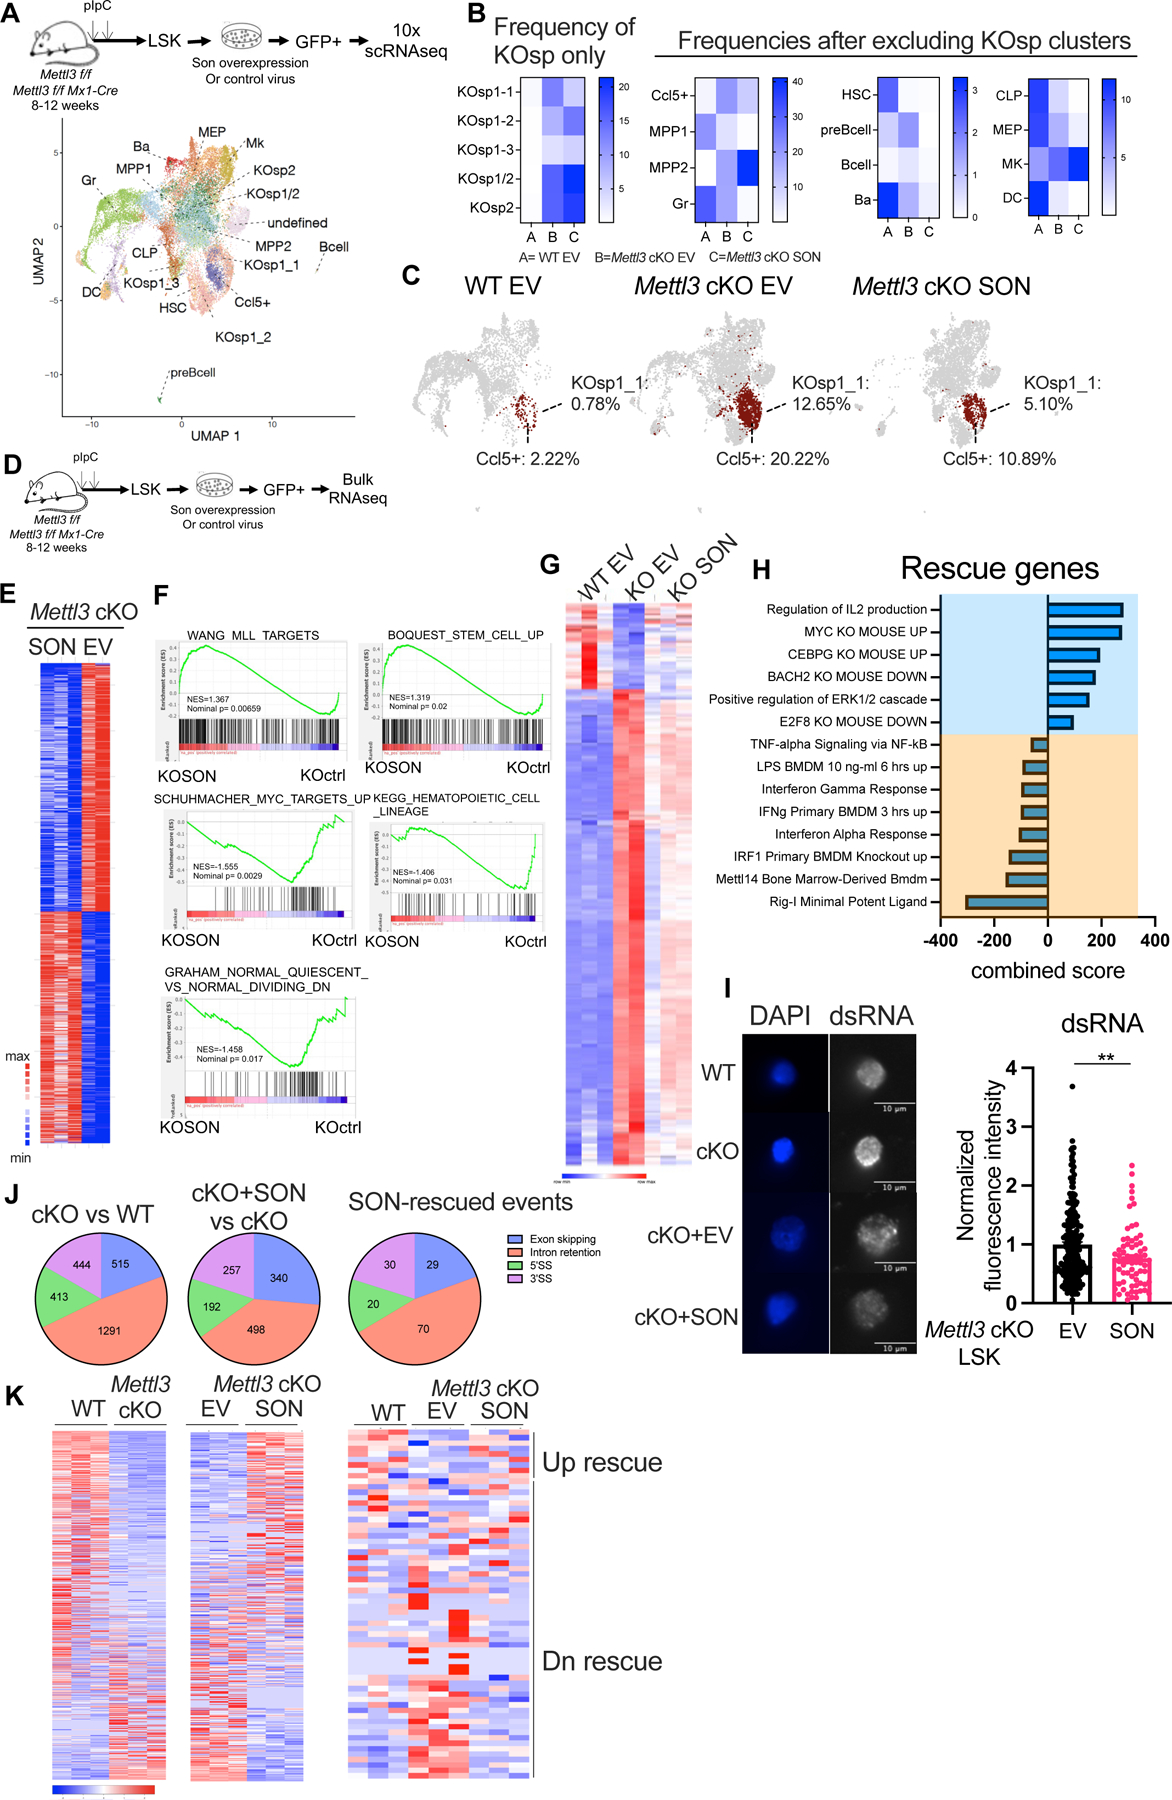
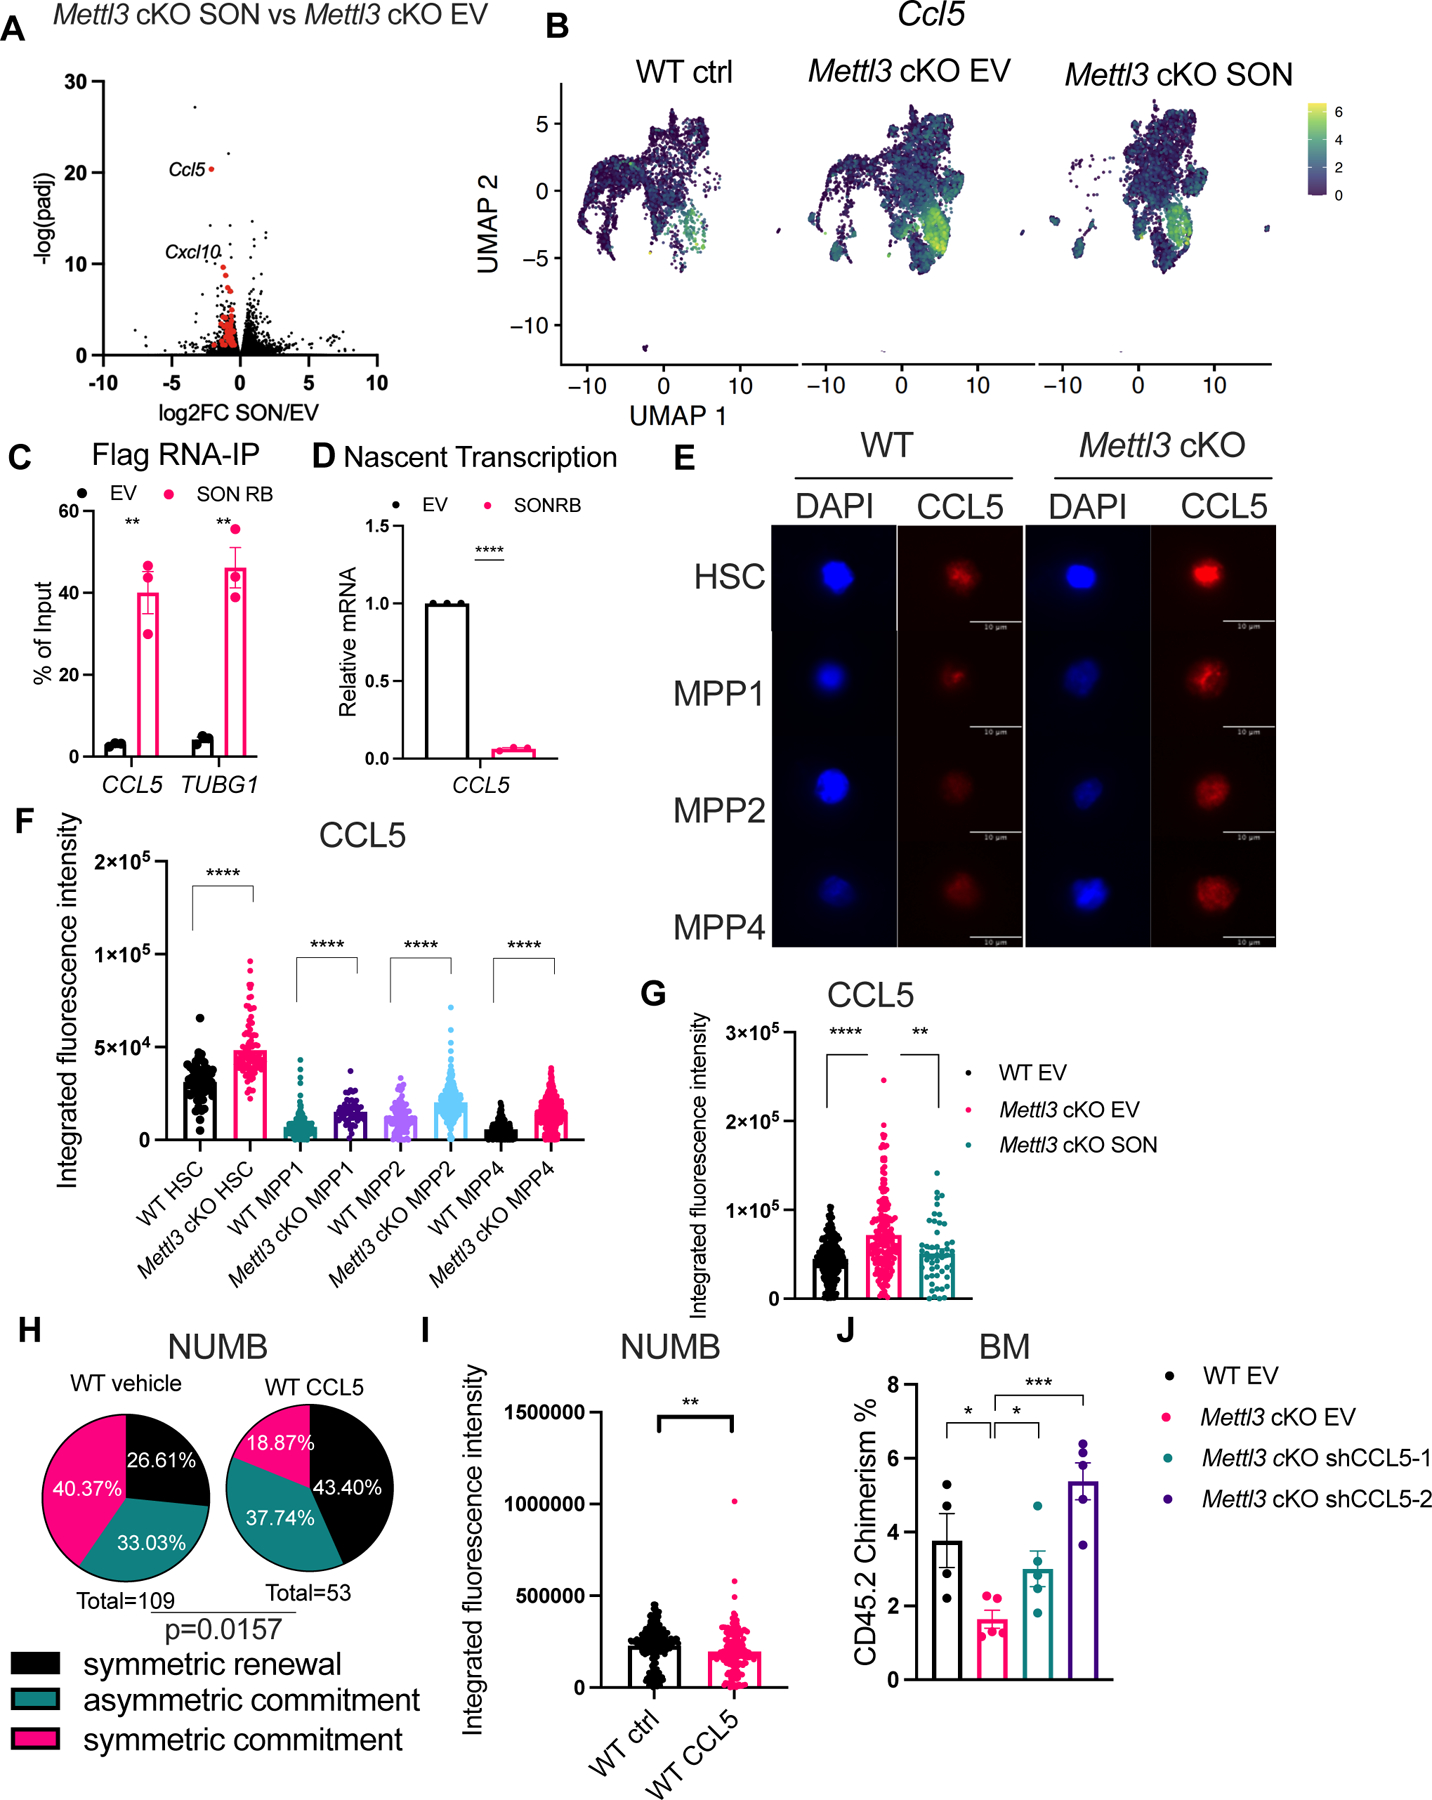
Stem cells regulate their self-renewal and differentiation fate outcomes through both symmetric and asymmetric divisions. m6A RNA methylation controls symmetric commitment and inflammation of hematopoietic stem cells (HSCs) through unknown mechanisms. Here, we demonstrate that the nuclear speckle protein SON is an essential m6A target required for murine HSC self-renewal, symmetric commitment, and inflammation control. Global profiling of m6A identified that m6A mRNA methylation of Son increases during HSC commitment. Upon m6A depletion, Son mRNA increases, but its protein is depleted. Reintroduction of SON rescues defects in HSC symmetric commitment divisions and engraftment. Conversely, Son deletion results in a loss of HSC fitness, while overexpression of SON improves mouse and human HSC engraftment potential by increasing quiescence. Mechanistically, we found that SON rescues MYC and suppresses the METTL3-HSC inflammatory gene expression program, including CCL5, through transcriptional regulation. Thus, our findings define a m6A-SON-CCL5 axis that controls inflammation and HSC fate.

Keywords: RNA binding proteins; RNA methylation; RNA modifications; SON; cell fate; differentiation; hematopoietic stem cells; inflammation; nuclear speckles; stem cells.


Conflict of interest statement

Declaration of interests M.G.K. is a SAB member of 858 Therapeutics and received honorarium from Kumquat, AstraZeneca, and consulting at Transition Bio. D.A.L. has served as a consultant for AbbVie, AstraZeneca, and Illumina and is on the Scientific Advisory Board of Mission Bio, Pangea, Alethiomics, and C2i Genomics; D.A.L. has received prior research funding from BMS, 10x Genomics, Ultima Genomics, and Illumina unrelated to the current manuscript.

Figures

Figure 1:
Figure 1:. DART-seq identifies SON as a m6A target in mouse HSCs. See also Figure S1 and Table S1–S3.
(A) DART-seq experimental scheme in sorted mouse HSC, MPP1, MPP2, and MPP4s. (B) DART-seq identified significant edit sites from n=3 independent experiments. (sites with padj<0.1, differential editing > 0.1 were defined as significant sites). (C) DART-seq identified significant target genes from n=3. independent experiments. (cut-off for significance: padj<0.1, differential editing > 0.1). (D) DART-seq targets in mouse HSCs mainly localized to 3’UTR. (E) De novo motif search analysis using edit sites in mouse HSCs and MPPs. (F) Majority of HSC DART-seq targets overlap with MPP DART-seq targets. (G) Scheme of genes whose m6A modifications increase from HSC to MPP commitment. (H) Overlap of sites that have unique/increased m6A modification during HSC to MPP commitment with two other published datasets (m6A-seq and SLIMseq). (I) Representative track showing the C to U edit site on Son transcript and its adjacency to a DRACH motif. Editing frequencies in each sample was annotated. Yellow boxed ‘C’s were the edit sites and the sequences boxed with dotted black line were the adjacent DRACH motif. n=3 independent experiments. EV: empty vector.
Figure 2:
Figure 2:. Depletion of m6A reduces SON protein abundance. See also Figure S2.
(A) Increased Son mRNA level in Mettl3 cKO HSC and MPPs. n=3, n represents number of mice. (B) Representative immunofluorescence images of SON protein abundance in WT and Mettl3 cKO HSCs. Scale bar: 10μm. (C) Reduced SON protein abundance by immunofluorescence in Mettl3 cKO HSCs. n=3 independent experiments. (D) Representative immunofluorescence images of SON protein abundance in WT HSCs with DMSO or STM2457 treatment (20μM 40hr). Scale bar: 10μm. (E) Reduced SON protein abundance in WT HSCs with STM2457 treatment (20μM 40hr) measured by immunofluorescence. (F) Targeted demethylation of Son mRNA reduced SON protein abundance in WT HSCs. (G) Representative confocal immunofluorescence images of HSC paired daughter cell assays. Paired daughter cells were stained with DAPI (blue), NUMB (green), SON (red). Scale bar: 10μm. (H) Percentages of doublet cells in each type of cell division in WT HSCs with STM2457 treatment (20μM 40hr) measured by immunofluorescence. Number of daughter pairs assessed: n=111 (WT HSC quantified using NUMB IF); n=115 (WT HSC STM2457 quantified using NUMB IF); n=60 (WT HSC quantified using SON IF); n=71 (WT HSC STM2457 quantified using SON IF). P value was calculated using Chi-square test. n=2 independent experiments. Data in (A), (C), (E), (F) represent means ± s.e.m. , * represents p < 0.05. ** represents p < 0.01. *** represents p < 0.001. **** represents p<0.0001. ns represents p > 0.05.
Figure 3:
Figure 3:. Forced SON expression rescues the function of m6A deficient HSCs. See also Figure S3.
(A) NUMB expression in Mettl3 cKO HSCs with SON overexpression compared to Mettl3 cKO HSCs and WT (Mettl3 f/f) HSCs as quantified by immunofluorescence. EV: empty vector controls; n=3 independent experiments. (B) MYC expression in Mettl3 cKO HSCs with SON overexpression compared to Mettl3 cKO HSCs as quantified by immunofluorescence. n=2 independent experiments. (C) SON overexpression in Mettl3 cKO HSC rescues its symmetric commitment defect measured by NUMB symmetric high divisions. Above: representative immunofluorescence images of paired daughter cells stained with DAPI (blue), NUMB (red), and brightfield. Scale bar: 10μm. Below: percentages of doublet cells in each type of cell division. n=74 (WT HSC EV); n=113 (Mettl3 cKO EV); n=70 (Mettl3 cKO SON); P value was calculated using Chi-square test. (D) Scheme of transplant strategy in (E). (E) Quantification of the frequency of donor-derived cells was shown in the peripheral blood at 4-week post transplantation, n = 6–9. n represents number of mice. Representative of three independent experiments. (F) Scheme of SON truncation mutants. (G) Quantification of the frequency of donor-derived cells was shown in the bone marrow LSK population 16 weeks post transplantation. n=2–4, n represents number of mice. Representative of three independent experiments. Data in (A), (B), (E), (G) represent means ± s.e.m. , * represents p < 0.05. ** represents p < 0.01. *** represents p < 0.001. **** represents p<0.0001. ns represents p > 0.05.
Figure 4:
Figure 4:. SON controls hematopoietic stem cell fate. See also Figure S4.
(A) Scheme of the transplantation experiment in (B). (B) Donor CD45.2 chimerism over 16 weeks in the peripheral blood. n=2–5, n represents number of mice. Representative of two independent experiments. (C) Peripheral blood donor engraftment in 4- and 16-weeks post transplantation. n=4–5, n represents number of mice. Representative of two independent experiments. (D) Representative flow cytometry plots of the CD45.1 and CD45.2 engraftment in the peripheral blood in experiments shown in (C). (E) SON overexpression in WT LSKs resulted in increased donor engraftment in the LSK population 16 weeks post transplantation. n=4–5, n represents number of mice. (F) Representative flow cytometry plots of cell cycle analysis using Hoechst and Pyronin Y staining in the CD45.2+ Lin-Ckit+Sca1+CD150+ population. (G) Quantification of cell cycle status of the CD45.2 Lin-Ckit+Sca1+CD150+ population. n=4, n represents number of mice. (H) Human CD45 engraftment 16 weeks post transplantation were plotted. n=5, n represents number of mice. Representative of three independent experiments. (I) GFP frequency in the hCD45 engrafted population were measured and the relative enrichment of GFP+ donor cells were plotted at 16 weeks post transplantation. n=5, n represents number of mice. Data in (B), (D), (E), (G), (H), (I) represent means ± s.e.m. , * represents p < 0.05. ** represents p < 0.01. *** represents p < 0.001. **** represents p<0.0001. ns represents p > 0.05.
Figure 5:
Figure 5:. SON partially rescues the inflammatory program in Mettl3 cKO HSCs. See also Figure S5 and Table S4–9.
(A) Cell-type cluster assignments in Mettl3 f/f and Mettl3 cKO LSK cells transduced with EV (empty vector) or SON overexpressing lentivirus, overlaid on a uniform manifold approximation and projection (UMAP) of the single-cell RNA sequencing (scRNA-seq). (B) Quantification of cell frequencies of different clusters in WT EV, Mettl3 cKO EV and Mettl3 cKO SON LSK cells based on scRNA-seq. (C) SON overexpression rescues the frequency of KOsp1–1 and CCL5+ clusters, labeled as red.(D) Scheme of the bulk RNA-seq experiment. n=3 WT ctrl; n=2 Mettl3 cKO ctrl; n=3 Mettl3 cKO SON; n represents independent experiments. (E) Heatmap showing the differential expressed genes between the Mettl3 cKO EV and Mettl3 cKO SON overexpressing LSK cells. (cut-off for differential expressed genes: padj <0.1) (F) GSEA analysis showing the pathways enriched in the Mettl3 cKO SON overexpressing cells using the gene expression rank-list comparing Mettl3 cKO EV vs Mettl3 cKO SON in LSKs. (G) Heatmap showing the differential expressed genes between the WT EV, Mettl3 cKO EV and Mettl3 cKO SON overexpressing LSK cells. (cut-off for differential expressed genes: padj <0.1) (H) Enrichr pathway enrichment of the genes that were differentially expressed between Mettl3 f/f and Mettl3 cKO and were rescued by SON overexpressing in Mettl3 cKO LSKs. (cut-off for differential expressed genes: padj < 0.1) (I) Left: Representative immunofluorescence images of dsRNA abundance in WT, Mettl3 cKO LSKs, Mettl3 cKO empty vector and Mettl3 cKO SON LSKs. Scale bar: 10μm. Right: Quantification of dsRNA abundance by immunofluorescence. Data were pooled and normalized to EV group. n=3 independent experiments. (J) Percentage of alternative splicing events compared between Mettl3 cKO EV versus WT EV LSKs, Mettl3 cKO SON versus Mettl3 cKO EV LSK and SON rescue alternative splicing events were shown as pie charts. 3’SS: alternative 3’ splice site; 5’SS: alternative 5’ splice site. (cut-off for differential splicing events: padj <= 0.05, abs(diff_mean) >= 0.05) (K) Left: differential intron retention events between WT EV and Mettl3 cKO EV LSKs. Middle: differential intron retention events between Mettl3 cKO EV and Mettl3 cKO SON LSKs. Right: differential intron retention events between WT and Mettl3 cKO LSKs that were rescued by SON overexpression. (cut-off for differential intron retention events: padj <= 0.05, abs(diff_mean) >= 0.05)。 Data in (I) represent means ± s.e.m. , * represents p <0.05. ** represents p < 0.01. *** represents p < 0.001. **** represents p<0.0001. ns represents p > 0.05.
Figure 6:
Figure 6:. CCL5 is a downstream of SON that controls HSC symmetric commitment fate. See also Figure S6.
(A) Ccl5 and Cxcl10 are among the most downregulated innate immune genes by SON overexpression in Mettl3 cKO LSKs shown by Volcano plot. Genes labeled in red are shown in Table S6. (B) Ccl5 expression in Mettl3 cKO LSKs in the scRNA-seq data projected in a UMAP, similar to (A). (C) RNA-IP in THP1 cells expressing empty vector (MIG) or SON-RB-Flag retrovirus followed by RNA extraction and qPCR of target genes. n=3–4, n represents independent experiments. (D) Nascent transcription of the CCL5 transcript in THP1 cells. n=3 independent experiments. (E) Representative immunofluorescence images of CCL5 protein abundance in WT and Mettl3 cKO HSCs and MPPs. Scale bar: 10μm. (F) Increased CCL5 protein abundance in Mettl3 cKO HSCs and MPPs. n=2 independent experiments. (G) CCL5 protein abundance in Mettl3 cKO LSKs. n=3 independent experiments. (H) Percentages of doublet cells in each type of cell division in WT HSCs with or without CCL5 treatment. n=109 (WT vehicle using NUMB IF); n=53 (WT CCL5 using NUMB IF); P value was calculated using Chi-square test. (I) CCL5 treatment in WT HSCs reduced NUMB protein abundance. n=2 independent experiments. (J) Quantification of the frequency of donor-derived cells was shown in the bone marrow 7 weeks post transplantation. n=4–5, n represents number of mice. Data in (C), (D), (F), (G), (I), (J) represent means ± s.e.m. , * represents p < 0.05. ** represents p < 0.01. *** represents p < 0.001. **** represents p<0.0001. ns represents p > 0.05.

References

    1. Laurenti E, and Gottgens B (2018). From haematopoietic stem cells to complex differentiation landscapes. Nature 553, 418–426. 10.1038/nature25022. - DOI - PMC - PubMed
    1. Seita J, and Weissman IL (2010). Hematopoietic stem cell: self-renewal versus differentiation. Wiley Interdiscip Rev Syst Biol Med 2, 640–653. 10.1002/wsbm.86. - DOI - PMC - PubMed
    1. Metcalf D (2007). On hematopoietic stem cell fate. Immunity 26, 669–673. 10.1016/j.immuni.2007.05.012. - DOI - PubMed
    1. Haas S, Trumpp A, and Milsom MD (2018). Causes and Consequences of Hematopoietic Stem Cell Heterogeneity. Cell Stem Cell 22, 627–638. 10.1016/j.stem.2018.04.003. - DOI - PubMed
    1. Brummendorf TH, Dragowska W, Zijlmans J, Thornbury G, and Lansdorp PM (1998). Asymmetric cell divisions sustain long-term hematopoiesis from single-sorted human fetal liver cells. J Exp Med 188, 1117–1124. 10.1084/jem.188.6.1117. - DOI - PMC - PubMed

Publication types