. 2023 Dec 8;14(1):8141.
doi: 10.1038/s41467-023-43974-w.

LncRNA MIR200CHG inhibits EMT in gastric cancer by stabilizing miR-200c from target-directed miRNA degradation

Affiliations

LncRNA MIR200CHG inhibits EMT in gastric cancer by stabilizing miR-200c from target-directed miRNA degradation

Yixiao Zhu et al. Nat Commun. .

Abstract

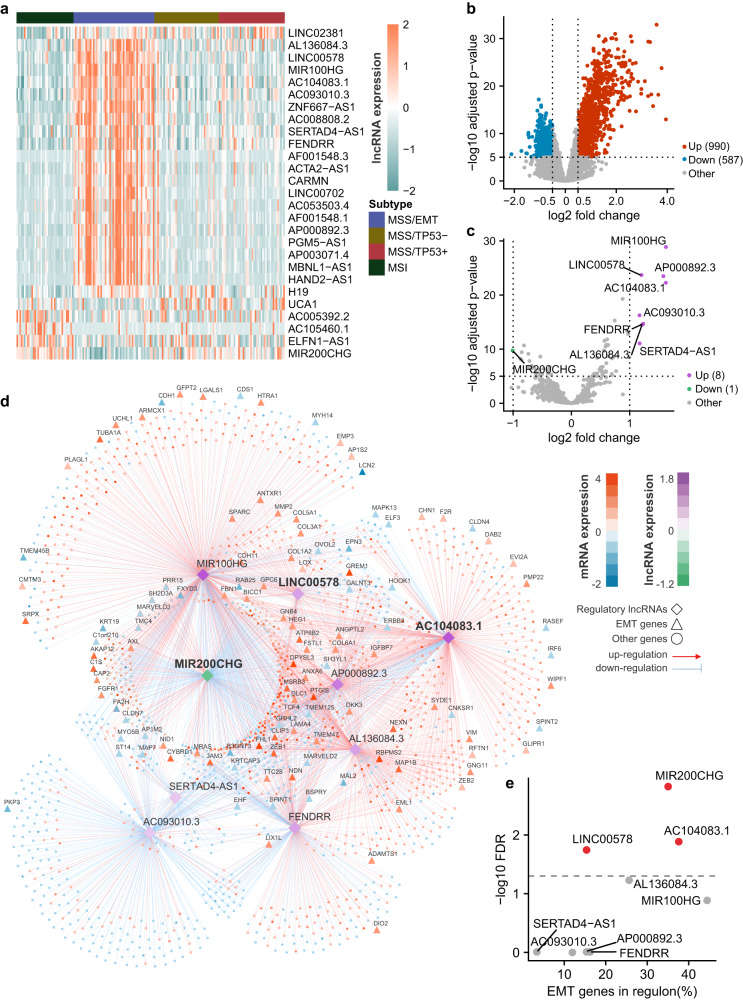
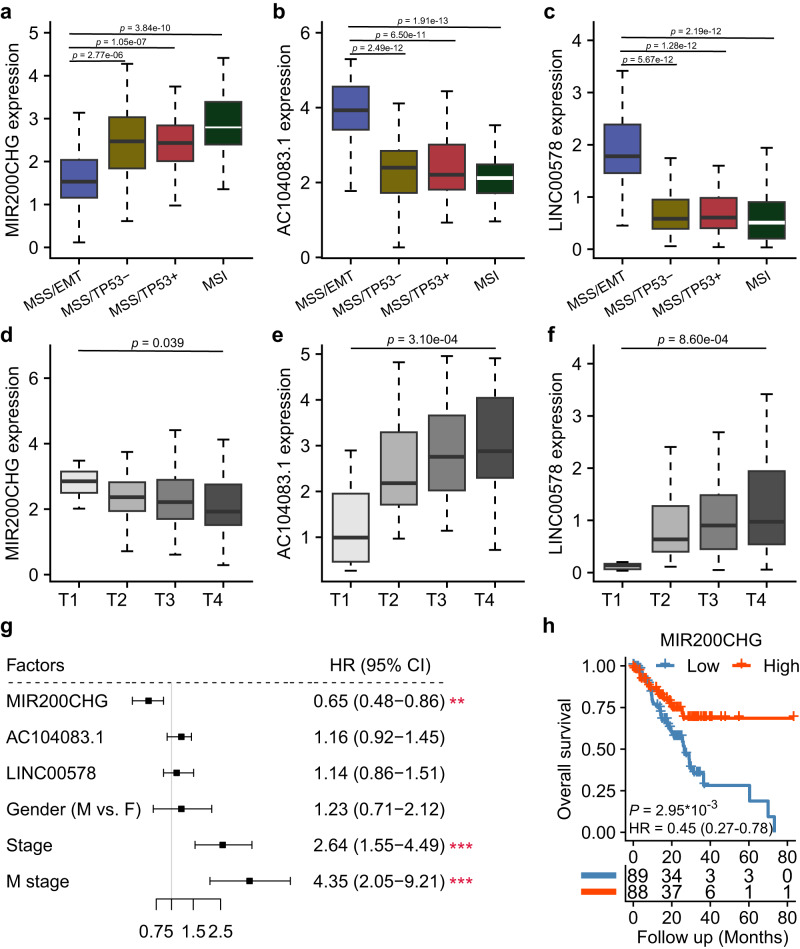
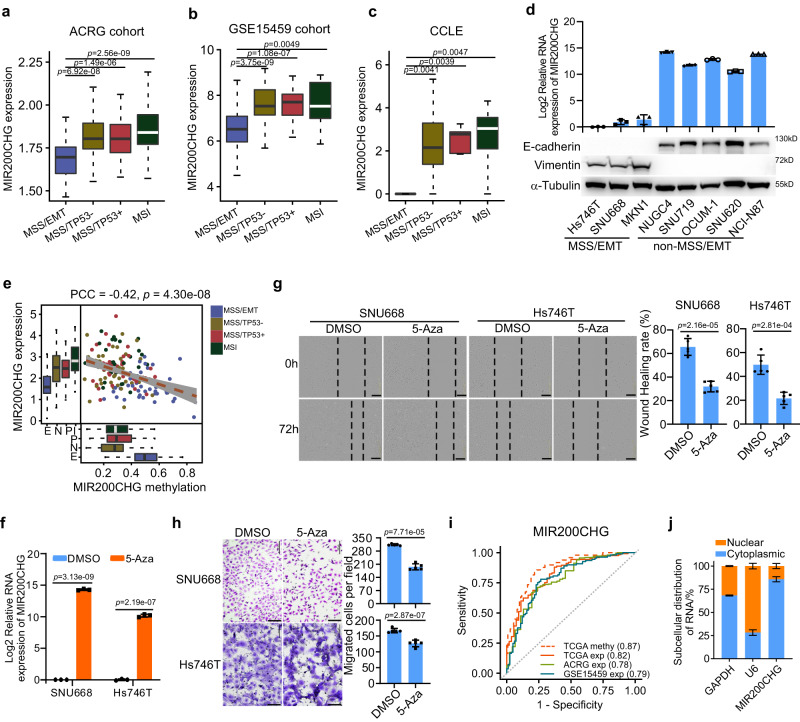
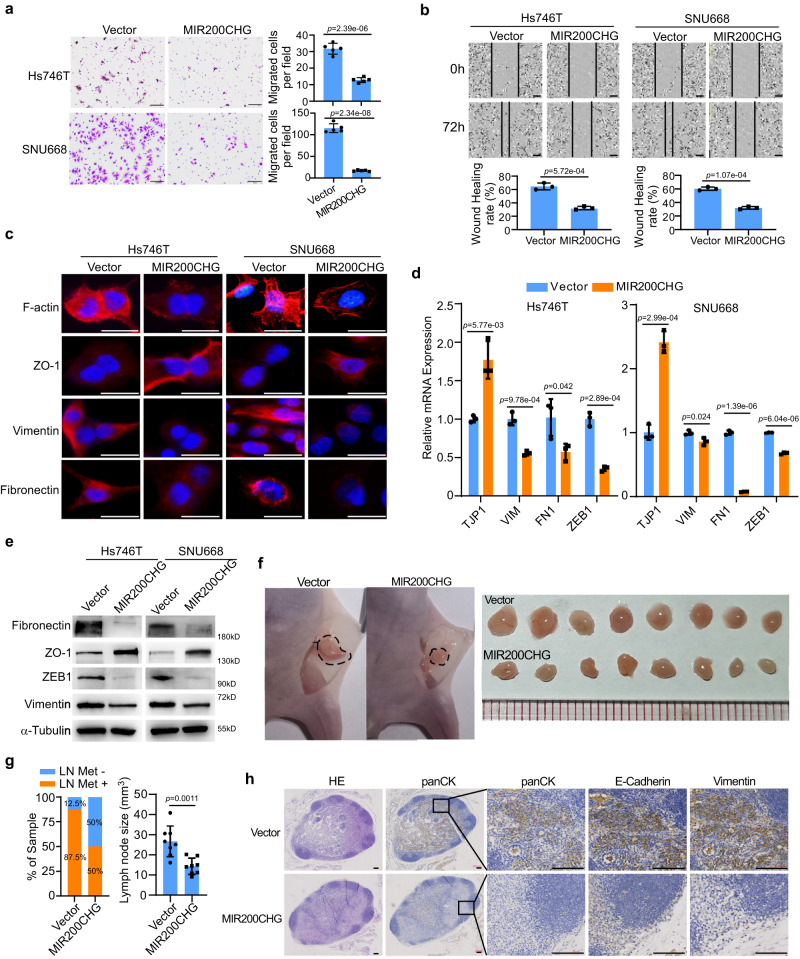
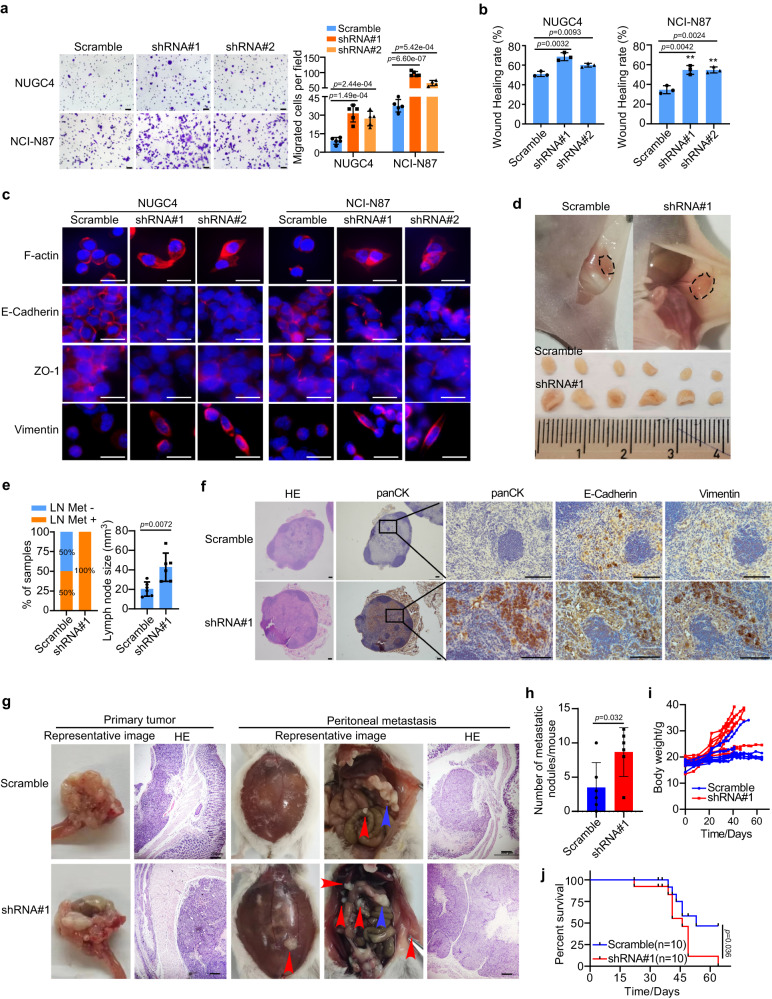
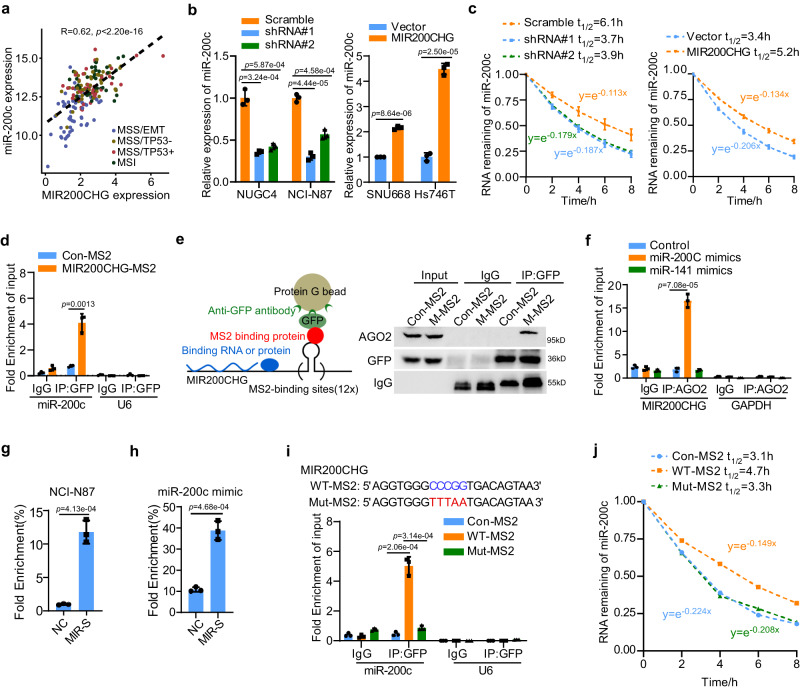
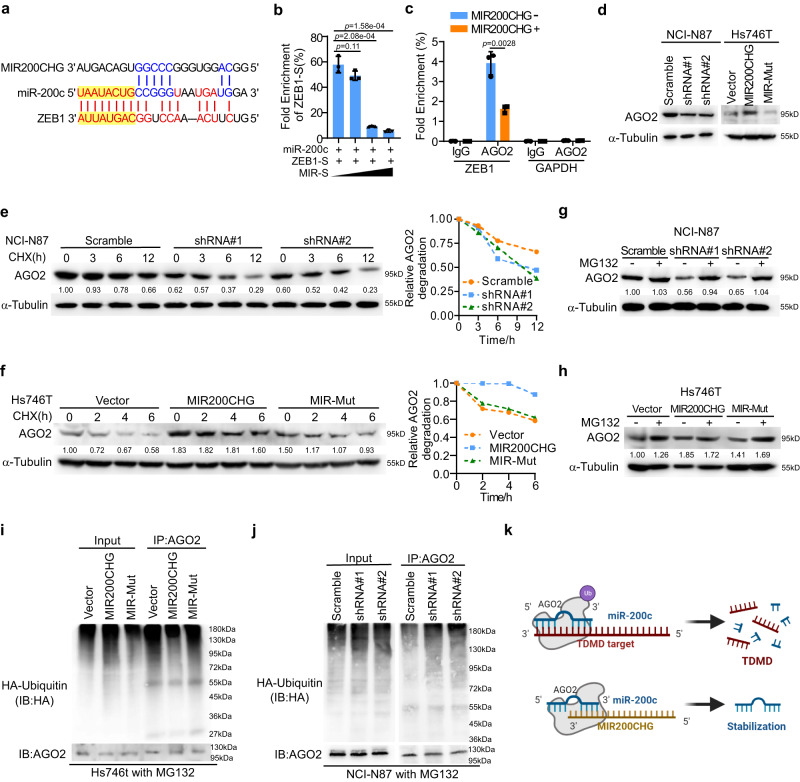
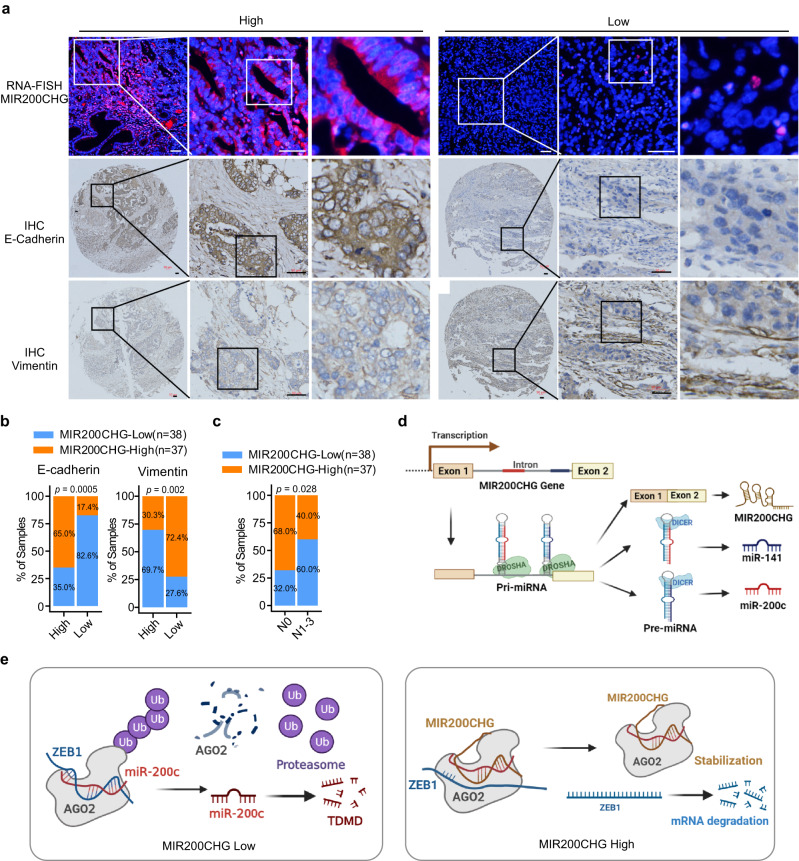
Gastric cancer (GC) is a heterogeneous disease, threatening millions of lives worldwide, yet the functional roles of long non-coding RNAs (lncRNAs) in different GC subtypes remain poorly characterized. Microsatellite stable (MSS)/epithelial-mesenchymal transition (EMT) GC is the most aggressive subtype associated with a poor prognosis. Here, we apply integrated network analysis to uncover lncRNA heterogeneity between GC subtypes, and identify MIR200CHG as a master regulator mediating EMT specifically in MSS/EMT GC. The expression of MIR200CHG is silenced in MSS/EMT GC by promoter hypermethylation, associated with poor prognosis. MIR200CHG reverses the mesenchymal identity of GC cells in vitro and inhibits metastasis in vivo. Mechanistically, MIR200CHG not only facilitates the biogenesis of its intronic miRNAs miR-200c and miR-141, but also protects miR-200c from target-directed miRNA degradation (TDMD) through direct binding to miR-200c. Our studies reveal a landscape of a subtype-specific lncRNA regulatory network, providing clinically relevant biological insights towards MSS/EMT GC.


Conflict of interest statement

The authors declare no competing interests.

Figures

Fig. 1
Fig. 1. Integrated network inference identified master regulatory lncRNAs of EMT specifically in the MSS/EMT subtype of GC.
a The heat map displays the expression profile of the differentially expressed lncRNAs in all four GC subtypes in the TCGA cohort (n = 54 samples for MSS/EMT, n = 43 samples for MSS/TP53-, n = 44 samples for MSS/TP53+, n = 38 samples for MSI). b The volcano plot of top differentially expressed mRNAs between the MSS/EMT subtype and the non-MSS/EMT subtypes in the TCGA cohort (n = 179 samples). c The volcano plot of top differentially expressed lncRNAs between the MSS/EMT subtype and the non-MSS/EMT subtypes in the TCGA cohort (n = 179 samples). d The lncRNA regulatory network inferred from an integrative analysis of mRNA and lncRNA expression profiles in the TCGA cohort. MIR200CHG, AC104083.1, and LINC00578 appeared as the most influential master regulatory lncRNAs for EMT signature genes in GC. mRNAs and lncRNAs were colored according to the log2 fold change between the MSS/EMT subtype and the non-MSS/EMT subtypes of GC (orange: upregulation of mRNA expression; blue: downregulation of mRNA expression; purple: upregulation of lncRNA expression; green: downregulation of lncRNA expression). The edges between nodes were colored in red (induction) or blue (repression) based on the predicted regulatory relationship. EMT signature genes were denoted as triangles. e Statistical significance of the overrepresentation of a lncRNA’s regulon for EMT signature genes vs. the proportion of EMT signature genes regulated by a lncRNA. LncRNAs with significant enrichment of EMT signature genes in the regulons were highlighted in red color. P-values were determined by moderated two-sided t-tests (b, c) and hypergeometric tests (e). P-values were adjusted for multiple testing (b, c, e).
Fig. 2
Fig. 2. Clinical associations of the master regulatory lncRNAs.
Boxplots show significant differential expression of MIR200CHG (a), AC104083.1 (b), and LINC00578 (c) between the MSS/EMT subtype and the non-MSS/EMT subtypes in the TCGA cohort (n = 54 samples for MSS/EMT, n = 43 samples for MSS/TP53-, n = 44 samples for MSS/TP53+, n = 38 samples for MSI). P-values were based on two-sided Wilcoxon rank-sum tests. Boxplots show significant associations between the expression of MIR200CHG (d), AC104083.1 (e), and LINC00578 (f) with tumor (T) stage (n = 8 samples for T1, n = 35 samples for T2, n = 94 samples for T3, n = 41 samples for T4). P-values were based on One-way ANOVA. g The univariate Cox regression analysis of lncRNAs and typical clinical factors in the TCGA cohort (n = 177 samples, Wald tests, **(MIR200CHG) P = 0.0031, ***(Stage) P = 0.00036, ***(M stage) P = 0.00012). h Patients with lower MIR200CHG expression had significantly worse overall survival (n = 177 samples, log-rank test). Boxes in all box-plots extend from the 25th to the 75th percentile and the lines indicate the median. The whiskers are drawn to the 5th and the 95th percentile.
Fig. 3
Fig. 3. Validation of MIR200CHG differential expression and its upstream regulatory mechanism.
MIR200CHG expression was significantly lower in the MSS/EMT subtype of GC in the ACRG cohort (a, n = 46 samples for MSS/EMT, n = 107 samples for MSS/TP53-, n = 79 samples for MSS/TP53 + , n = 68 samples for MSI), the GSE15459 cohort (b, n = 83 samples for MSS/EMT, n = 61 samples for MSS/TP53-, n = 37 samples for MSS/TP53 + , n = 11 samples for MSI), and the CCLE GC cell lines (c, n = 6 cell lines for MSS/EMT, n = 18 cell lines for MSS/TP53-, n = 5 cell lines for MSS/TP53+, n = 8 cell lines for MSI). P-values were based on two-sided Wilcoxon rank-sum tests. d Real-time PCR analysis of MIR200CHG expression and western blots show the differential expression of E-cadherin and vimentin in the MSS/EMT and non-MSS/EMT subtypes of GC cell lines. e The scatter plot shows the inverse correlation between MIR200CHG promoter methylation and MIR200CHG expression in different GC subtypes in the TCGA cohort (n = 49 samples for E, n = 40 samples for N, n = 40 samples for P, n = 31 samples for I). E: MSS/EMT, N: MSS/TP53-, P: MSS/TP53+, I: MSI. PCC: Pearson’s correlation coefficient. P-value was based on two-sided Pearson’s correlation test. f 5-Aza (0.5 μM) treatment of the SNU668 and Hs746T cell lines revealed that a reduction in MIR200CHG promoter methylation resulted in MIR200CHG re-expression. g Wound healing analysis of SNU668 and Hs746T cells treated with 5-AZA or DMSO. Scale bar, 200 μm. h Transwell chamber analysis of Hs746T and SNU668 cells treated with 5-AZA or DMSO. Scale bar, 50 μm. i Receiver operating characteristic (ROC) curves illustrate the performance to employ MIR200CHG promoter methylation or expression to predict the MSS/EMT subtype in the TCGA, ACRG, and GSE15459 cohorts. j Stacked bars show the proportion of MIR200CHG localized in the cytoplasm and nuclear of NCI-N87 cells. GAPDH served as the cytoplasmic internal control. U6 served as the nuclear internal control. Boxes in all box-plots extend from the 25th to the 75th percentile and the lines indicate the median. The whiskers are drawn to the 5th and the 95th percentile. Each bar in bar plots represents the mean ± standard deviation of three biologically independent samples (d, f, j) and five biologically independent samples (g, h). P-values were determined by two-sided Student’s t-tests (fh). Source data are provided as a Source Data file.
Fig. 4
Fig. 4. Enforced MIR200CHG expression reversed the mesenchymal identity of GC cells in vitro and inhibited lymph node metastasis in vivo.
a Transwell chamber analysis of Hs746T and SNU668 cells. Each bar represents the mean ± standard deviation of five biologically independent samples. Scale bar, 50 μm. b Wound healing analysis of Hs746T and SNU668 cells for 72 h. Each bar represents the mean ± standard deviation of three biologically independent samples. Scale bar, 200 μm. c Immunofluorescence staining of ZO-1, Vimentin, Fibronectin, and F-actin in the indicated cells. Nuclei were counterstained with DAPI. Scale bar, 20 μm. d Expression of EMT relevant markers as determined by RT-qPCR. Each bar represents the mean ± standard deviation of three biologically independent samples. e The protein expression of ZO-1, Vimentin, Fibronectin, and ZEB1 in the indicated cells, as assessed by western blotting. f Representative images of the mouse inguinal lymphatic metastasis models established with Hs746T vector-expressing and MIR200CHG-overexpressing cell lines (n = 8 mice). g Percentages of lymph node metastasis status (left) and lymph node size (right) in all groups. Each bar represents the mean ± standard deviation of eight biologically independent samples. h Haematoxylin and eosin staining and immunocytochemical analysis of panCK, E-cadherin, and Vimentin in the lymph node metastatic tumor. Scale bar, 100 μm. The experiments were repeated three times independently with similar results (c, e, h). P-values were determined by two-sided Student’s t-tests (a, b, d, g). Source data are provided as a Source Data file.
Fig. 5
Fig. 5. MIR200CHG inhibition induced the EMT identity of GC cells in vitro and promoted metastasis in vivo.
a The transwell chamber analysis of NUGC4 and NCI-N87 cells. Each bar represents the mean ± standard deviation of five biologically independent samples. Scale bar, 50 μm. b Wound healing analysis of NUGC4 and NCI-N87 cells for 72 h. Each bar represents the mean ± standard deviation of three biologically independent samples. c Immunofluorescence of ZO-1, E-cadherin, Vimentin, and F-actin in NUGC4 and NCI-N87 cells. Nuclei were counterstained with DAPI. Scale bar, 20 μm. d Representative images of the mouse inguinal lymphatic metastasis models established with NCI-N87 Scramble and MIR200CHG-knockdown cell lines (n = 6 mice). e Percentages of lymph node metastasis status (left) and lymph node size (right) in all groups. Each bar represents the mean ± standard deviation of six biologically independent samples. f Haematoxylin and eosin staining and immunocytochemical analysis of panCK, E-cadherin, and vimentin in the lymph node metastatic tumor. Scale bar, 100 μm. g Representative images of the mouse primary gastric tumor and peritoneal metastasis established with NCI-N87 Scramble and MIR200CHG-knockdown cell lines. h The number of peritoneal metastasis nodules of NSG mice. Each bar represents the mean ± standard deviation of six biologically independent samples. i Body weight of NSG mice. j The survival of NSG mice with NCI-N87 Scramble and MIR200CHG-knockdown tumors (n = 10). The experiments were repeated three times independently with similar results (c, f). P-values were determined by two-sided Student’s t-tests (a, b, e, h) and a log-rank test (j). Source data are provided as a Source Data file.
Fig. 6
Fig. 6. MIR200CHG protects miR-200c from TDMD by binding to miR-200c-bound AGO2.
a The scatter plot shows a positive correlation between MIR200CHG expression and miR-200c expression in the TCGA cohort (n = 54 samples for MSS/EMT, n = 43 samples for MSS/TP53-, n = 44 samples for MSS/TP53+, n = 38 samples for MSI). P-value was based on a two-sided Pearson’s correlation test. b miR-200c expression in MIR200CHG-knockdown (left) and MIR200CHG-overexpressing cell lines (right) was determined by RT-qPCR. c The reduced half-life of miR-200c by silencing MIR200CHG (left) and extended half-life of miR-200c by overexpressing MIR200CHG (right). Cells were treated with 5 µmol/L actinomycin D. d MS2 RIP and RT-qPCR analyses show the interaction of MIR200CHG with miR-200c in HEK293T cells. e The schematic diagram (left) and western blot (right) of MS2 RIP assay. The experiment was repeated three times independently with similar results. f The AGO2 RIP assay showed that both MIR200CHG and miR-200c were bound to AGO2. g The RNA-pull down and RT-qPCR showing the association of miR-200c with MIR200CHG in NCI-N87 cells. h The RNA-RNA pull down and RT-qPCR showing the direct binding of MIR200CHG and miR-200c. i The corresponding mutant form (Mut-MS2) with the predicted miR-200c binding site mutated is shown (top). HEK293T cells were transfected with negative control (Con-MS2), vectors containing wild-type (WT-MS2) or mutated MIR200CHG (Mut-MS2) followed by MS2-RIP assay. RT-qPCR analysis showed the interaction of MIR200CHG with miR-200c in HEK293T cells transfected with Con-MS2, WT-MS2 or mutated Mut-MS2. j The RT-qPCR analysis showed the extending miR-200c half-life by overexpressing wild-type MIR200CHG but not mutant MIR200CHG. Each bar in bar plots represents the mean ± standard deviation of three biologically independent samples (b, d, fi). P-values were determined by two-sided Student’s t-tests (bd, fi). Source data are provided as a Source Data file.
Fig. 7
Fig. 7. MIR200CHG stabilizes AGO2 from proteasome degradation via competitively binding to the target of miR-200c.
a The sequence match between miR-200c and MIR200CHG or between miR-200c and ZEB1. The seed sequence was highlighted. b Gradient doses of MIR200CHG oligos containing the miR-200c binding site (MIR-S) were incubated with miR-200c mimics, and the biotin-labeled ZEB1 mRNA probes (ZEB1-S) were used for RNA-RNA pulldown. Subsequent RT-qPCR analysis showed the interaction of miR-200c with ZEB1. c MIR200CHG overexpression plasmid was transfected into Hs746T cells. AGO2-RIP assay and RT-qPCR showed that less ZEB1 occupied the same AGO2 protein when MIR200CHG was present. d Western blotting was used to measure the expression of AGO2 in NCI-N87 and Hs746t. e Western blotting was used to measure the expression of AGO2 in NCI-N87 following treatment of 20 ug/ml with CHX after the knockdown of MIR200CHG. f Western blotting was used to measure the expression of AGO2 in Hs746t following treatment of 20ug/ml with CHX after overexpression of wild-type (MIR200CHG) or mutated MIR200CHG (MIR-Mut). g, h Western blotting was used to measure the expression of AGO2 in NCI-N87 and Hs746t that were treated with MG132 after the knockdown or overexpression of wild-type or mutated MIR200CHG. Cells were treated with MG132 (20 μM) for 6 h. i Western blot analysis of ubiquitinated AGO2 immunoprecipitated from Hs746t cells with or without wild-type MIR200CHG or MIR200CHG mutation overexpression. The cells were treated with MG132 to inhibit the proteasome. j Western blot analysis of ubiquitinated AGO2 immunoprecipitated from NCI-N87 cells with or without MIR200CHG knockdown. The cells were treated with MG132 to inhibit the proteasome. k The schematic illustration of the mechanism by which MIR200CHG stabilized miR-200c by inhibiting TDMD (Created with BioRender.com). The experiments were repeated three times independently with similar results (dj). Each bar in bar plots represents the mean ± standard deviation of three biologically independent samples (b, c). P-values were determined by two-sided Student’s t-tests (b, c). Source data are provided as a Source Data file.
Fig. 8
Fig. 8. Expression of MIR200CHG and its clinical associations in GC samples.
a Representative RNA FISH images of MIR200CHG expression and representative immunohistochemistry images of E-cadherin and vimentin in the same GC tissue microarray (n = 75). b The association between MIR200CHG and E-cadherin expression (left) and vimentin expression (right) in GC patients (n = 75). c The associations of MIR200CHG expression with N stage in GC patients (n = 75). d The schematic illustration shows that MIR200CHG, miR-200c, and miR-141 are derived from the same primary transcript (Created with BioRender.com). e The schematic illustration of the mechanism by which MIR200CHG protects miR-200c from TDMD (Created with BioRender.com). P-values were based on two-sided Fisher’s exact tests (b, c). Source data are provided as a Source Data file.

References

    1. Sung H, et al. Global cancer statistics 2020: GLOBOCAN estimates of incidence and mortality worldwide for 36 cancers in 185 countries. CA Cancer J. Clin. 2021;71:209–249. doi: 10.3322/caac.21660. - DOI - PubMed
    1. Ho SWT, Tan P. Dissection of gastric cancer heterogeneity for precision oncology. Cancer Sci. 2019;110:3405–3414. doi: 10.1111/cas.14191. - DOI - PMC - PubMed
    1. Cristescu R, et al. Molecular analysis of gastric cancer identifies subtypes associated with distinct clinical outcomes. Nat. Med. 2015;21:449–456. doi: 10.1038/nm.3850. - DOI - PubMed
    1. Wang Q, Liu G, Hu C. Molecular classification of gastric adenocarcinoma. Gastroenterol. Res. 2019;12:275–282. doi: 10.14740/gr1187. - DOI - PMC - PubMed
    1. Xue S-t, et al. Long non-coding RNA LINC00680 functions as a ceRNA to promote esophageal squamous cell carcinoma progression through the miR-423-5p/PAK6 axis. Mol. Cancer. 2022;21:1–18. doi: 10.1186/s12943-022-01539-3. - DOI - PMC - PubMed

Associated data