

Improvement in the skill of CMIP6 decadal hindcasts for extreme rainfall events over the Indian summer monsoon region
- PMID: 38065984
- PMCID: PMC10709579
- DOI: 10.1038/s41598-023-48268-1
Improvement in the skill of CMIP6 decadal hindcasts for extreme rainfall events over the Indian summer monsoon region
Abstract
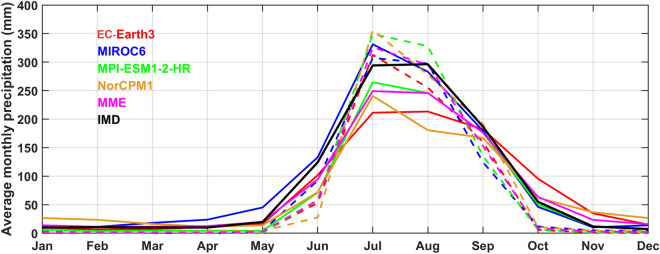
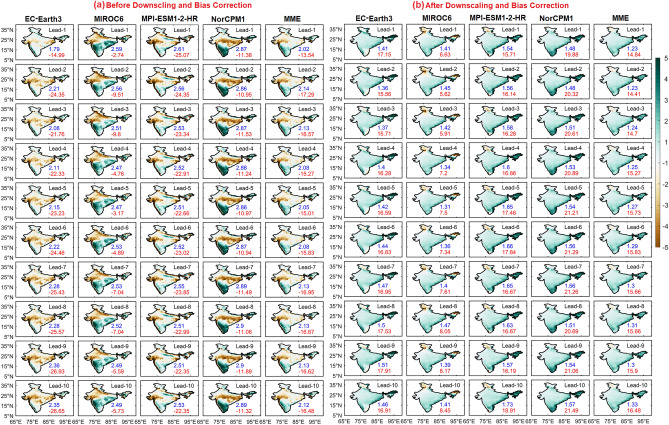
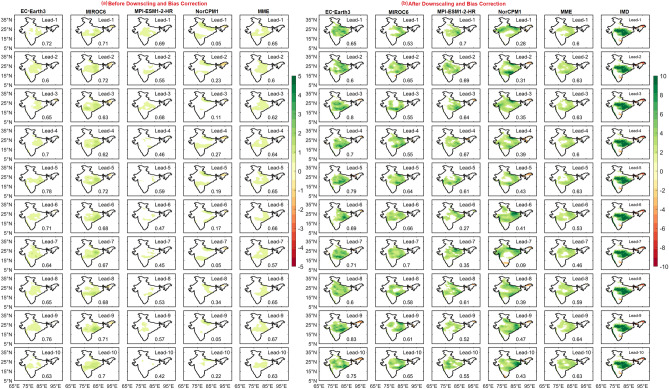
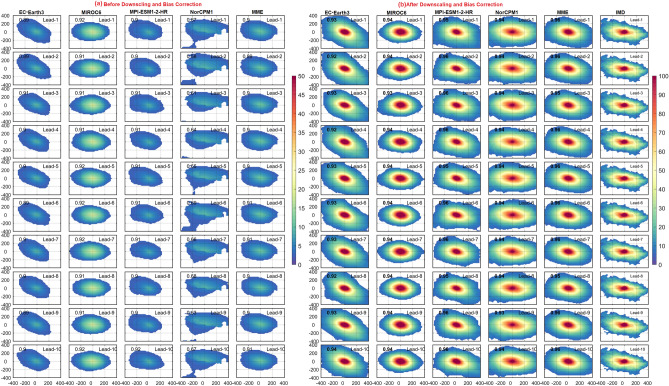
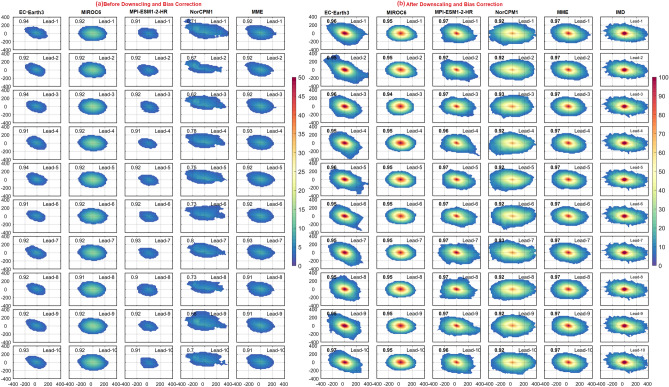
Decadal climate predictions have been widely used to predict the near-term climate information relevant for decision-making at multi-year timescales. In the present study, we evaluate the quality of the Coupled Model Intercomparison Project phase-6 (CMIP6) Decadal Climate Prediction Project (DCPP) hindcasts in capturing the extreme rainfall events (EREs) over the monsoon core region during Indian summer monsoon season (June-September) up to lead years 1-10. For the first time, in this study, we have used quantile mapping approach to downscale and bias correct the DCPP CMIP6 simulation/hindcast rainfall for the better representation of EREs. Detailed analysis suggests that the models in general strongly underestimate the rainfall variability over the summer monsoon region. However, after the downscaling and bias correction, the representation of rainfall variability and intensity improved multifold. The bias-corrected decadal hindcasts in fact show ~ 80% improvement in capturing the frequency, intensity, and spatial distribution of rainfall associated with the EREs. Present study brought out a downscaled DCPP product, with potential prediction skill for EREs over India. It is important to highlight that the models predict an increase in the small and medium-area EREs as compared to the large-area EREs over the monsoon core region for the decade 2019-2028.
© 2023. The Author(s).
Conflict of interest statement
The authors declare no competing interests.
Figures


Similar articles
-
Temporal and spatial aggregation of rainfall extremes over India under anthropogenic warming.Sci Rep. 2024 May 31;14(1):12538. doi: 10.1038/s41598-024-63417-w. Sci Rep. 2024. PMID: 38822065 Free PMC article.
-
Changes in physical characteristics of extreme rainfall events during the Indian summer monsoon based on downscaled and bias-corrected CMIP6 models.Sci Rep. 2025 Jan 29;15(1):3679. doi: 10.1038/s41598-025-87949-x. Sci Rep. 2025. PMID: 39880898 Free PMC article.
-
Indian Summer Monsoon Rainfall: Implications of Contrasting Trends in the Spatial Variability of Means and Extremes.PLoS One. 2016 Jul 27;11(7):e0158670. doi: 10.1371/journal.pone.0158670. eCollection 2016. PLoS One. 2016. PMID: 27463092 Free PMC article.
-
A meta-analysis of the regional extreme rainfall events in the Indian sub-continent during the southwest monsoon period.Sci Total Environ. 2025 May 15;977:179339. doi: 10.1016/j.scitotenv.2025.179339. Epub 2025 Apr 15. Sci Total Environ. 2025. PMID: 40239497 Review.
-
Recent Advances in Understanding Multi-scale Climate Variability of the Asian Monsoon.Adv Atmos Sci. 2023 May 20:1-28. doi: 10.1007/s00376-023-2266-8. Online ahead of print. Adv Atmos Sci. 2023. PMID: 37359908 Free PMC article. Review.
Cited by
-
Temporal and spatial aggregation of rainfall extremes over India under anthropogenic warming.Sci Rep. 2024 May 31;14(1):12538. doi: 10.1038/s41598-024-63417-w. Sci Rep. 2024. PMID: 38822065 Free PMC article.
References
-
- Gadgil S. The Indian monsoon and its variability. Annu. Rev. Earth Planet. Sci. 2003;31(1):429–467. doi: 10.1146/annurev.earth.31.100901.141251. - DOI
-
- Sikka DR. Some aspects of the large scale fluctuations of summer monsoon rainfall over India in relation to fluctuations in the planetary and regional scale circulation parameters. Proc. Indian Acad. Sci.-Earth Planet. Sci. 1980;89:179–195. doi: 10.1007/BF02913749. - DOI
-
- Ajayamohan RS, Merryfield WJ, Kharin VV. Increasing trend of synoptic activity and its relationship with extreme rain events over central India. J. Clim. 2010;23(4):1004–1013. doi: 10.1175/2009JCLI2918.1. - DOI
-
- Sharma A, Goyal MK. District-level assessment of the ecohydrological resilience to hydroclimatic disturbances and its controlling factors in India. J. Hydrol. 2018;564:1048–1057. doi: 10.1016/j.jhydrol.2018.07.079. - DOI
Grants and funding
LinkOut - more resources
Full Text Sources
