. 2023 Dec 8;13(1):21772.
doi: 10.1038/s41598-023-48721-1.

Reproducible and clinically translatable deep neural networks for cervical screening

Affiliations

Reproducible and clinically translatable deep neural networks for cervical screening

Syed Rakin Ahmed et al. Sci Rep. .

Abstract

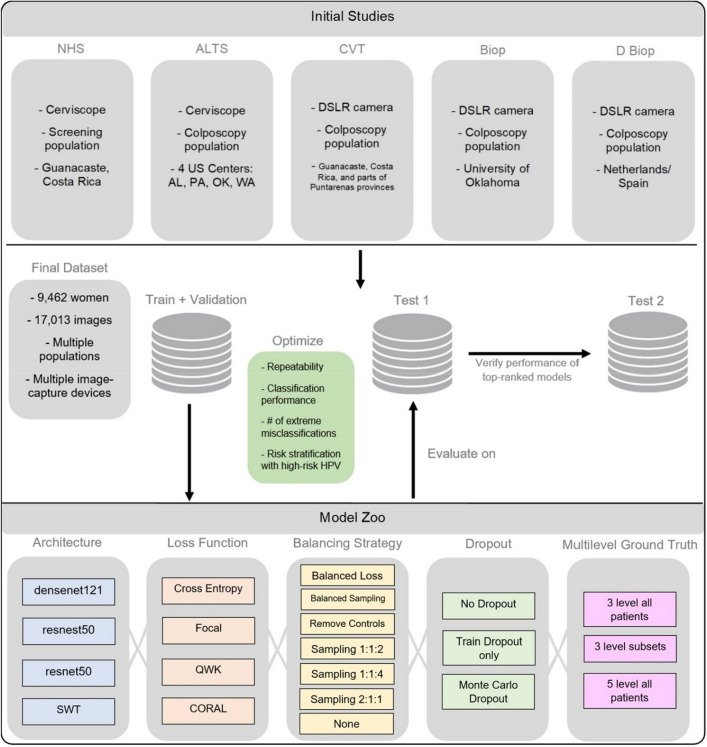
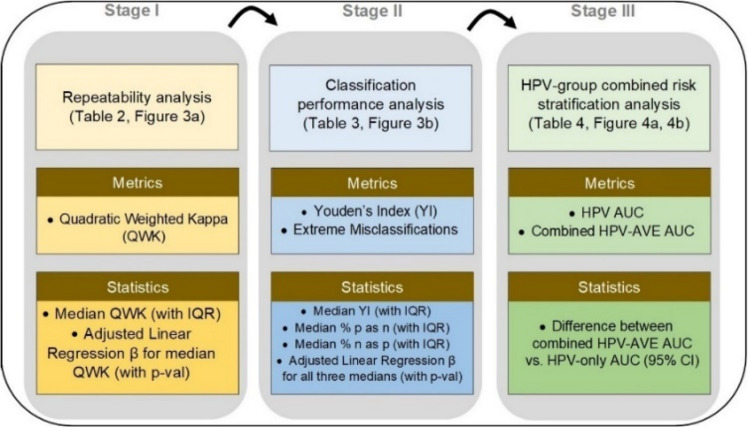
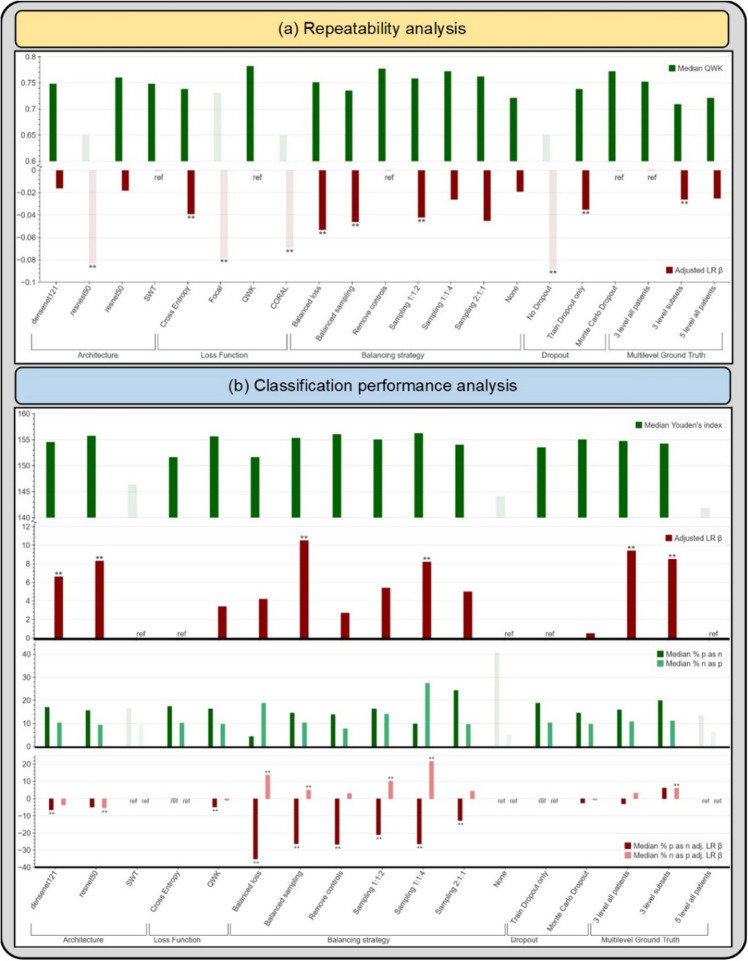
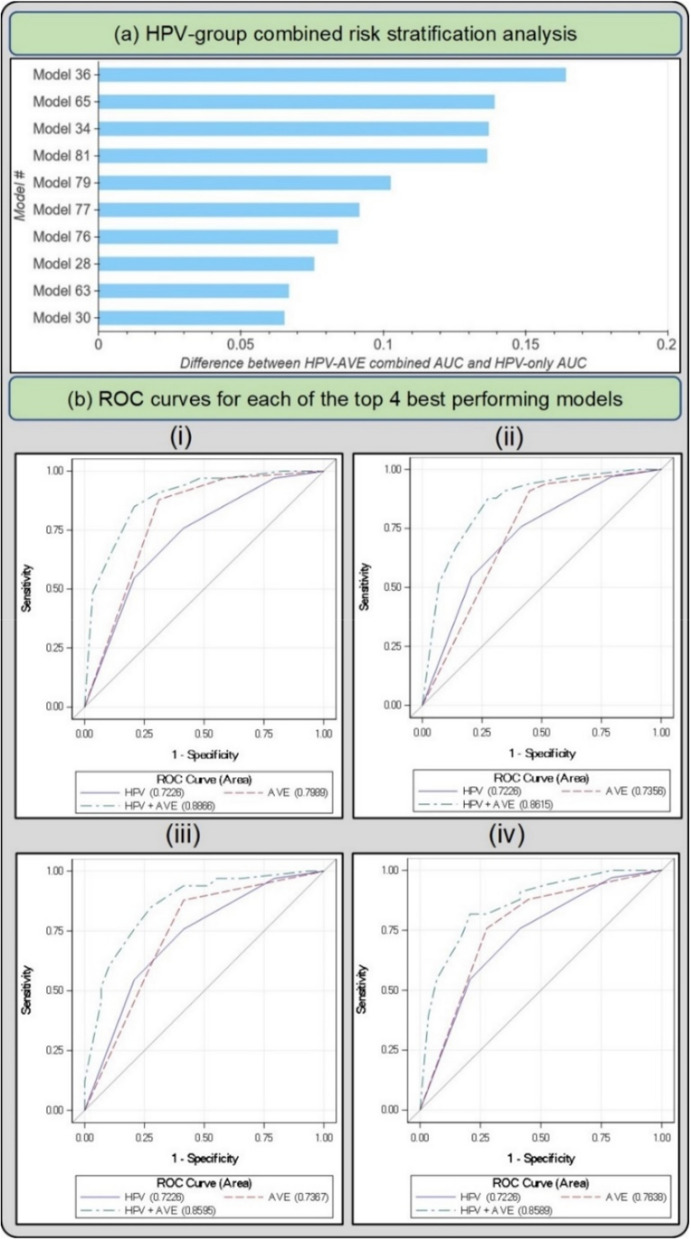
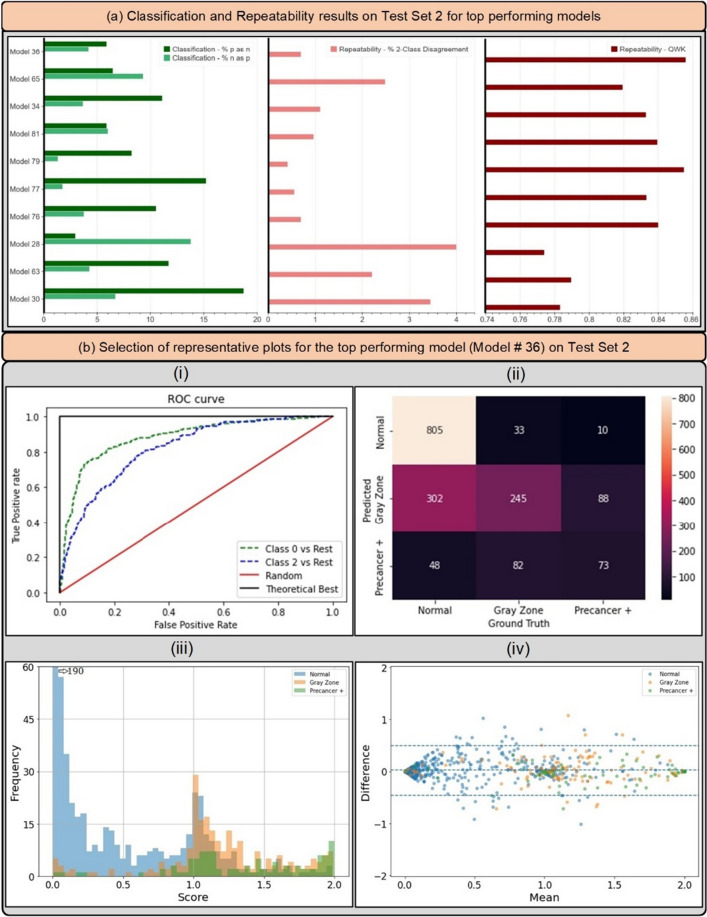
Cervical cancer is a leading cause of cancer mortality, with approximately 90% of the 250,000 deaths per year occurring in low- and middle-income countries (LMIC). Secondary prevention with cervical screening involves detecting and treating precursor lesions; however, scaling screening efforts in LMIC has been hampered by infrastructure and cost constraints. Recent work has supported the development of an artificial intelligence (AI) pipeline on digital images of the cervix to achieve an accurate and reliable diagnosis of treatable precancerous lesions. In particular, WHO guidelines emphasize visual triage of women testing positive for human papillomavirus (HPV) as the primary screen, and AI could assist in this triage task. In this work, we implemented a comprehensive deep-learning model selection and optimization study on a large, collated, multi-geography, multi-institution, and multi-device dataset of 9462 women (17,013 images). We evaluated relative portability, repeatability, and classification performance. The top performing model, when combined with HPV type, achieved an area under the Receiver Operating Characteristics (ROC) curve (AUC) of 0.89 within our study population of interest, and a limited total extreme misclassification rate of 3.4%, on held-aside test sets. Our model also produced reliable and consistent predictions, achieving a strong quadratic weighted kappa (QWK) of 0.86 and a minimal %2-class disagreement (% 2-Cl. D.) of 0.69%, between image pairs across women. Our work is among the first efforts at designing a robust, repeatable, accurate and clinically translatable deep-learning model for cervical screening.


Conflict of interest statement

The authors declare no competing interests.

Figures

Figure 1
Figure 1
Model selection and optimization overview. The top panel highlights the five different studies (NHS, ALTS, CVT, Biop and D Biop; see Table 1, Supp. Table 1, and Supp. Methods for detailed description and breakdown of the studies by ground truth) used to generate the final dataset on the middle panel, which is subsequently used to generate a train and validation set, as well as two separate test sets. The intersections of model selection choices on the bottom panel are used to generate a compendium of models trained using the corresponding train and validation sets and evaluated on the “Model Selection Set”/“Test Set 1”, optimizing for repeatability, classification performance, reduced extreme misclassifications and combined risk-stratification with high-risk human papillomavirus (HPV) types. “Test Set 2” is utilized to verify the performance of top candidates that emerge from evaluation on the “Model Selection Set”/“Test Set 1”. SWT: Swin Transformer; QWK: quadratic weighted kappa; CORAL: CORAL (consistent rank logits) loss, as described in the “Methods” section.
Figure 2
Figure 2
Model selection approach and statistical analysis utilized in our automated visual evaluation (AVE) classifier. IQR: interquartile range; AUC: area under the receiver operating characteristics (ROC) curve; CI: confidence interval.
Figure 3
Figure 3
(a) Median quadratic weighted kappa (QWK) and adjusted linear regression (LR) β across the various design choices, as part of the repeatability analysis. (b) Median Youden’s index, median % precancer+ as normal (% p as n) and median % normal as precancer+ (% n as p), with the corresponding adjusted LR β values across the various design choices (after filtering for repeatability), as part of the classification performance analysis. Muted bars indicate design choices dropped at each stage. All results are from the “Model Selection Set”/“Test Set 1”. SWT: Swin Transformer; CORAL: CORAL (consistent rank logits) loss, as described in the “Methods” section; ref: reference category.
Figure 4
Figure 4
(a) Difference between HPV+ AVE combined AUC and HPV-only AUC in the HPV positive NHS subset for top 10 models on the “Model Selection Set”/“Test Set 1” (b) Receiver operating characteristics (ROC) curves for each of the top 4 best performing models in the HPV positive NHS subset of the full dataset The plotted lines indicate (1) HPV AUC, (2) AVE AUC and (3) combined HPV-AVE AUC, for models (i) 36, (ii) 65, (iii) 34, and (iv) 81. HPV: human papillomavirus; AVE: automated visual evaluation, which refers to the classifier; AUC: area under the ROC curve.
Figure 5
Figure 5
(a) Classification and repeatability results on “Test Set 2” for top 10 best performing models, highlighting the % precancer+ as normal (%p as n) and % normal as precancer+ (%n as p) (left), the % 2-class disagreement between image pairs across women (middle), and the quadratic weighted kappa (QWK) values on the discrete class outcomes for paired images across women (right) for each model. (b) Representative plots for the top performing model (# 36) on Test Set 2—(i) Receiver operating characteristics (ROC) curves for the normal vs rest (Class 0 vs. rest) and precancer+ vs. rest (Class 2 vs. rest) cases, (ii) confusion matrix, (iii) histogram of model predicted continuous score, color coded by ground truth, and (iv) Bland Altman plot of model predictions, color coded by ground truth: each point on this plot refers to a single woman, with the y-axis representing the maximum difference in the score across repeat images per woman, and the x-axis plotting the mean of the corresponding score across all repeat images per woman.
Figure 6
Figure 6
Model level comparison across top-10 best performing models on “Test Set 2”. 60 images were randomly selected from “Test Set 2” (see “Methods”: “Statistical analysis” section) and arranged in order of increasing mean score within each ground truth class in the top row (labelled “Ground Truth”). The model predicted class for the top 10 models for each of these 60 images is highlighted in the bottom rows, where the images follow the same order as the top row. The color coding in the top row represents ground truth while in the bottom 10 rows represent the model predicted class. Green: Normal, Gray: Gray Zone, and Red: Precancer+, as highlighted in the legend. Each image corresponds to a different woman.
Figure 7
Figure 7
Preliminary experiments investigating various values for the αt and γ parameters in the focal loss equation, highlighting the rationale behind optimized values of αt=0.25 and γ=2, which were also reported as optimized values in Lin et al. Here, we iterated across αt=0.25,1,andinverseclassfrequency ("weights") and γ=1.5,2,3and4. Both (a) and (b) illustrate Bland–Altman plots (top panel) and continuous score histograms (bottom panel), highlighting both repeatability and relative class discrimination across the various parameter choices. In (a), γ is held constant, and αt (0.25, inverse class frequency) and the method of reduction (mean, sum) are iterated. In (b), αt and the method of reduction are held constant, while γ (1.5, 2, 3, 4) is iterated. Overall, the results indicate that increasing γ leads to improved repeatability (as indicated by the narrower 95% limit of agreement (LoA) on the Bland Altman plot) but slightly poorer class discrimination (as indicated by the narrower score range in both the Bland Altman plot and the histogram); changing αt and/or the method of reduction has relatively less effect on repeatability and class discrimination. The best overall balance between the two is achieved with αt=0.25 and γ=2, consistent with Lin et al..
Figure 8
Figure 8
Histograms highlighting the distribution of standard deviations of the model continuous score (top) and model predicted class (bottom) at the image level across 20 runs, for each of two representative models, where (a) model # 36 and (b) model # 77. For both models (a) and (b), model predictions are derived from “Model Selection Set”/“Test Set 1” (left) and “Test Set 2” (right) respectively. These results indicate that model predictions are consistent across repeat runs, within each model configuration and test set; this is highlighted by the large density of standard deviations of the model predicted class at the image level near 0 (meaning that for a given model configuration, the predicted class of an image remains relatively constant across repeat runs) and the small maximum standard deviation around 0.08 – 0.1 (meaning that the model predicted continuous score of an image also changes minimally across repeat runs, and certainly not enough to propagate to a resulting change in predicted class).

Update of

References

    1. Piccialli F, Somma VD, Giampaolo F, Cuomo S, Fortino G. A survey on deep learning in medicine: Why, how and when? Inf. Fusion. 2021;66:111–137. doi: 10.1016/j.inffus.2020.09.006. - DOI
    1. Sperr, E. PubMed by Year. https://esperr.github.io/pubmed-by-year/?q1=%22deep learning%22 or %22neural network%22&startyear=1970.
    1. Esteva A, et al. Dermatologist-level classification of skin cancer with deep neural networks. Nature. 2017;542(7639):115–118. doi: 10.1038/nature21056. - DOI - PMC - PubMed
    1. Hannun AY, et al. Cardiologist-level arrhythmia detection and classification in ambulatory electrocardiograms using a deep neural network. Nat. Med. 2019;25(1):65–69. doi: 10.1038/s41591-018-0268-3. - DOI - PMC - PubMed
    1. Topol EJ. High-performance medicine: The convergence of human and artificial intelligence. Nat. Med. 2019;25(1):44–56. doi: 10.1038/s41591-018-0300-7. - DOI - PubMed