. 2023 Dec 8;7(1):131.
doi: 10.1038/s41698-023-00479-5.

Multimodal classification of molecular subtypes in pediatric acute lymphoblastic leukemia

Affiliations

Multimodal classification of molecular subtypes in pediatric acute lymphoblastic leukemia

Olga Krali et al. NPJ Precis Oncol. .

Abstract

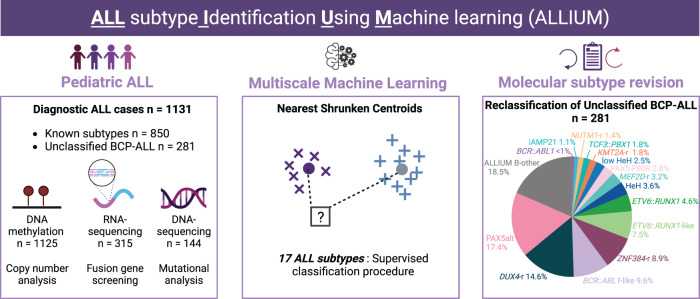
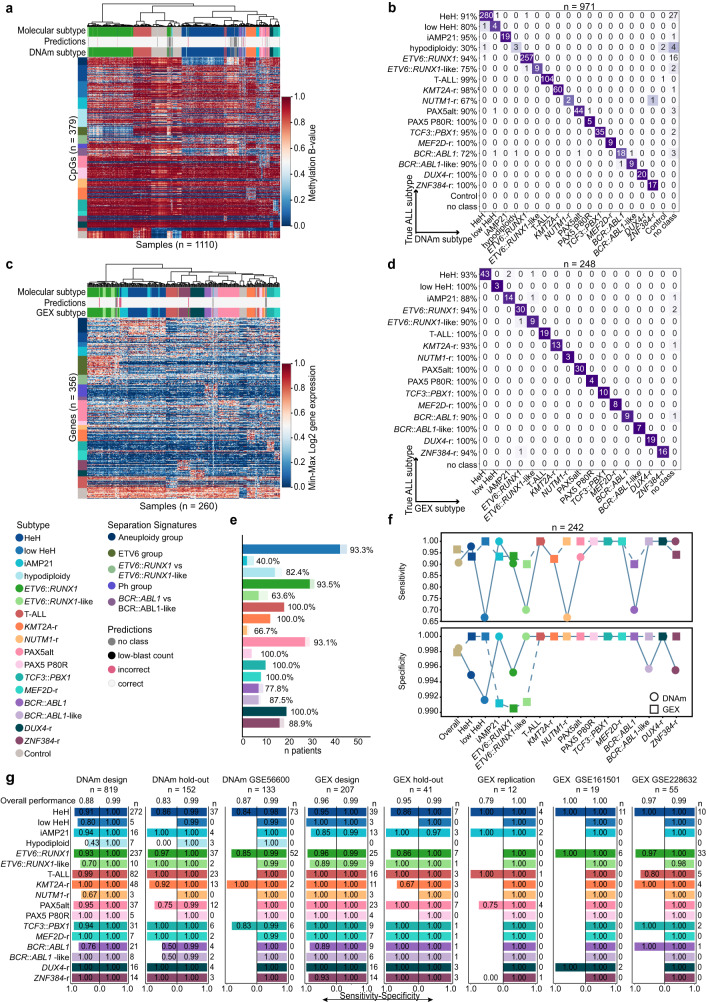
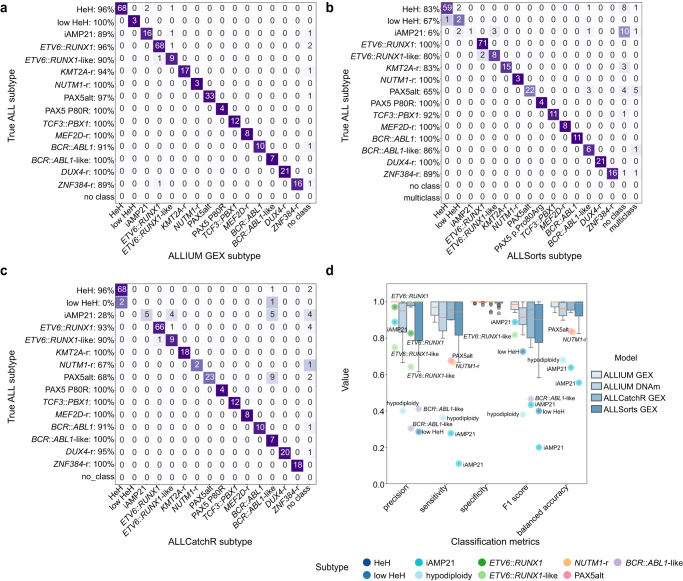
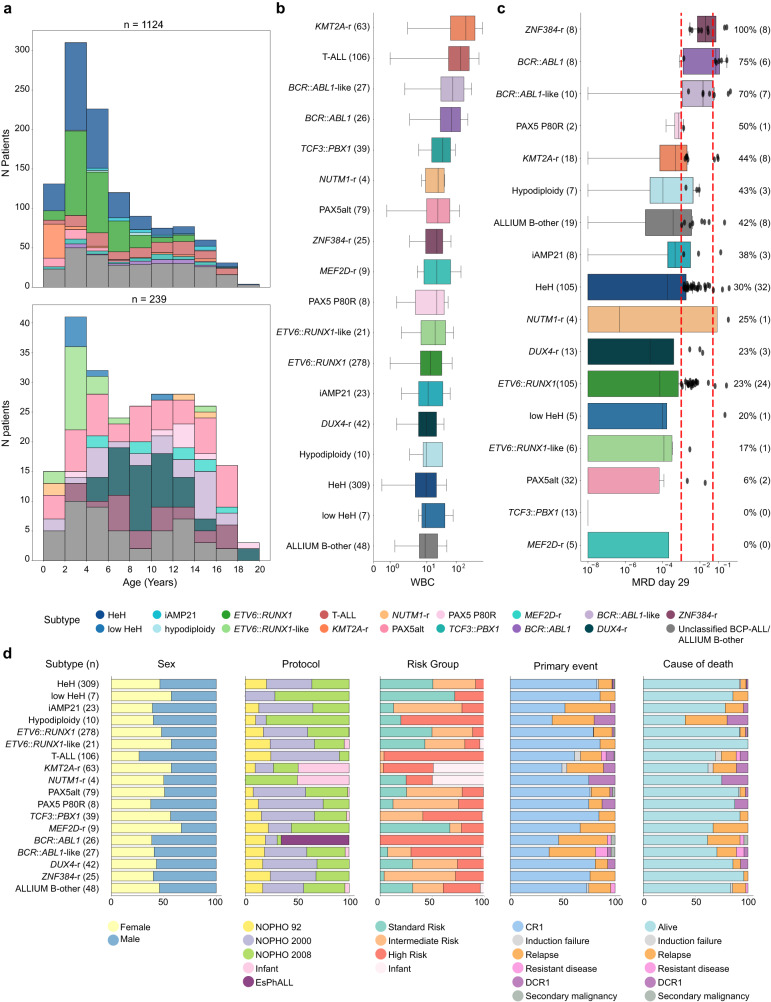
Genomic analyses have redefined the molecular subgrouping of pediatric acute lymphoblastic leukemia (ALL). Molecular subgroups guide risk-stratification and targeted therapies, but outcomes of recently identified subtypes are often unclear, owing to limited cases with comprehensive profiling and cross-protocol studies. We developed a machine learning tool (ALLIUM) for the molecular subclassification of ALL in retrospective cohorts as well as for up-front diagnostics. ALLIUM uses DNA methylation and gene expression data from 1131 Nordic ALL patients to predict 17 ALL subtypes with high accuracy. ALLIUM was used to revise and verify the molecular subtype of 281 B-cell precursor ALL (BCP-ALL) cases with previously undefined molecular phenotype, resulting in a single revised subtype for 81.5% of these cases. Our study shows the power of combining DNA methylation and gene expression data for resolving ALL subtypes and provides a comprehensive population-based retrospective cohort study of molecular subtype frequencies in the Nordic countries.


Conflict of interest statement

The authors declare no competing interests.

Figures

Fig. 1
Fig. 1. Study overview.
DNA methylation (DNAm, 450k arrays), gene expression (GEX, RNA-sequencing), and somatic mutation (WGS, targeted sequencing) data were generated from 1131 patients treated on the Nordic Society for Pediatric Hematology and Oncology (NOPHO) protocols diagnosed between 1996 and 2013. In total, the subtype of 281 of the BCP-ALL patients (24.8% of the entire ALL cohort) was unclassified at diagnosis. Molecular screening was performed based on a combination of cytogenetics, fusion gene screening, mutational analysis, and copy number analysis. Molecular screening resolved the subtype of 127 BCP-ALL patients. The remaining 154 patients were denoted “B-other”. A supervised classification method (ALLIUM) was used to build subtype-specific models based on two modalities (DNAm and GEX) for 17 of the known molecular subtypes of ALL. ALLIUM re-classified the subtype of 102 B-other patients. This study expanded the scope of known subtypes across the entire cohort resulting in 1079 with known subtype (95.4% of the entire ALL cohort). The 52 patients remaining unclassified at the end of the study are referred to as ALLIUM B-other.
Fig. 2
Fig. 2. Evaluation of model performance.
a Unsupervised hierarchical clustering based on the DNA methylation (DNAm) β-values of 379 CpG sites across molecularly defined patients (n = 971) and control samples (n = 139). The heatmap shows the DNA methylation β-value for each CpG (y-axis) and sample (x-axis). The color key is indicated to the right of the panel. b Confusion matrix showing the concordance between ALLIUM DNAm subtype predictions (x-axis) and true molecular subtypes (y-axis) for 971 patients. The numbers indicate the number of patients by subtype. c Unsupervised hierarchical clustering based on gene expression (GEX) levels of 356 genes across molecularly defined patients (n = 248) and control samples (n = 12). The heatmap shows the min-max scaled log2 gene expression levels of the 356 genes (y-axis) by sample (x-axis). The color key for the heatmap is indicated in the right side of the panel. d Concordance between ALLIUM GEX subtype predictions (x-axis) and true molecular subtypes (y-axis) for 248 patients analyzed with ALLIUM GEX. e Barplots showing the degree of concordance between ALLIUM DNAm and GEX predictions for 242 samples with data from both modalities. The subtype is indicated along the y-axis and the number of patients along the x-axis. The light bars represent the overall number of predictions per subtype and the darker bars indicate the number predictions concordant between DNAm and GEX. Patients with “no class” predictions (n = 9) are not shown. f Line plots demonstrating the sensitivity (top) and specificity (bottom) of ALLIUM DNAm (circle) and GEX (square) models overall and by subtype for the 242 patients analyzed with both data modalities. g Bi-directional barplots showing the sensitivity and specificity by subtype for the design, hold-out, replication, DNAm GSE56600, GEX GSE161501 and GEX GSE228632 datasets. The sensitivity is indicated by the left-sided bar, while the specificity is indicated by the right-sided bar for each dataset and subtype. The overall performance is shown on the top of each barplot. The number of patients in each dataset by subtype is indicated to the right of each barplot.
Fig. 3
Fig. 3. Subtype-specific signatures determined by ALLIUM.
Cross-decomposition analysis with Partial Least Squares (PLS) Canonical analysis. The UMAP plots indicate components 1 and 2 for a the DNAm (n = 167,353) vs the GEX (n = 19,774) unselected signatures, and b the ALLIUM DNAm (n = 379) and GEX (n = 356) signatures (right). The points indicate the training (67%, blue) and test sets (33%, red). The Pearson’s correlation coefficient for the comparing modalities per component is denoted in the title of each plot. Boxplots demonstrating the c GEX levels for four selected genes across 315 patients grouped by revised molecular subtype. d DNAm levels for four selected CpG sites across 1125 patients by revised molecular subtype. The boxes are color-coded by respective subtype according to the key at the bottom of the panel. The Benjamini-Hochberg (BH) corrected Kruskal-Wallis H-test p value indicates the statistical significance between subtypes (bottom right). Asterisks indicate the subtype(s) for which ALLIUM chose each specific CpG or GEX signature. The lines (whiskers) on the boxplots represent the distribution of residual data points beyond the lower and upper quartiles.
Fig. 4
Fig. 4. Performance of ALLIUM, ALLSorts and ALLCatchR.
a Concordance between ALLIUM GEX subtype predictions (x-axis) and true molecular subtypes (y-axis) for 309 BCP-ALL samples of known subtype (95.5%, 295/309). b Concordance between ALLSorts subtype predictions (x-axis) and true molecular subtype (y-axis) (83.5%, 258/309). c Concordance between ALLCatchR subtype predictions (x-axis) and true molecular subtype (y-axis) (87.4%, 270/309). ALLCatchR was not trained on low HeH. d Boxplots demonstrating classification performance, including precision, sensitivity, specificity, F1 score and accuracy (balanced) for the three GEX models (n = 309 samples) and ALLIUM DNAm (n = 1104 samples with known subtype). The lines (whiskers) on the boxplots represent the distribution of residual data points beyond the lower and upper quartiles.
Fig. 5
Fig. 5. Frequencies of molecular subtypes.
a Concordance of ALLIUM subtype estimation for 67 B-other patients with both DNA methylation (DNAm, x-axis) and gene expression (GEX, y-axis) data. b ALLIUM stratification into subtype and tier group for the 154 B-other patients. c Subtype distribution after molecular and ALLIUM re-classification for the complete set of 281 patients with unclassified subtype at the start of the study. d Unsupervised dimensionality reduction (UMAP) based on the DNAm levels of 379 CpG sites across the 971 samples with molecularly defined subtype and 139 controls used to train ALLIUM DNAm and the 102 B-other samples reclassified by ALLIUM DNAm. e UMAP based on 356 genes across 248 samples with molecularly defined subtype and 12 controls used to design ALLIUM GEX and the 56 B-other samples reclassified by ALLIUM GEX. f Flow chart of molecular subtype revision in the study. g Distribution of subtypes across entire BCP-ALL cohort (n = 1025) color-coded by subtype determined at ALL diagnosis (start of study) and h distribution after molecular screening and ALLIUM re-classification (end of study).
Fig. 6
Fig. 6. Clinical variables by molecular subtype of 1124 patients with clinical data available.
a Histogram of subtype distribution by age. The age distribution color coded by subtype determined at ALL diagnosis is indicated in the top panel. The distribution of the originally unclassified patients color coded by revised molecular subtype is indicated in the lower panel. b Boxplots of the white blood cell count (WBC) at ALL diagnosis by revised molecular subtype. c Boxplot of minimal residual disease (MRD) levels at day 29 of treatment, for 368 patients with MRD information available. d Stacked barplots showing sex, treatment protocol, risk groups, primary event, and cause of death per subtype by reclassified subtype. CR1: complete remission, DCR1: death in complete remission, smn: secondary malignant neoplasm. The plots are color-coded based on their respective subtypes. The lines (whiskers) on the boxplots represent the distribution of residual data points beyond the lower and upper quartiles.

References

    1. Inaba H, Mullighan CG. Pediatric acute lymphoblastic leukemia. Haematologica. 2020;105:2524–2539. doi: 10.3324/haematol.2020.247031. - DOI - PMC - PubMed
    1. Arber DA, et al. International Consensus Classification of Myeloid Neoplasms and Acute Leukemias: integrating morphologic, clinical, and genomic data. Blood. 2022;140:1200–1228. doi: 10.1182/blood.2022015850. - DOI - PMC - PubMed
    1. Lilljebjörn H, Fioretos T. New oncogenic subtypes in pediatric B-cell precursor acute lymphoblastic leukemia. Blood. 2017;130:1395–1401. doi: 10.1182/blood-2017-05-742643. - DOI - PubMed
    1. den Boer ML, et al. Outcomes of paediatric patients with B-cell acute lymphocytic leukaemia with ABL-class fusion in the pre-tyrosine-kinase inhibitor era: a multicentre, retrospective, cohort study. Lancet Haematol. 2021;8:e55–e66. doi: 10.1016/S2352-3026(20)30353-7. - DOI - PMC - PubMed
    1. Gu Z, et al. Genomic analyses identify recurrent MEF2D fusions in acute lymphoblastic leukaemia. Nat. Commun. 2016;7:13331. doi: 10.1038/ncomms13331. - DOI - PMC - PubMed