. 2024 Jan;4(1):95-109.
doi: 10.1038/s43587-023-00538-3. Epub 2023 Dec 8.

Longitudinal modeling of human neuronal aging reveals the contribution of the RCAN1-TFEB pathway to Huntington's disease neurodegeneration

Affiliations

Longitudinal modeling of human neuronal aging reveals the contribution of the RCAN1-TFEB pathway to Huntington's disease neurodegeneration

Seong Won Lee et al. Nat Aging. 2024 Jan.

Abstract

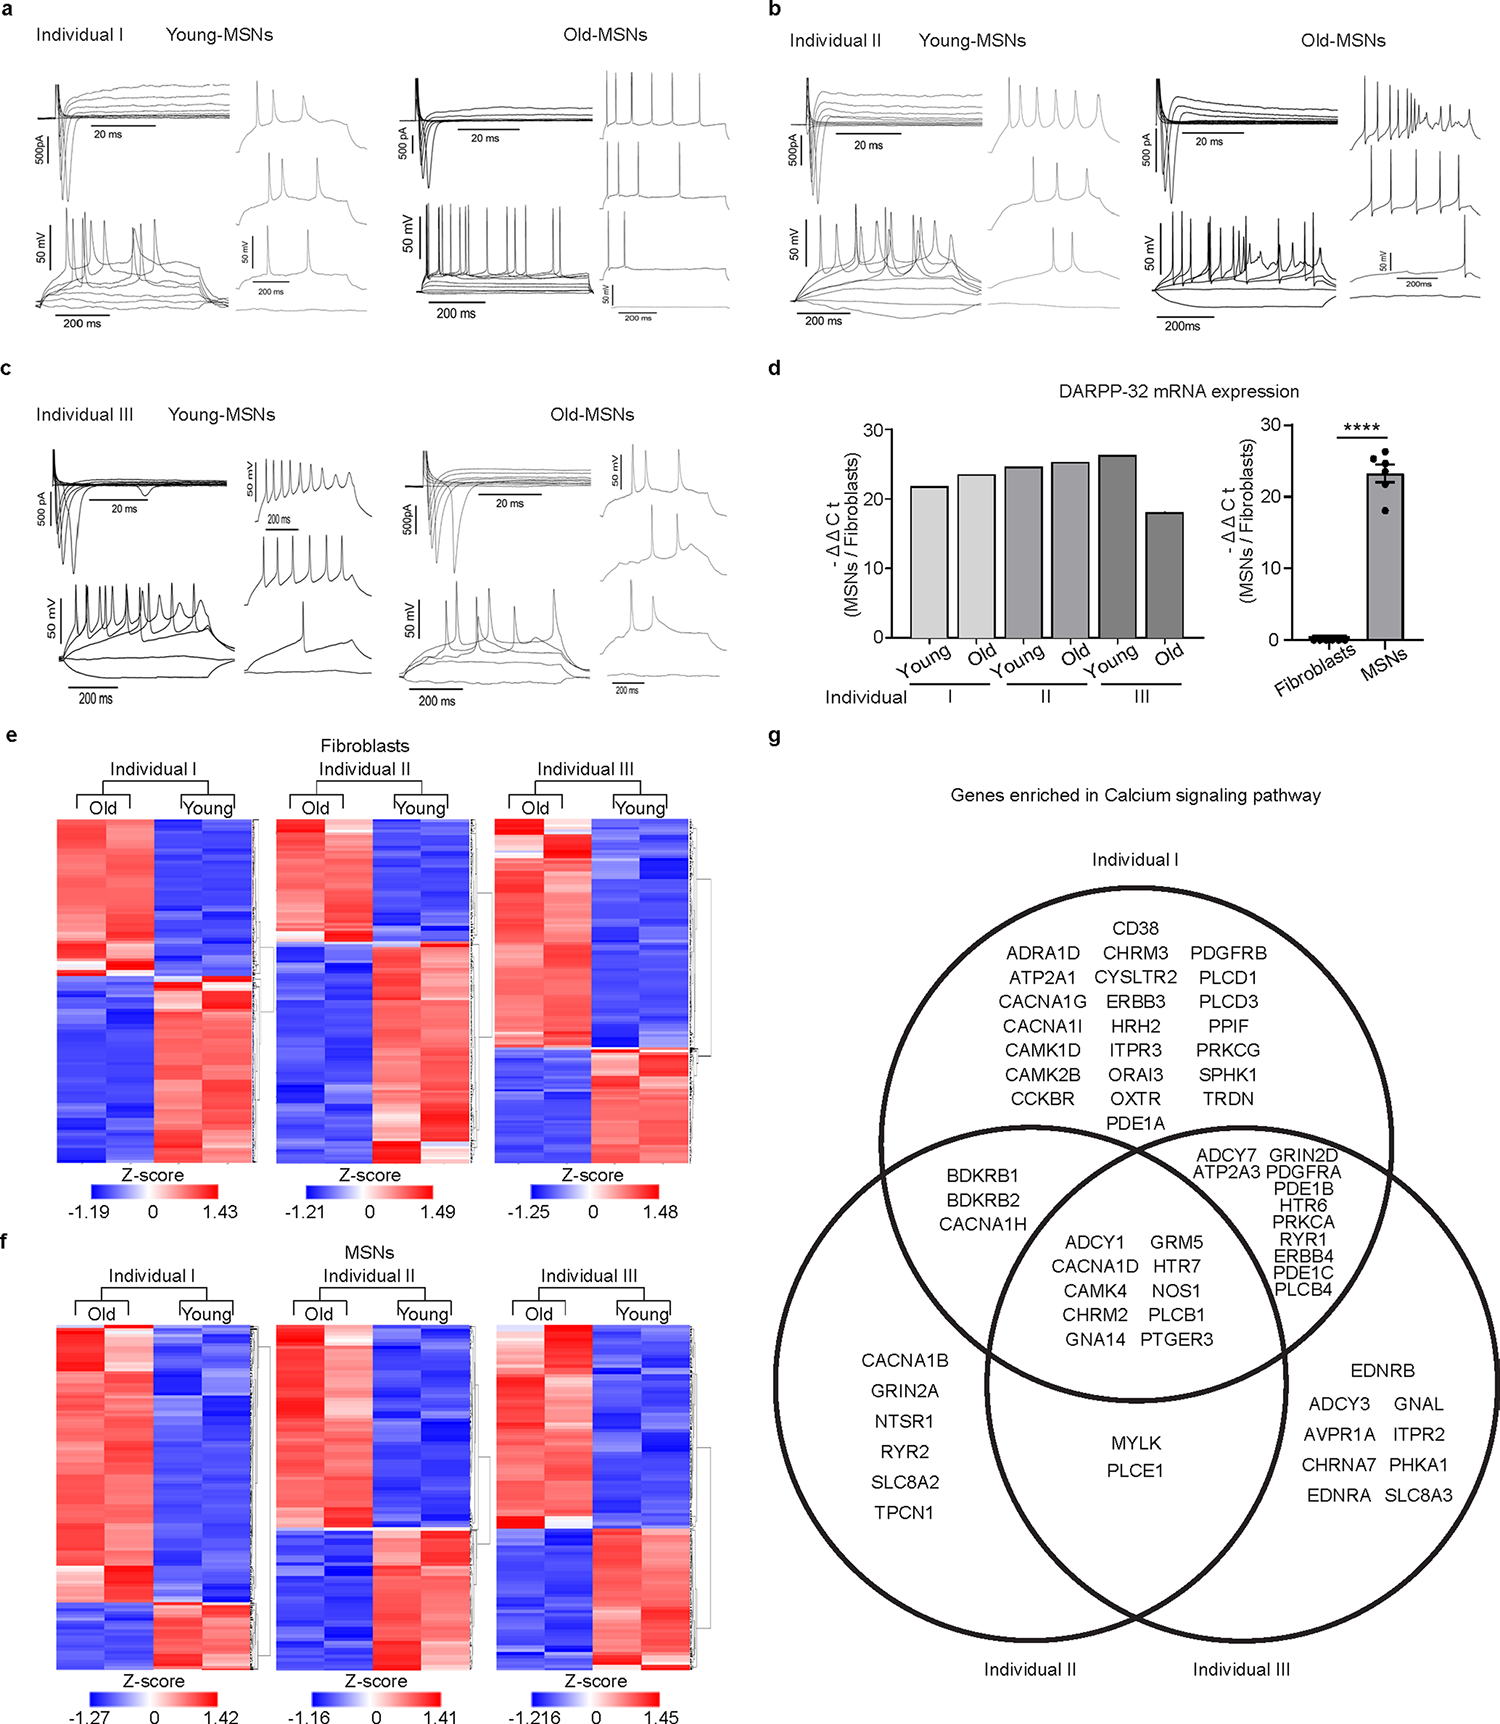
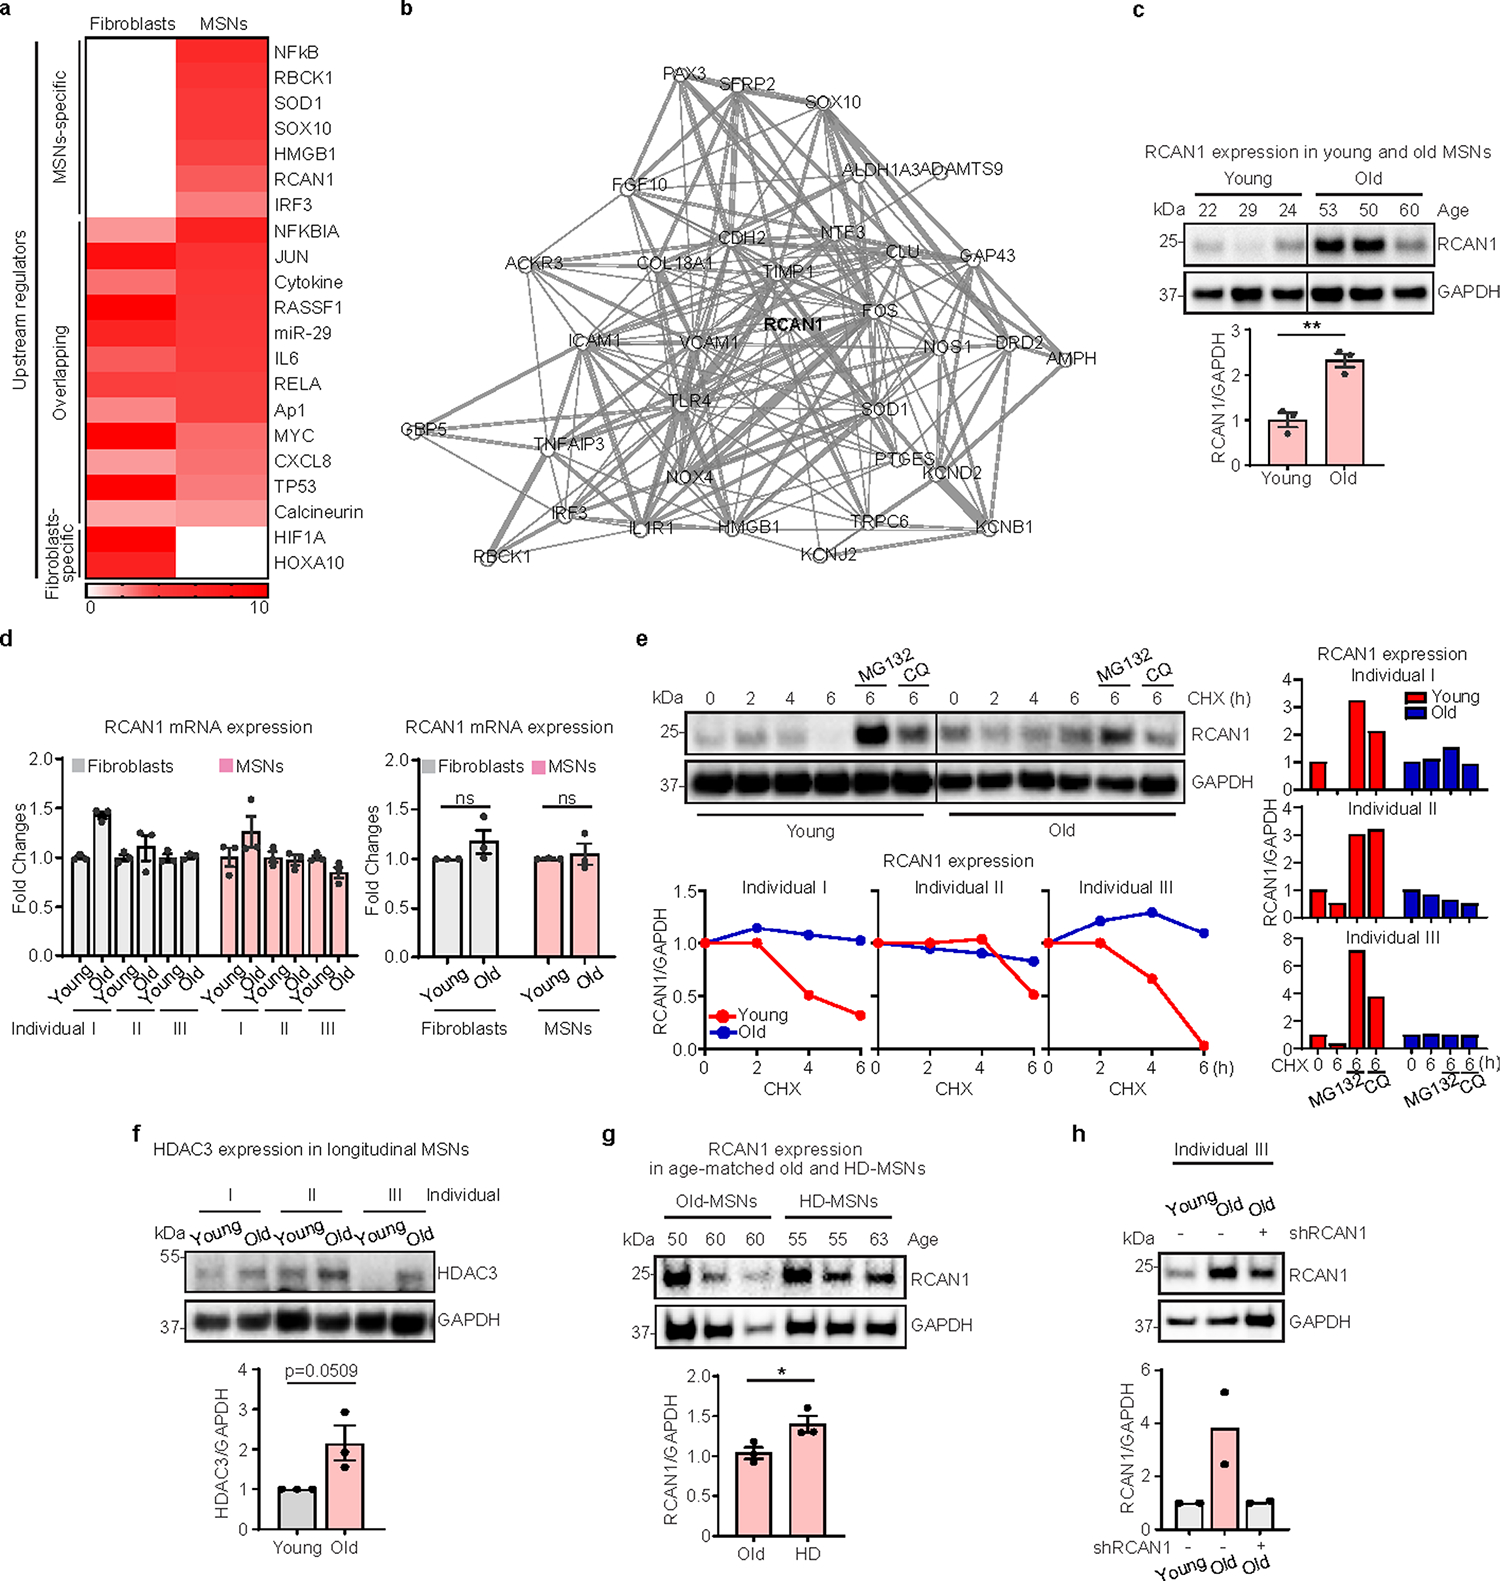
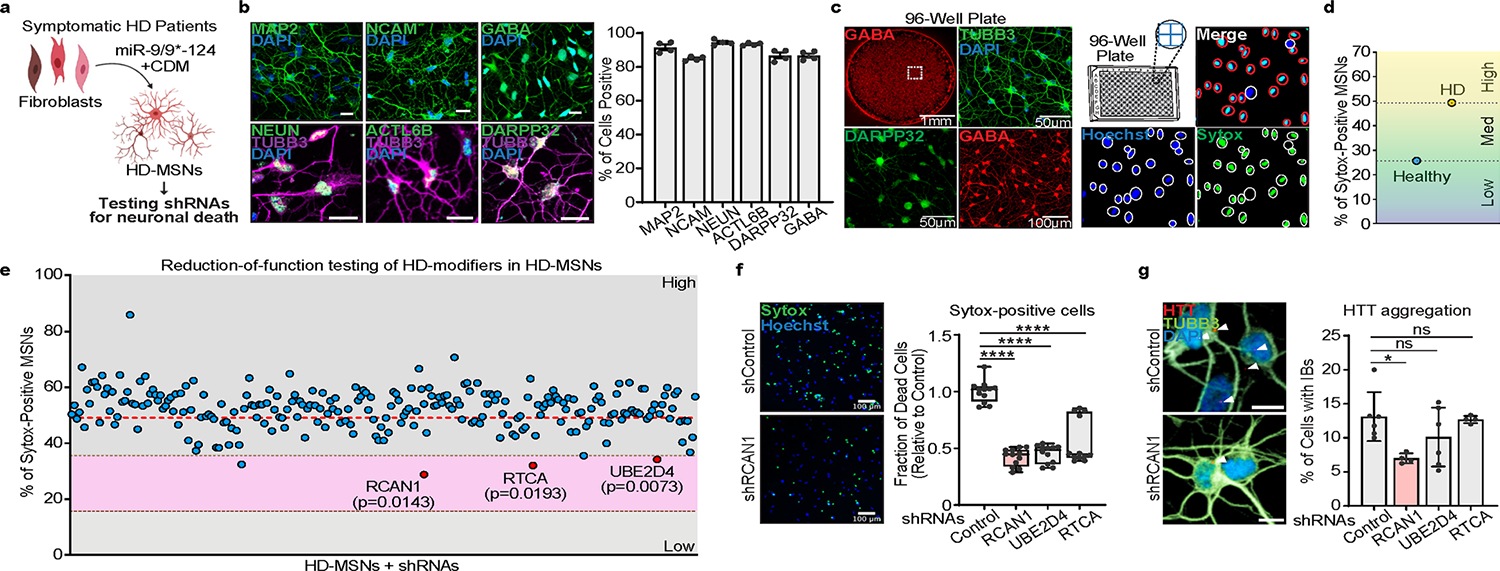
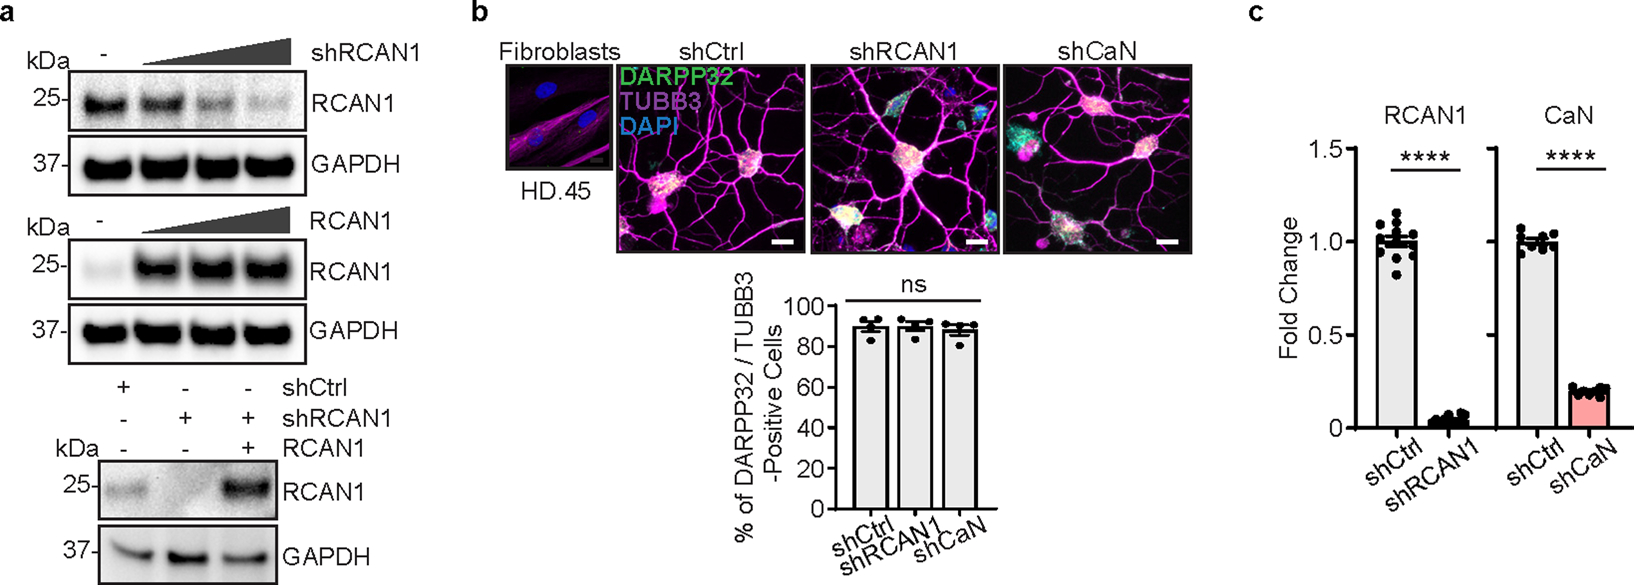
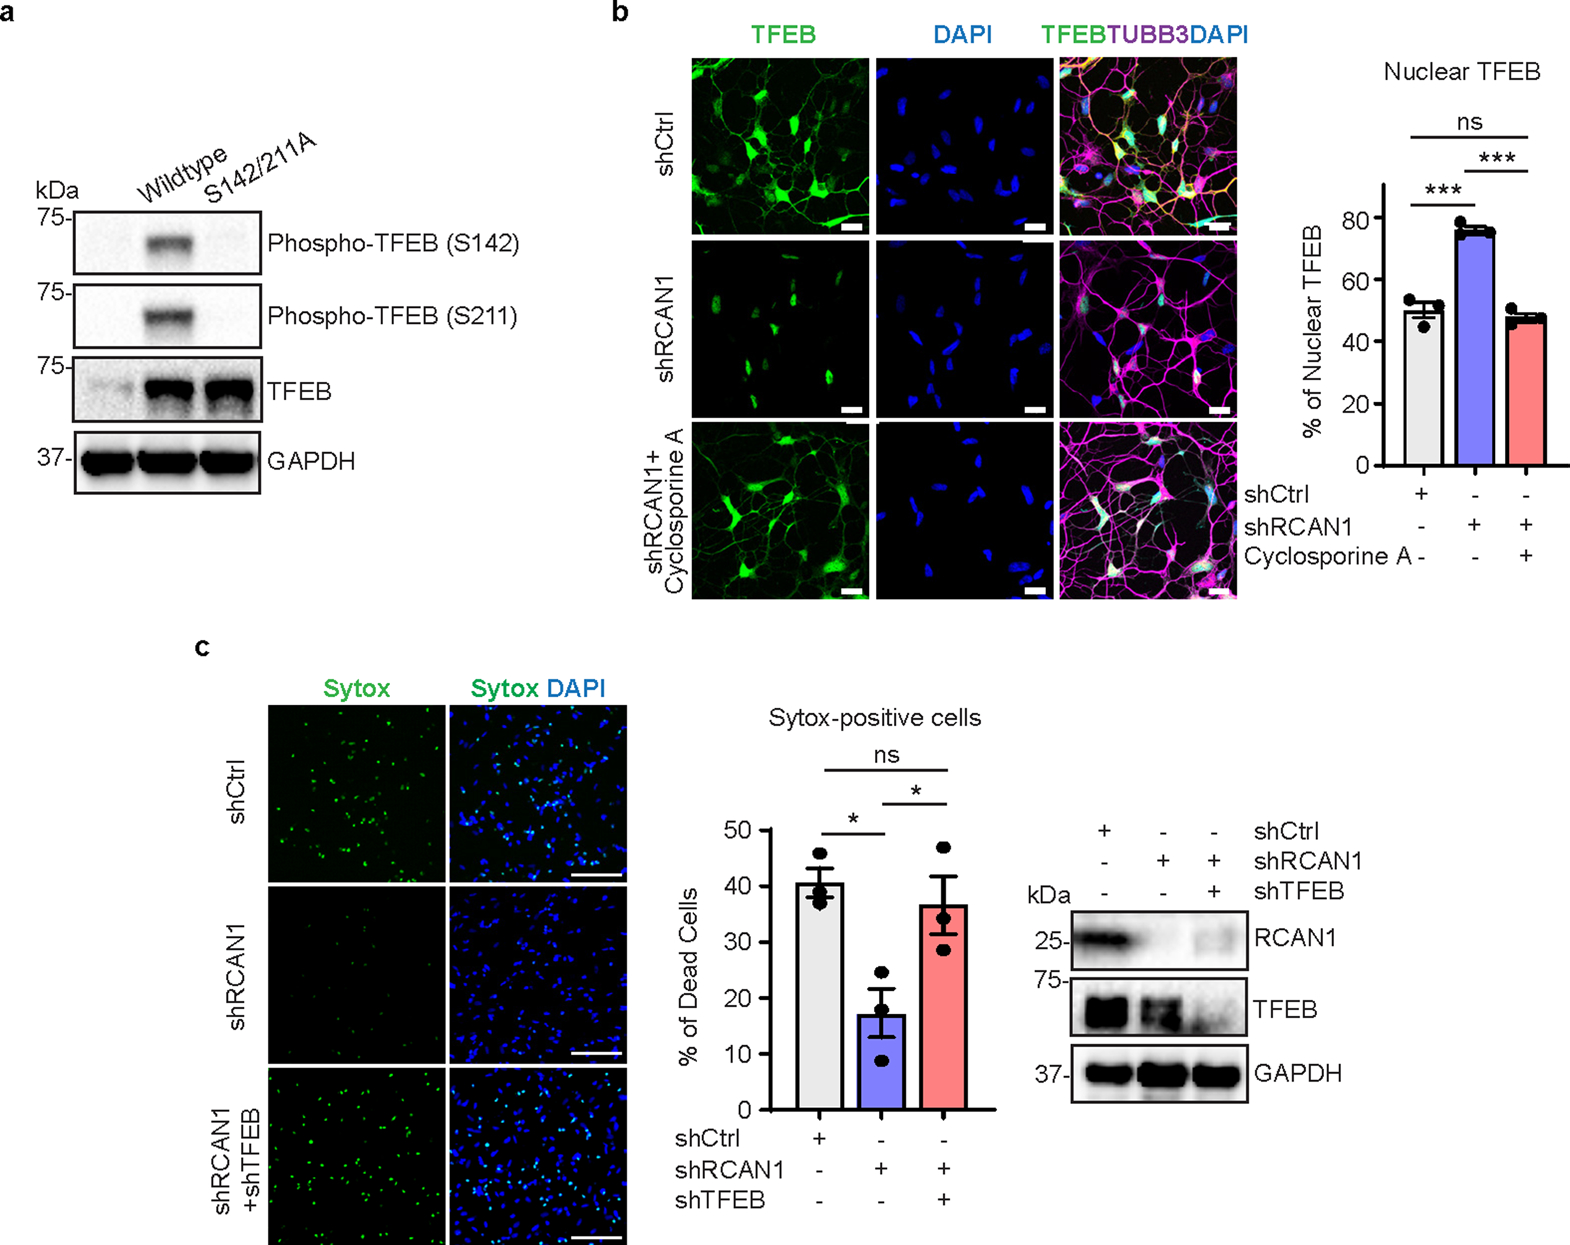
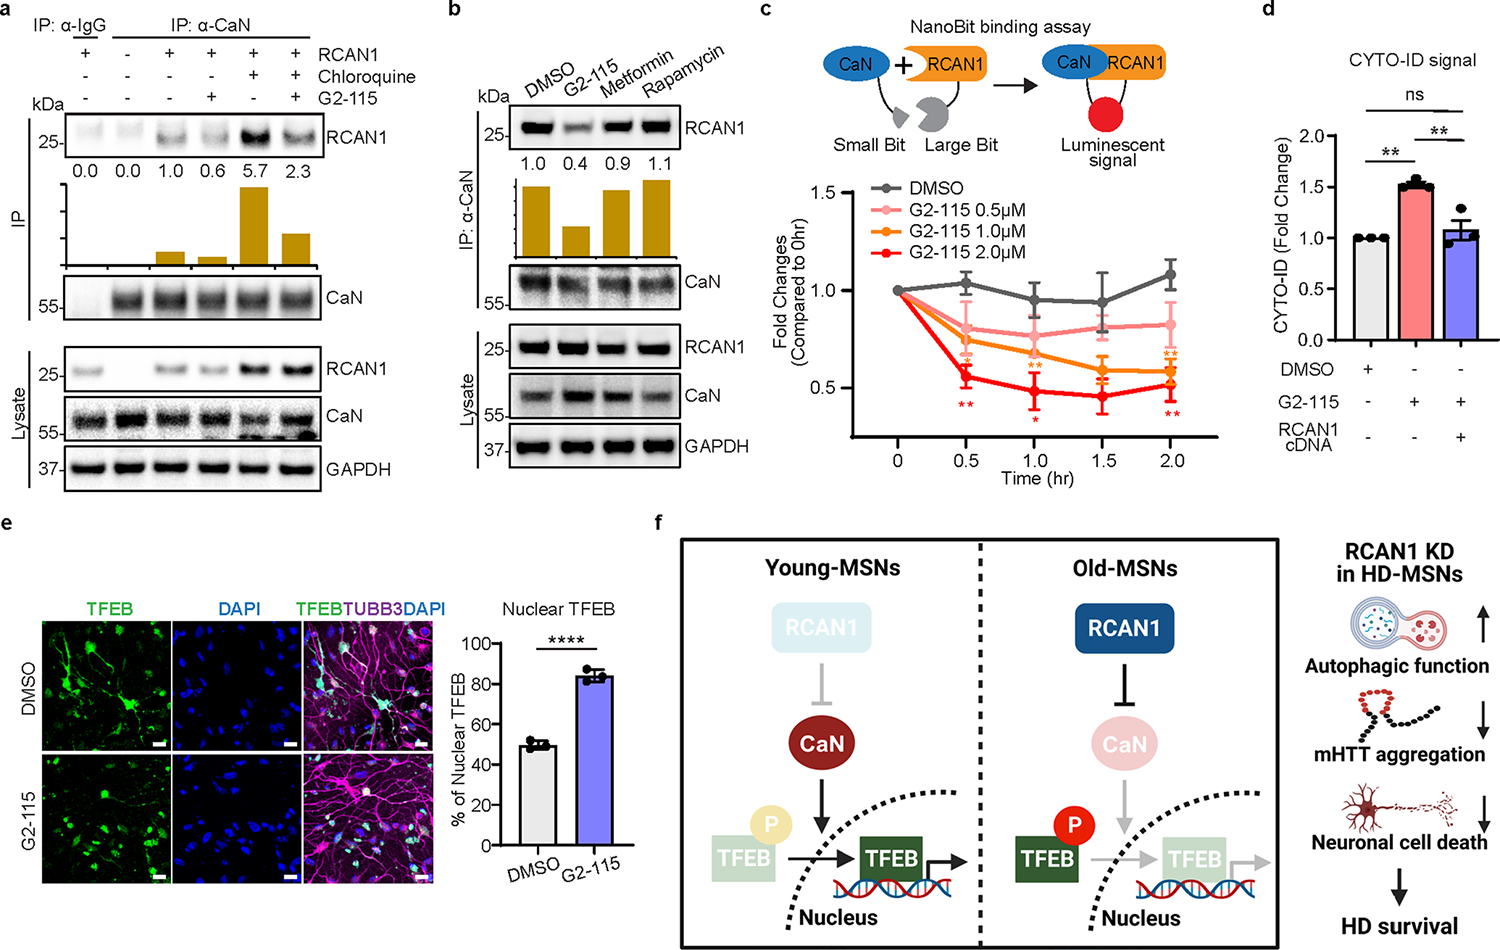
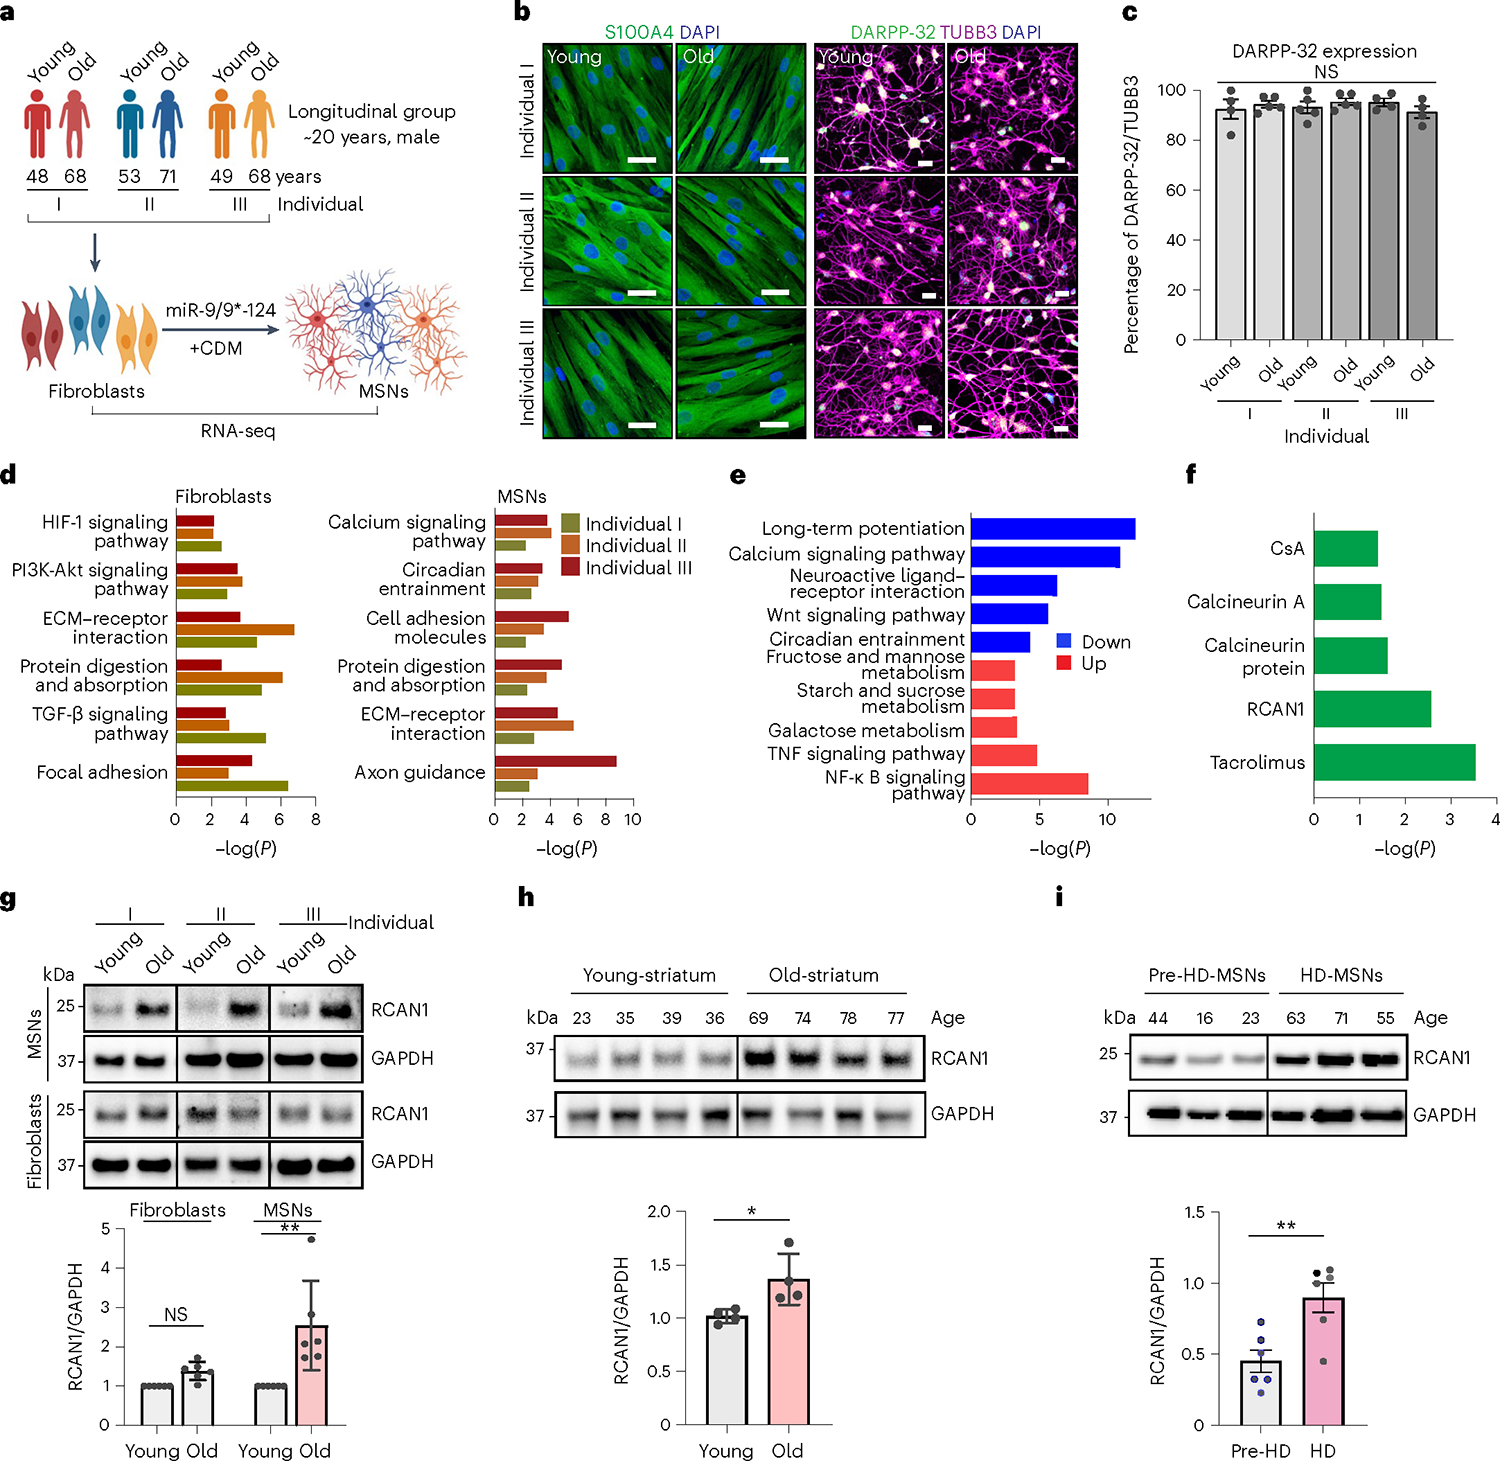
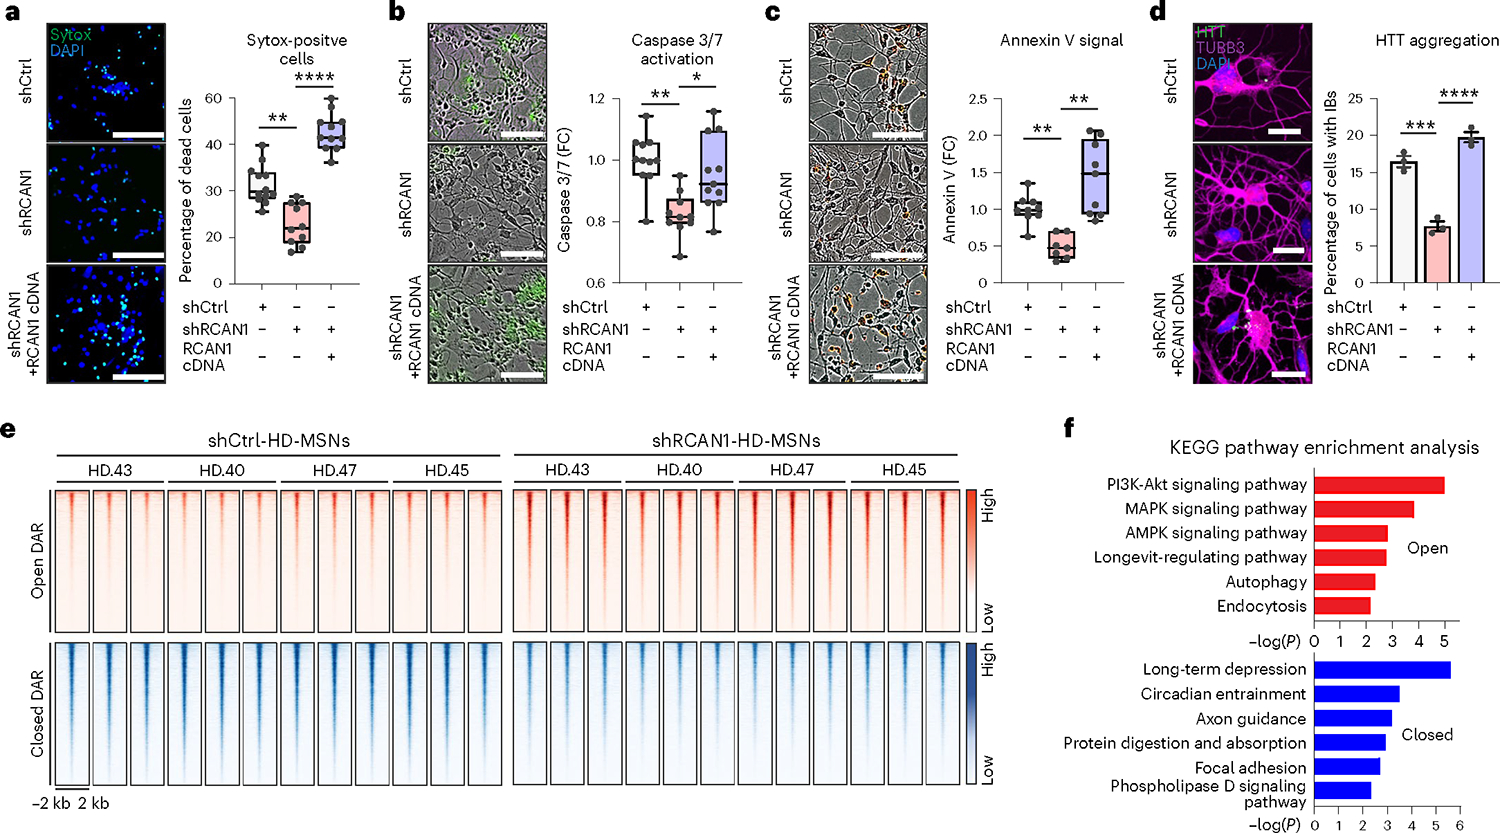
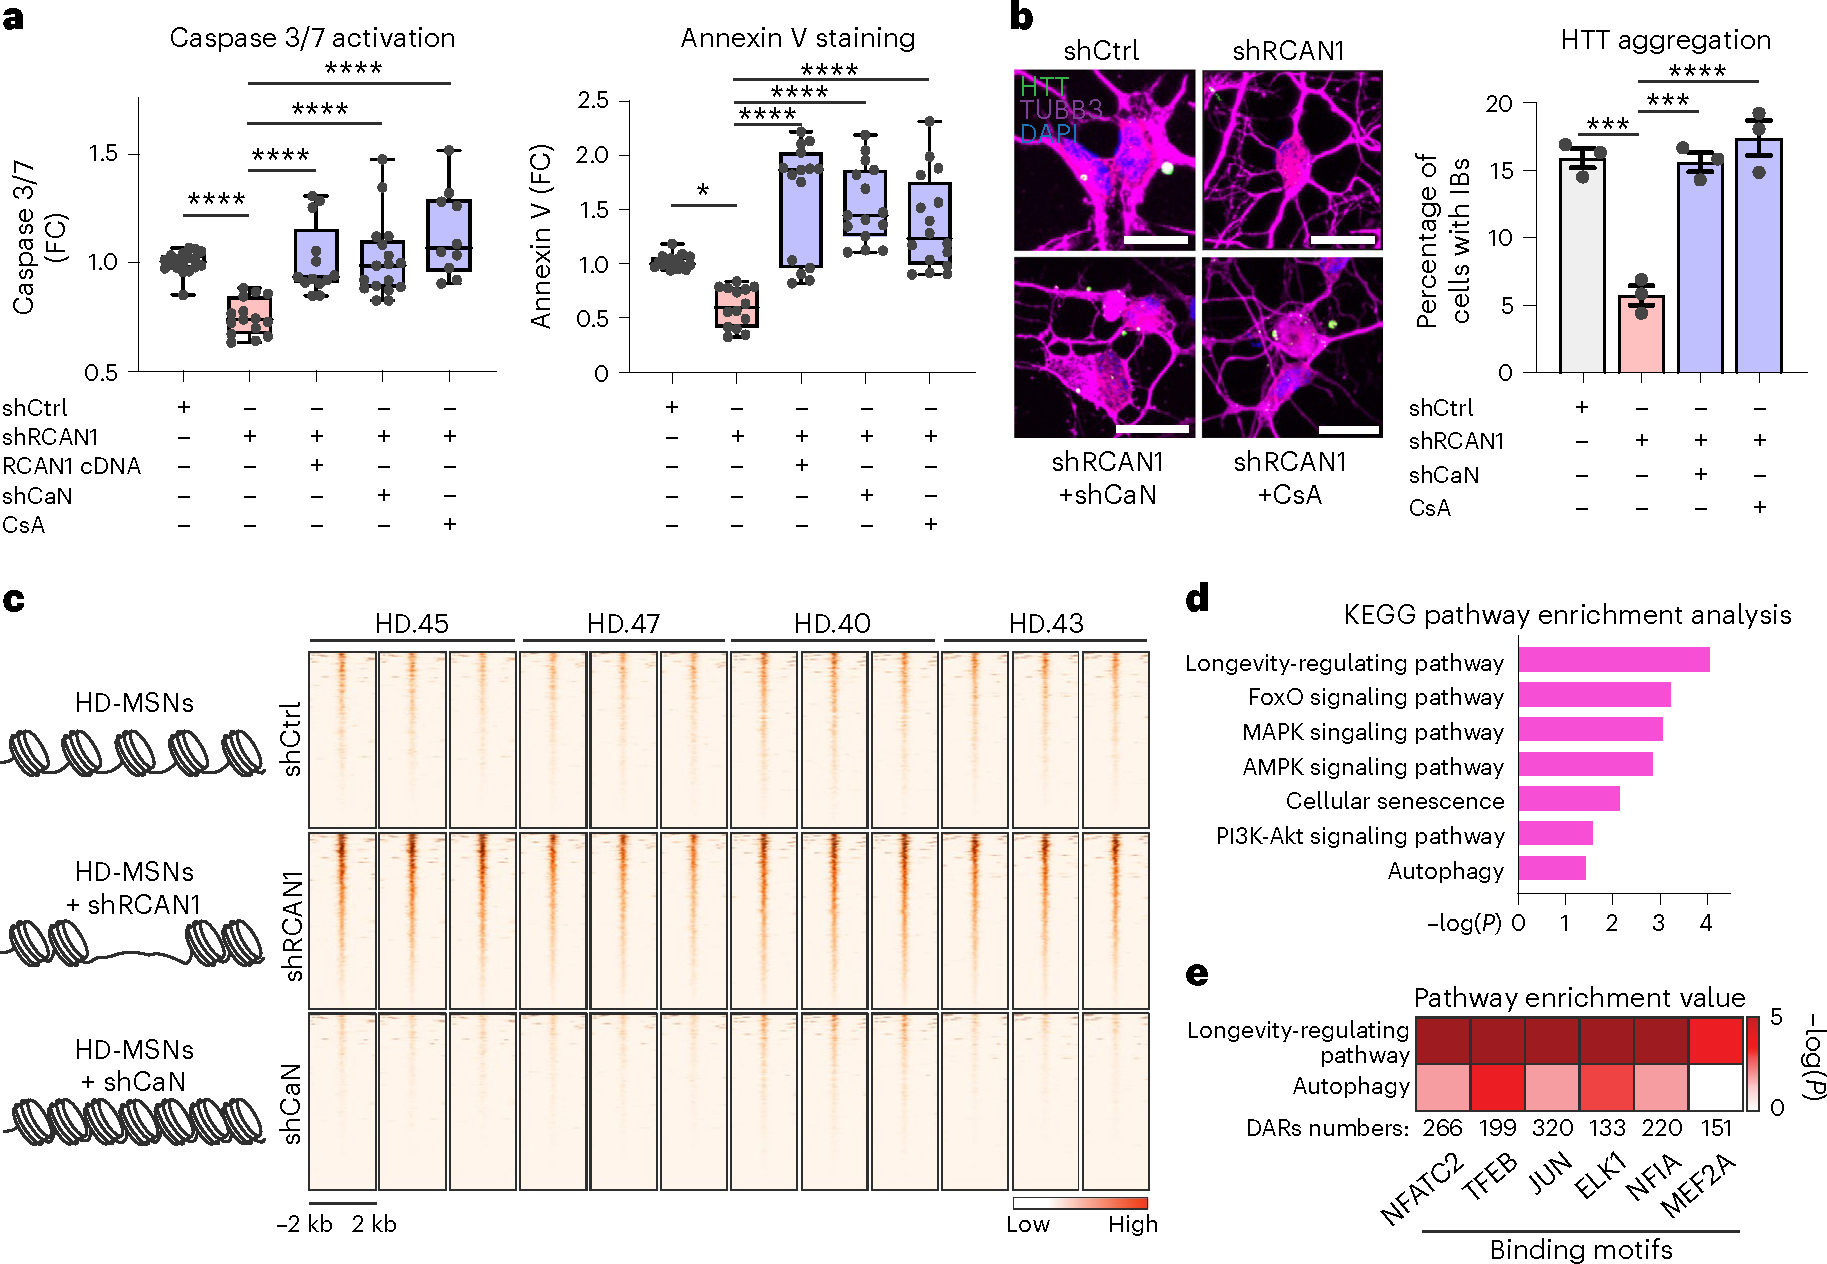
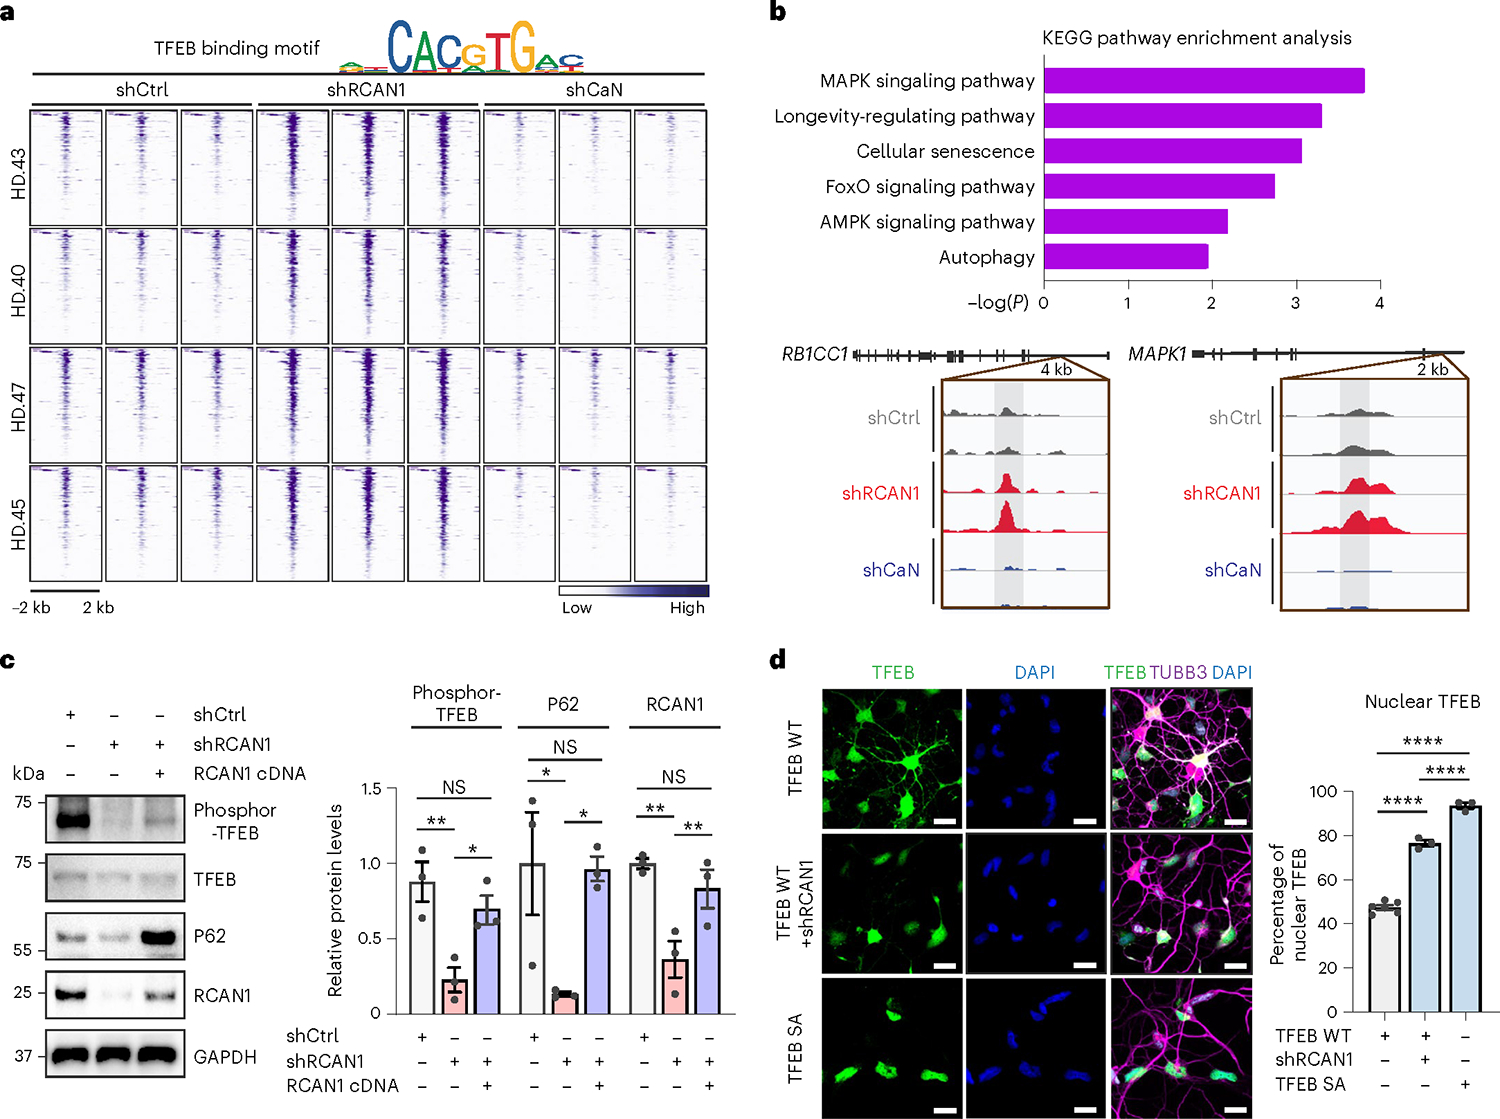
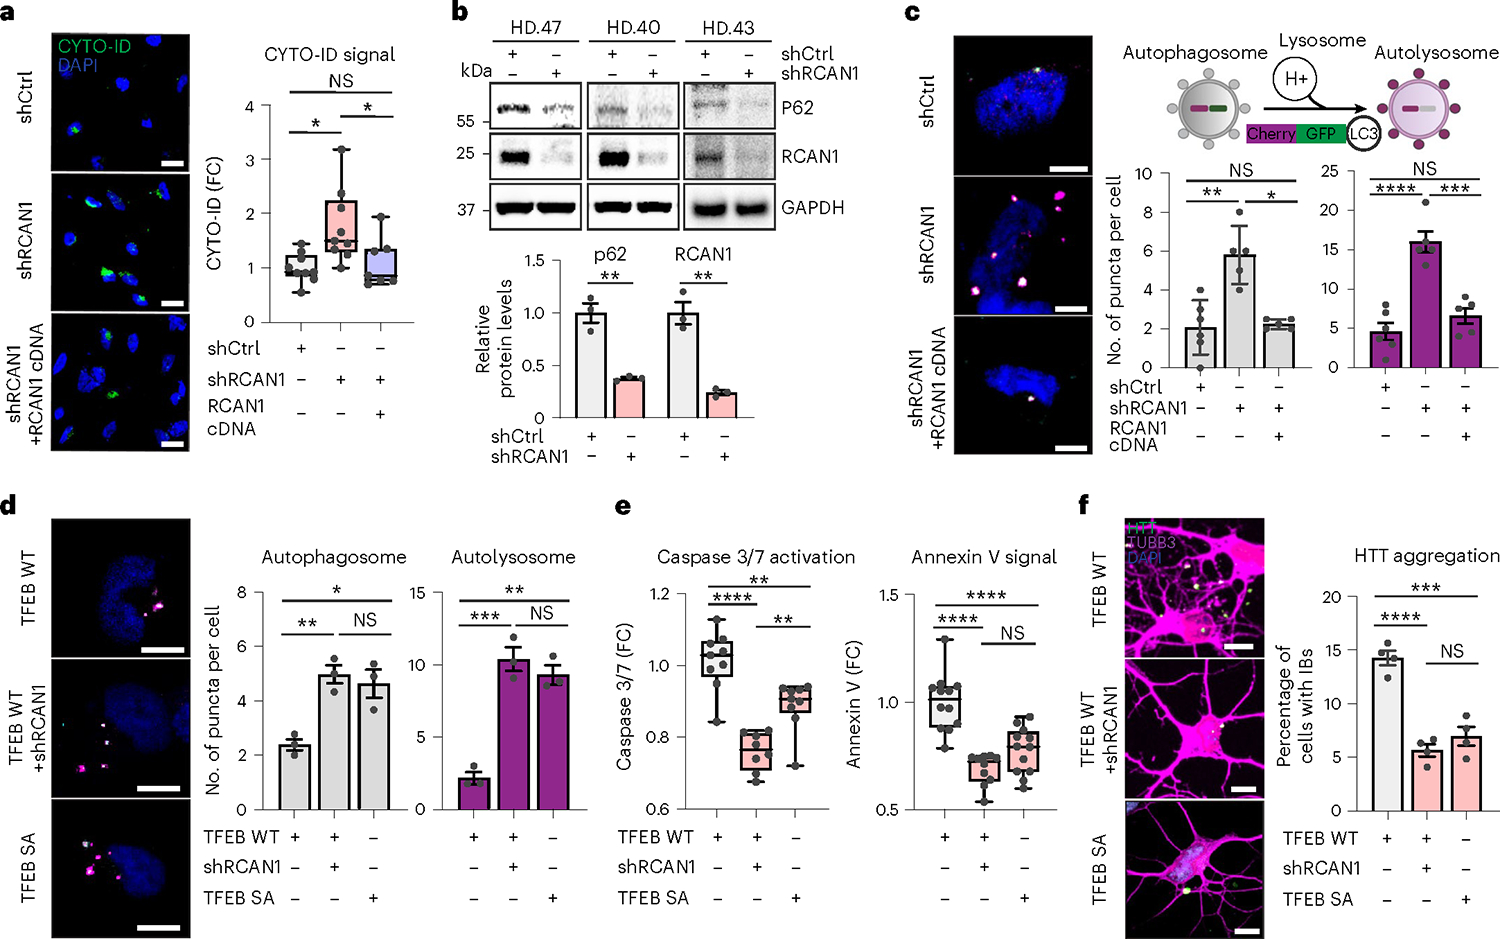
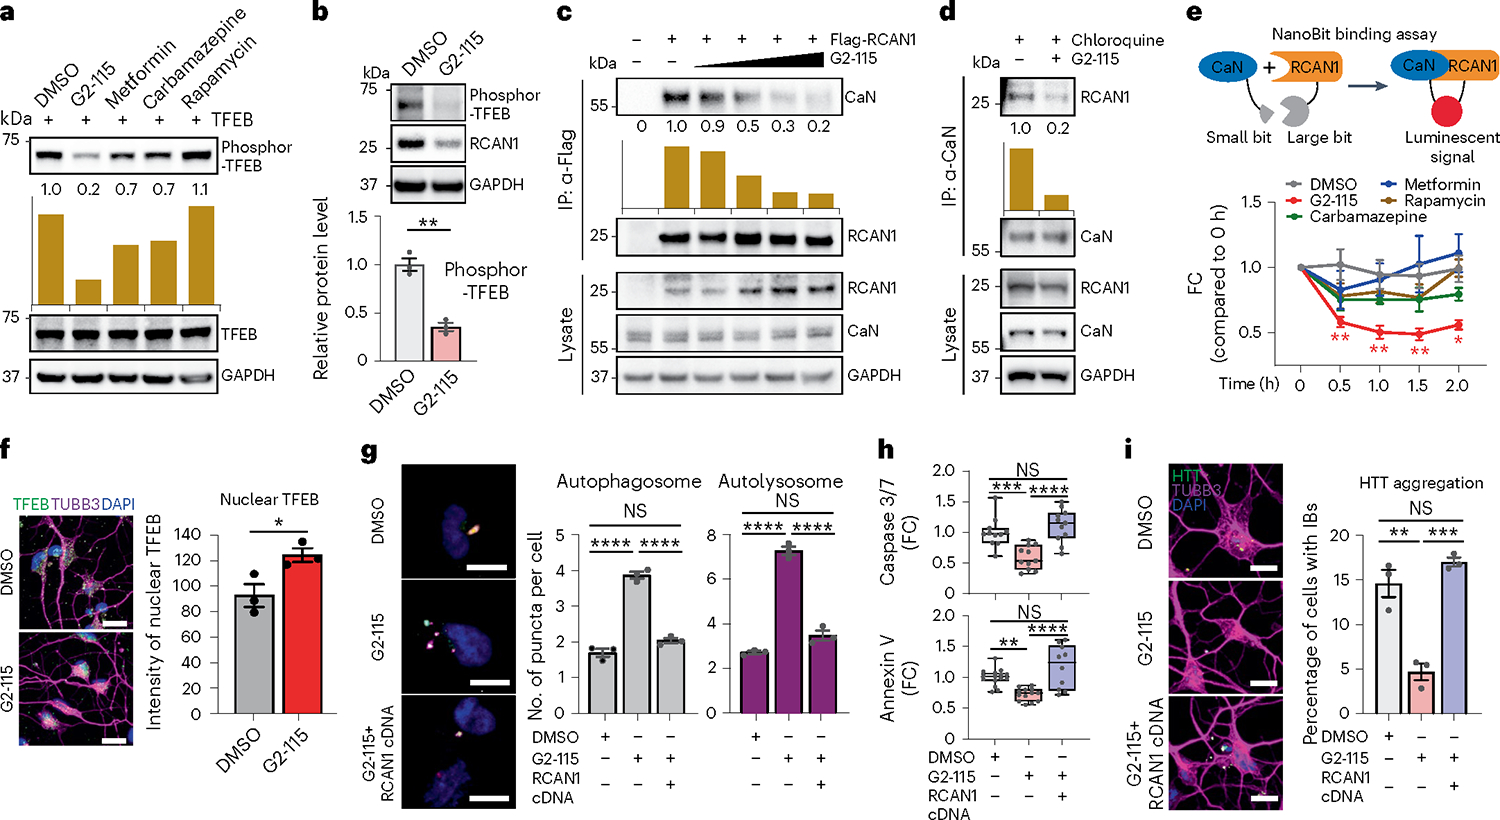
Aging is a common risk factor in neurodegenerative disorders. Investigating neuronal aging in an isogenic background stands to facilitate analysis of the interplay between neuronal aging and neurodegeneration. Here we perform direct neuronal reprogramming of longitudinally collected human fibroblasts to reveal genetic pathways altered at different ages. Comparative transcriptome analysis of longitudinally aged striatal medium spiny neurons (MSNs) in Huntington's disease identified pathways involving RCAN1, a negative regulator of calcineurin. Notably, RCAN1 protein increased with age in reprogrammed MSNs as well as in human postmortem striatum and RCAN1 knockdown rescued patient-derived MSNs of Huntington's disease from degeneration. RCAN1 knockdown enhanced chromatin accessibility of genes involved in longevity and autophagy, mediated through enhanced calcineurin activity, leading to TFEB's nuclear localization by dephosphorylation. Furthermore, G2-115, an analog of glibenclamide with autophagy-enhancing activities, reduced the RCAN1-calcineurin interaction, phenocopying the effect of RCAN1 knockdown. Our results demonstrate that targeting RCAN1 genetically or pharmacologically can increase neuronal resilience in Huntington's disease.


Conflict of interest statement

Competing interests

The authors declare no competing interests.

Figures

Extended Data Fig. 1 |
Extended Data Fig. 1 |. Gene expression profiling in longitudinally collected fibroblasts and corresponding reprogrammed MSNs.
a-c, Whole-cell recording from reprogrammed MSNs from three independent longitudinal groups (individual I (a); II (b); III (c)) co-cultured with human astrocytes showing the inward/outward currents and multiple action potentials (APs). d, RT-qPCR analysis of DARPP-32 expression in longitudinally aged MSNs (n = 6, ****p < 0.0001, The sample size (n) corresponds to the number of biologically independent samples). Statistical significance was determined using two-tailed unpaired t-test and mean±s.e.m. e and f, Heatmap of Differentially Expressed Genes (DEGs) in fibroblasts (e) and MSNs (f) (FDR < 0.05, | FC | ≥ 1.5). g, Venn diagram of the genes enriched in calcium signaling pathway from old HD-MSNs.
Extended Data Fig. 2 |
Extended Data Fig. 2 |. Age-associated RCAN1 in longitudinally aged MSN.
a, Upstream regulator analysis of up- or down-regulated genes in old fibroblasts and MSNs. b, Gene network of upstream regulators and DEGs. c, Representative immunoblotting (top) and quantification (bottom) of RCAN1 expression in six MSNs from 22, 29, 24 (young) and 53, 50, 60 (old) years old-individuals (young n = 3, old n = 3, **p = 0.0038). d, Quantification of RCAN1 mRNA from six independent fibroblasts and MSNs from three longitudinal individuals (I, II, and III) (Fibroblasts n = 12, MSNs n = 12). e, Representative immunoblotting (top, left) and quantification of relative RCAN1 expression normalized to GAPDH (bottom. left) in Young / Old-MSNs from three longitudinal individuals treated with cyclohexamide (CHX). Comparison of RCAN1 expression in CHX-treated MSNs (Young and Old) from three longitudinal individuals in the presence of DMSO, MG132 or, CQ (right) (n = 6). f. Representative immunoblotting (top) and quantification (bottom) of RCAN1 expression in age-matched control-Old-MSNs and HD-MSNs (n = 6). g. Representative Immunoblotting (top) and quantification (bottom) of HDAC3 expression in MSNs from three longitudinal individuals (n = 6, *p = 0.0467). h. Representative immunoblotting (top) and quantification (bottom) of RCAN1 expression in individual III’s MSNs (n = 2). Statistical significance was determined using two-tailed unpaired t-test (c,f,g) and one-way ANOVA with Tukey’s post hoc test (d,h). *p < 0.05, **p < 0.01, ns, not significant, and mean±s.e.m (c,d,f,g). The sample size (n) corresponds to the number of biologically independent samples (c-h).
Extended Data Fig. 3 |
Extended Data Fig. 3 |. Identification of modifier genes whose reduction protects HD-MSNs from degeneration.
a, Experimental scheme of genetic modifiers testing in HD-MSNs. b, Representative images (left) and quantification (right) of MAP2-, NCAM-, NEUN-, ACTL6B-, DARPP-32-, and GABA-positive cells from four independent HD-MSNs (HD.43, HD.40, HD.47, HD.45). An average of 300 cells per each were counted from three or more randomly chosen fields (n = 4). Scale bars represent 20 μm. c, High-content imaging of Sytox green dye accumulation in HD-MSNs (HD.46) in a 96-well format. Representative images of HD-MSNs in each well of a 96-well plate, immunostained with anti-GABA, TUBB3, and DARPP-32 antibodies (left). Example pictures for high content image analysis to measure cell death levels (right): Hoechst for whole cell population and Sytox-green for dead cells. d, Quantification of Sytox-positive cells from HD-MSNs (HD.46) and healthy control (Ctrl.17) at post-induction day 35 (n = 2). e, Quantification of Sytox-positive cells in HD-MSNs (HD.46) transduced with shRNAs of modifier genes. The genes whose reduction significantly lowered cell death levels were marked (red) within the pink area (± 10 % of cell death level from healthy control) compared to control shRNA. Statistical significance was determined using unpaired t-test and mean±s.e.m (n = 2, RCAN1: p = 0.0143); RTCA: p = 0.0198); UBE2D4: p = 0.0073). f, Representative image (left) and quantification (right) of Sytox-positive cells from three independent HD-MSNs (HD.46, HD.44, HD.43) transduced with shRNAs of each gene (n = 12). Scale bars represent 100 μm. Box-and-whiskers plot: The center line denotes the median value while the box contains the 25th to 75th percentiles of dataset. The whiskers mark minimal value to maximal value. ****p < 0.0001. g, Representative image (left) and quantification (right) of cells with HTT inclusion bodies (IBs) in HD-MSNs (HD.40) transduced with shRNAs of each gene. Cells were immunostained with anti-HTT and TUBB3 antibodies. An average of 100 cells per each were counted from four to six randomly chosen fields (n = 6, 4, 6, 4). Scale bars represent 10μm. Statistical significance was determined using unpaired t-test (e) and one-way ANOVA with Tukey’s post-hoc test (f,g); ****p < 0.0001, *p < 0.05, ns, not significant, and mean±s.e.m. The sample size (n) corresponds to the number of biologically independent samples (b,d,e,f,g).
Extended Data Fig. 4 |
Extended Data Fig. 4 |. Validation of reprogrammed neurons of rescuing or non-rescuing condition for ATAC-sequencing.
a, RCAN1 expression in fibroblasts transduced with shRCAN1 (top) or RCAN1 (middle) in a dose-dependent manner. RCAN1 expression in HD-MSNs (HD.43) transduced with shCtrl, shRCAN1, or RCAN1 (bottom). b, Representative image (top) and quantification (bottom) of DARPP-32-positive cells from four independent HD-MSNs transduced with shCtrl, shRCAN1, or shCaN (HD.43, HD.40, HD.47, HD.45). Cells were immunostained with anti-DARPP-32 and TUBB3 antibodies. An average of 183 cells of each were counted from three or more randomly chosen fields (n = 4). Scale bars represent 10 μM. c, RT-qPCR analysis of the expression of RCAN1 and CaN in (b) (n = 12, 12, 8, 8). Statistical significance was determined using one-way ANOVA with Tukey’s post-hoc test (b) and two-tailed unpaired t-test (c); ****p < 0.0001, ns, not significant, and mean±s.e.m (b,c). The sample size (n) corresponds to the number of biologically independent samples (b,c).
Extended Data Fig. 5 |
Extended Data Fig. 5 |. RCAN1 promotes nuclear localization of TFEB for HD survival.
a, Expression of phosphor-TFEB in fibroblasts transduced with Control, TFEB wildtype, or phosphor-mutant (S142/211 A). b. Representative image (left) and quantification of nuclear TFEB from three independent HD-MSNs (HD.45, HD.45b, HD.47) transduced with shCtrl or shRCAN1. Cells were treated with DMSO or Cyclosporin A (CaN inhibitor) (n = 3). shCtrl versus shRCAN1 ***p = 0.0002, shRCAN1 versus shRCAN1+Cyclosporin A ***p = 0.0001. c, Representative image (left) and quantification of Sytox-positive cells (middle) from three independent HD-MSNs (HD.45, HD.45b, HD.47) transduced with shCtrl, shRCAN1, or shTFEB. Expression of RCAN1 and TFEB in HD-MSNs transduced with shCtrl, shRCAN1, or shTFEB (right) (n = 3). Statistical significance was determined using one-way ANOVA with Tukey’s post hoc test (b,c); ***p < 0.001, *p < 0.05, ns, not significant, and mean±s.e.m (b,c). The sample size (n) corresponds to the number of biologically independent samples (b,c).
Extended Data Fig. 6 |
Extended Data Fig. 6 |. Neuroprotective role of G2–115 through reducing RCAN1-CaN interaction.
a, Immunoprecipitation analysis of RCAN1-transduced fibroblasts with anti-CaN antibody followed by immunoblotting with anti-RCAN1 antibody. Cells are treated with 0.5 μM of G2–115 and 60 μM of chloroquine (lysosome inhibitor). b, Immunoprecipitation analysis of RCAN1-transduced fibroblasts with anti-CaN followed by immunoblotting with anti-RCAN1 antibody. Cells were treated with DMSO or 0.5 μM of G2–115, 8 mM of metformin, and 500 nM of rapamycin. c, Experimental scheme of NanoBit binding assay (top). Binding assay of HEK293 cells transfected with RCAN1 fused to large Bit and CaN fused to small Bit. Cells were treated with 0.5, 1.0, 1.5, and 2.0 μM of G2–115 in a dose-dependent manner (bottom). (n = 3, The sample size (n) corresponds to the number of independent experiments). DMSO versus G2–115 1.0 μM 0.5 hr *p = 0.0379, 1.0 hr **p = 0.0091, 2.0 hr **p = 0.0082, DMSO versus G2–115 2.0 μM 0.5 hr **p = 0.0044, 1.0 hr *p = 0.0230, 2.0 hr **p = 0.0084. d, Quantification of CYTO-ID-positive cells from three independent HD-MSNs (HD.45, HD.45b, HD.47) treated with DMSO or G2–115. Cells were transduced with RCAN1 (n = 3). DMSO versus G2–115 **p = 0.0025, G2–115 versus G2–115 + RCAN1 cDNA **p = 0.0060. e, Representative image (left) and quantification (right) of nuclear TFEB from three-independent HD-MSNs (HD.45, HD.45b, HD.47) treated with DMSO or G2–115. Cells were immunostained with anti-TFEB and TUBB3 antibodies. An average of 107 cells per each were counted from three or more randomly chosen fields (n = 3, ****p < 0.0001). Scale bars represent 20 μm. f, Graphical work model to illustrate the function of RCAN1-CaN-TFEB cascade in Young/Old-MSNs (left) and the neuroprotective role of RCAN1 KD for HD survival. Statistical significance was determined using one-way ANOVA with Tukey’s post hoc test in (d) and two-tailed unpaired t-test (c,e); ****p < 0.0001, **p < 0.01, *p < 0.05, ns, not significant, and mean±s.e.m (c-e). The sample size (n) corresponds to the number of biologically independent samples (d,e).
Fig. 1 |
Fig. 1 |. Identification of RCAN1 as an age-associated factor in reprogrammed MSNs from longitudinally collected fibroblasts.
a, Experimental scheme of RNA-seq in fibroblasts and reprogrammed MSNs (young and old) from three independent longitudinal groups from individuals I, II and III. MSNs were reprogrammed by overexpressing miR-9/9* and miR-124 (miR-9/9*−124) as well as MSN-defining TFs CTIP2, DLX1, DLX2 and MYT1L (CDM). b, Representative images of fibroblasts marked by S100A4 (left) and corresponding reprogrammed MSNs marked by DARPP-32 used for RNA-seq. c, Quantification of DARPP-32-positive cells from reprogrammed MSNs from all samples (individual I: young, n = 4; old, n = 5; individual II: young, n = 5; old, n = 5; individual III: young, n = 4; old, n = 4). An average of 300 cells were counted from four or more randomly chosen fields. Scale bars, 20 μm. d, Gene Ontology (GO) enrichment analysis of all DEGs in two replicates of old-fibroblasts (left) and old-MSNs (right) from three independent individuals (FDR < 0.05, | FC | ≥ 1.5). e, GO enrichment analysis of up-/downregulated genes commonly manifested in old-MSNs compared with young-MSNs (FDR < 0.05, | FC | ≥ 1.5). f, Upstream regulator analysis of up-/downregulated genes in old-MSNs in e. g, Representative immunoblotting (top) and quantification (bottom) of RCAN1 in longitudinal MSNs and fibroblasts (young and old) from three independent individuals (n = 6, **P = 0.0077). The quantification is normalized to values from young samples per line. h, Representative immunoblotting (top) and quantification (bottom) of RCAN1 expression in eight human striatum samples from age 23, 35, 39 and 36 (young) and age 69, 74, 78 and 77 (old) individuals (n = 8, *P = 0.0489). i, Representative immunoblotting (top) and quantification (bottom) of RCAN1 expression in three reprogrammed MSNs from presymptomatic patient-derived fibroblasts (44-, 16- and 23-year-old pre-HD-MSN: Pre-HD.42, Pre-HD.45, Pre-HD.40/50) and three reprogrammed MSNs from symptomatic patient-derived fibroblasts (63-, 71- and 55-year-old HD-MSN: HD.47, HD.40, HD.45) (n = 6, **P = 0.0063). Statistical significance was determined using one-way ANOVA with Tukey’s post hoc test (c), two-tailed paired t-test (g) and two-tailed unpaired t-test (h,i); **P < 0.01, *P < 0.05, NS, not significant, and mean ± s.e.m. (c,g,h,i). The sample size (n) corresponds to the number of biologically independent samples (c,g,h,i). DAPI, 4’,6-diamidino-2-phenylindole.
Fig. 2 |
Fig. 2 |. RCAN1 KD protects HD-MSNs from degeneration and induces chromatin accessibility changes.
ac, Representative images (left) and quantification (right) of Sytox-positive cells (n = 12, 10, 11; **P = 0.0021, ****P < 0.0001) (a), caspase 3/7 activation (green; n = 11, 10, 11; **P = 0.0023, *P = 0.0258) (b) and annexin V signal (red; n = 9, n = 7, n = 9; shCtrl versus shRCAN1 **P = 0.0012, shCtrl versus shRCAN1&RCAN1 cDNA **P = 0.0092) (c) in three independent HD-MSNs (HD.40, HD.43, HD.47) transduced with shCtrl, shRCAN1 or RCAN1 cDNA. Scale bars, 100 μm (ac). d, Representative images (left) and quantification (right) of cells with HTT inclusion bodies (IBs) in three independent HD-MSNs (HD.40, HD.43, HD.47; n = 3) transduced with shCtrl, shRCAN1 or RCAN1. Cells were immunostained with anti-HTT and TUBB3 antibodies. An average of 120 cells each were counted from three or more randomly chosen fields. Scale bars, 20 μm. Mean ± s.e.m. ***P = 0.0003, ****P < 0.0001. e,f, Analysis of ATAC-seq in four independent HD-MSNs (HD.43, HD.40, HD.47, HD.45) transduced with shCtrl or shRCAN1. e, Heatmaps of signal intensity in chromatin peaks (FDR < 0.05, | FC | ≥ 1.5) of open and closed DARs in shRCAN1-HD-MSNs compared with shCtrl-HD-MSNs. f, KEGG pathway enrichment analysis of genes associated with open (top) and closed (bottom) DARs in shRCAN1-HD-MSNs. Statistical significance was determined using one-way ANOVA with Tukey’s post hoc test (ad). In box-and-whisker plots, the center line denotes the median value, while the box contains the 25th to 75th percentiles of the dataset. The whiskers mark minimal value to maximal value (ac). ****P < 0.0001, ***P < 0.001, **P < 0.01, *P < 0.05 (ad). The sample size (n) corresponds to the number of biological replicates (ad).
Fig. 3 |
Fig. 3 |. RCAN1 KD- and CaN KD-induced chromatin changes.
a, Quantification of caspase 3/7 activation (left, n = 18, 15, 13, 17, 10) and annexin V signal (right, n = 18, 14, 15, 15, 16) in four independent HD-MSNs (HD43, HD40, HD47, HD45) transduced with shCtrl, shRCAN1, RCAN1 or shCaN. Cells were also treated with 10 μM CsA, a CaN inhibitor. In box-and-whisker plots, the center line denotes the median value, while the box contains the 25th to 75th percentiles of the dataset. The whiskers mark minimal value to maximal value. *P = 0.0175, ****P < 0.0001. b, Representative images (left) and quantification (right) of cells with HTT IBs in three independent HD-MSNs (HD.43, HD.40, HD.47; n = 3) transduced with shCtrl, shRCAN1 or shCaN. Cells were treated with 10 μM CsA. Cells were immunostained with anti-HTT and TUBB3 antibodies. An average of 117 cells each were counted from three or more randomly chosen fields. Scale bars, 20 μm. Mean ± s.e.m. shCtrl versus shRCAN1 ***P = 0.0002; shRCAN1 versus shRCAN1+shCaN ***P = 0.0003, ****P < 0.0001. ce, Analysis of ATAC-seq from four independent HD-MSNs (HD43, HD40, HD47, HD45; three replicates each) transduced with shCtrl (control), shRCAN1 (rescuing) or shCaN (detrimental). c, Heatmaps of signal intensity in overlapping chromatin peaks of open DAR (FDR < 0.05, FC ≥ 1.5) in shRCAN1-HD-MSNs and closed DAR (FDR < 0.05, FC ≤ −1.5) in shCaN-HD-MSNs compared with shCtrl-HD-MSNs. d,e, KEGG pathway enrichment analysis (d) and pathway enrichment analysis (e) of genes associated with open DARs in shRCAN1-HD-MSNs and closed DARs in shCaN-HD-MSNs in c. Statistical significance was determined using one-way ANOVA with Tukey’s post hoc test in a and b; ****P < 0.0001, ***P < 0.001, *P < 0.05 (a,b). The sample size (n) corresponds to the number of biologically independent samples (a,b).
Fig. 4 |
Fig. 4 |. Enhancing TFEB function by RCAN1 KD via its nuclear localization.
a, Heatmap representation of open DARs with shRCAN1 (rescuing) and closed DARs with shCaN (detrimental) harboring TFEB binding motifs, compared with shCtrl. Motif analysis from ATAC-seq was from four independent HD-MSNs (HD.43, HD.40, HD.47, HD.45; three biologically independent samples each) (FDR < 0.05, FC ≥ 1.5). Top legend depicts representative motifs for TFEB binding sites. b, KEGG pathway enrichment analysis (top) of TFEB binding motif-containing genes associated with DARs in a. Integrative Genomics Viewer snapshots (bottom) showing peaks enriched in shRCAN1-HD-MSNs (red) and reduced in shCaN-HD-MSNs (blue) within RB1CC1 and MAPK1 in comparison with shCtrl (gray). c, Representative immunoblotting (left) and quantification (right) of the expression of phosphor-TFEB (Ser142) from three independent HD-MSNs (HD.43, HD.40, HD.47; n = 3) transduced with shCtrl, shRCAN1 or RCAN1. Phosphor-TFEB (Ser142): **P = 0.0095, *P = 0.0495; P62: shCtrl versus shRCAN1 *P = 0.0497, shRCAN1 versus shRCAN1&RCAN1 cDNA *P = 0.0496; RCAN1: shCtrl versus shRCAN1 **P = 0.0023, shRCAN1 versus shRCAN1&RCAN1 cDNA **P = 0.0034. d, Representative image (left) and quantification (right) of nuclear TFEB from three independent HD-MSNs (HD.43, HD.40, HD.47) transduced with TFEB WT, shRCAN1 or TFEB phosphor-mutant (S142/211A (SA)). Cells were immunostained with anti-TFEB and TUBB3 antibodies. An average of 130 cells each were counted from three or more randomly chosen fields (n = 6, 3, 3). Scale bars, 20 μm. Statistical significance was determined using one-way ANOVA with Tukey’s post hoc test in c and d; ****P < 0.0001, **P < 0.01, *P < 0.05 and mean ± s.e.m. (c,d). The sample size (n) corresponds to the number of biologically independent samples (c,d).
Fig. 5 |
Fig. 5 |. RCAN1 KD promotes neuronal resilience through enhancing TFEB nuclear localization.
a, Representative images (left) and quantification (right) of CYTO-ID-positive cells from three independent HD-MSNs (HD.43, HD.40, HD.47) transduced with shCtrl, shRCAN1 or RCAN1 (n = 9, 9, 7). shCtrl versus shRCAN1 *P = 0.0103, shRCAN1 versus shRCAN1&RCAN1 cDNA *P = 0.0406. Scale bars, 20 μm. b, Immunoblotting (top) and quantification (bottom) of the expression of p62 (**P = 0.0027) and RCAN1 (**P = 0.0021) from three independent HD-MSNs (HD.43, HD.40, HD.47) transduced with shCtrl or shRCAN1 (n = 3). c, Autophagic flux measurements using tandem monomeric mCherry-GFP-LC3 (right top). Representative image (left) and quantification (right bottom) of autophagosome and autolysosome from cells having reporter signal puncta from three independent HD-MSNs (HD.43, HD.40, HD.47) transduced with shCtrl, shRCAN1 or RCAN1 (n = 6, 5, 5). **P = 0.0012, *P = 0.0132, ***P = 0.0002, ****P < 0.0001. d, Representative image (left) and quantification (right) of autophagosome and autolysosome from cells having puncta from three independent HD-MSNs (HD.43, HD.40, HD.47) transduced with TFEB WT, shRCAN1 or TFEB Phosphor-mutant (SA) (n = 3). Autophagosome *P = 0.0106, **P = 0.0060; autolysosome **P = 0.0014, ***P = 0.0006. e, Quantification of caspase 3/7 activation (left, n = 9, 8, 9) and annexin V signal (right, n = 12, 10, 12) from three independent HD-MSNs (HD.40, HD.43, HD.47) transduced with TFEB WT, shRCAN1 or TFEB SA. Caspase 3/7 activation: TFEB WT versus TFEB SA **P = 0.0028; TFEB WT + shRCAN1 versus TFEB SA **P = 0.0026, TFEB WT versus TFEB WT + shRCAN1 ****P < 0.0001. f, Representative images (left) and quantification (right) of HTT IBs from four independent HD-MSNs (HD.47, HD.40, HD.43, HD.45) transduced with TFEB WT, shRCAN1 or TFEB SA. Cells were immunostained with anti-HTT and TUBB3 antibodies. An average of 120 cells each were counted from three or more randomly chosen fields (n = 4). ***P = 0.0001, ****P < 0.0001. Scale bars, 10 μm (c,d,f). Statistical significance was determined using one-way ANOVA with Tukey’s post hoc test (a,c,d,e,f) and two-tailed unpaired t-test (b); ****P < 0.0001, ***P < 0.001, **P < 0.01, *P < 0.05, NS, not significant (af) and mean ± s.e.m. (b,c,d,f). In box-and-whisker plots, the center line denotes the median value, while the box contains the 25th to 75th percentiles of the dataset. The whiskers mark minimal value to maximal value (a,e). The sample size (n) corresponds to the number of biologically independent samples (af).
Fig. 6 |
Fig. 6 |. G2–115 promotes TFEB function by reducing RCAN1–CaN interaction and promoting TFEB nuclear localization.
a,b, Immunoblotting of fibroblasts treated with DMSO, G2–115 (0.5 μM), metformin (8 mM), carbamazepine (100 μM) and rapamycin (500 nM) (a) and HD-MSNs (HD.47, HD.40, HD.45) treated with DMSO and G2–115 (0.5 μM) (n = 3, **P = 0.0013) (b) with anti-phosphor-TFEB (Ser142). c, Immunoprecipitation of Flag-RCAN1-transfected HEK293 cells with anti-Flag followed by CaN immunoblotting after G2–115 (0.25; 0.5; 2.5; 5 μM) treatment. d, Immunoprecipitation of chloroquine (lysosome inhibitor)-treated fibroblasts with anti-CaN followed by RCAN1 immunoblotting after DMSO, G2–115 (0.5 μM) and chloroquine (60 μM) treatment. e, Experimental scheme of NanoBit binding assay (top). Binding assay of HEK293 cells transfected with RCAN1-large-Bit and CaN-small-Bit (bottom) after G2–115 (2.0 μM), metformin (8 mM), carbamazepine (100 μM) and rapamycin (500 nM) treatment (n = 3 independent experiments). DMSO versus G2–115: 0.5 h **P = 0.0041; 1.0 h **P = 0.0037; 1.5 h **P = 0.0016; 2.0 h *P = 0.0111. f, Representative image (left) and quantification (right) of nuclear TFEB in HD-MSNs (HD.43, HD.45, HD.40) treated with DMSO and G2–115 (0.5 μM) (n = 3, *P = 0.0380). Scale bars, 20 μm. g, Representative images (left) of control and RCAN1-transduced HD-MSNs expressing the tandem monomeric mCherry-GFP-LC3 reporter. Quantification (right) of autophagosomes and autolysosomes from HD-MSNs with puncta (HD.40, HD.47, HD.43; n = 3; ****P < 0.0001; more than 50 cells per line) treated with DMSO and G2–115 (0.5 μM). Scale bars, 20 μm. h, Quantification of caspase 3/7 activation (top) from HD-MSNs (HD.40, HD.47, HD.45; n = 11) and annexin V signal (bottom) from HD-MSNs (HD.43, HD.47, HD.45; n = 15, 13, 10) treated with DMSO and G2–115 (0.5 μM) after control and RCAN1 transduction. In box-and-whisker plots, the center line denotes the median value, while the box contains the 25th to 75th percentiles of the dataset. The whiskers mark minimal value to maximal value. ****P < 0.0001, ***P = 0.0009, **P = 0.0028. i, Representative image (left) and quantification (right) of HTT IBs in control and RCAN1-transduced HD-MSNs (HD.43, HD.40, HD.47) treated with DMSO and G2–115 (0.5 μM) (n = 3; **P = 0.0015, ***P = 0.0005) followed by HTT and TUBB3 staining. An average of 300 cells were counted from three or more randomly chosen fields. Scale bars, 10 μm. Statistical significance was determined using one-way ANOVA with Tukey’s post hoc test (g,h,i) and two-tailed unpaired t-test (b,e,f); ****P < 0.0001, ***P < 0.001, **P < 0.01, *P < 0.05, NS, not significant, and mean ± s.e.m. (b,e,f,g,i). Sample size (n): number of biologically independent samples (b,f,g,h,i). IP, immunoprecipitation.

Update of

References

    1. Wyss-Coray T Ageing, neurodegeneration and brain rejuvenation. Nature 539, 180–186 (2016). - PMC - PubMed
    1. Rose MR Adaptation, aging, and genomic information. Aging (Albany NY) 1, 444–450 (2009). - PMC - PubMed
    1. Machiela E & Southwell AL Biological aging and the cellular pathogenesis of Huntington’s disease. J. Huntingtons Dis. 9, 115–128 (2020). - PMC - PubMed
    1. Niccoli T & Partridge L Ageing as a risk factor for disease. Curr. Biol. 22, R741–752 (2012). - PubMed
    1. Hou Y et al. Ageing as a risk factor for neurodegenerative disease. Nat. Rev. Neurol. 15, 565–581 (2019). - PubMed

MeSH terms