. 2024 Jan;9(1):120-135.
doi: 10.1038/s41564-023-01523-7. Epub 2023 Dec 8.

BACH1 promotes tissue necrosis and Mycobacterium tuberculosis susceptibility

Affiliations

BACH1 promotes tissue necrosis and Mycobacterium tuberculosis susceptibility

Eduardo P Amaral et al. Nat Microbiol. 2024 Jan.

Abstract

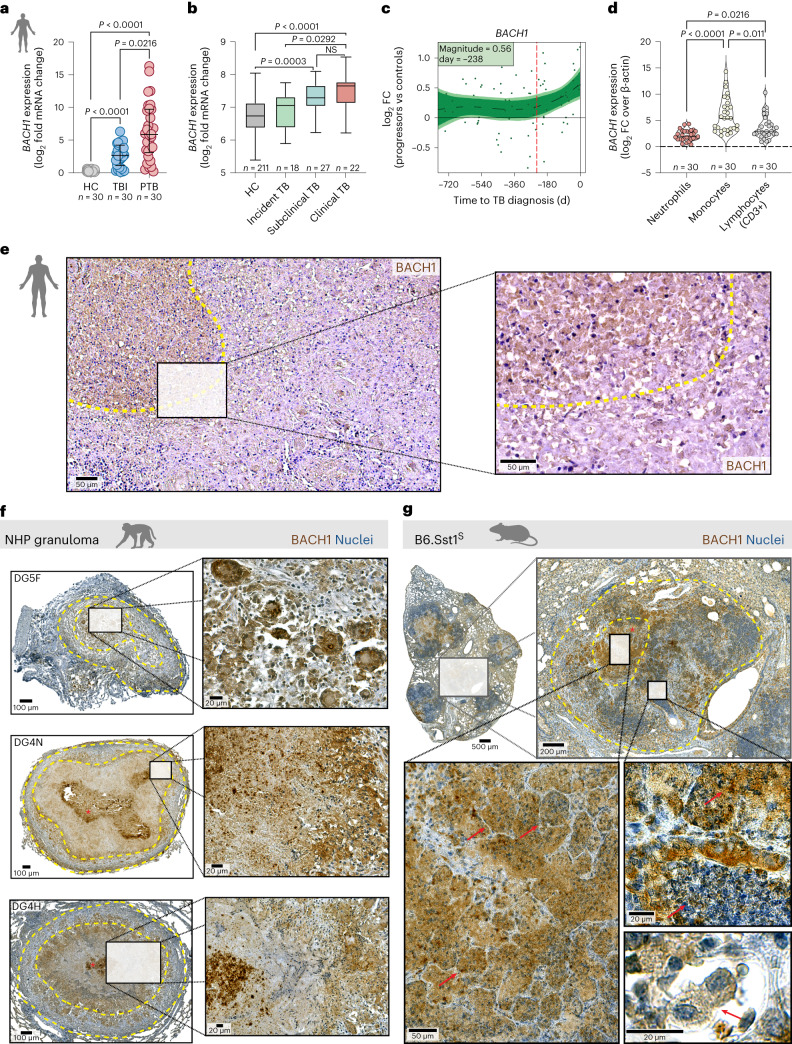
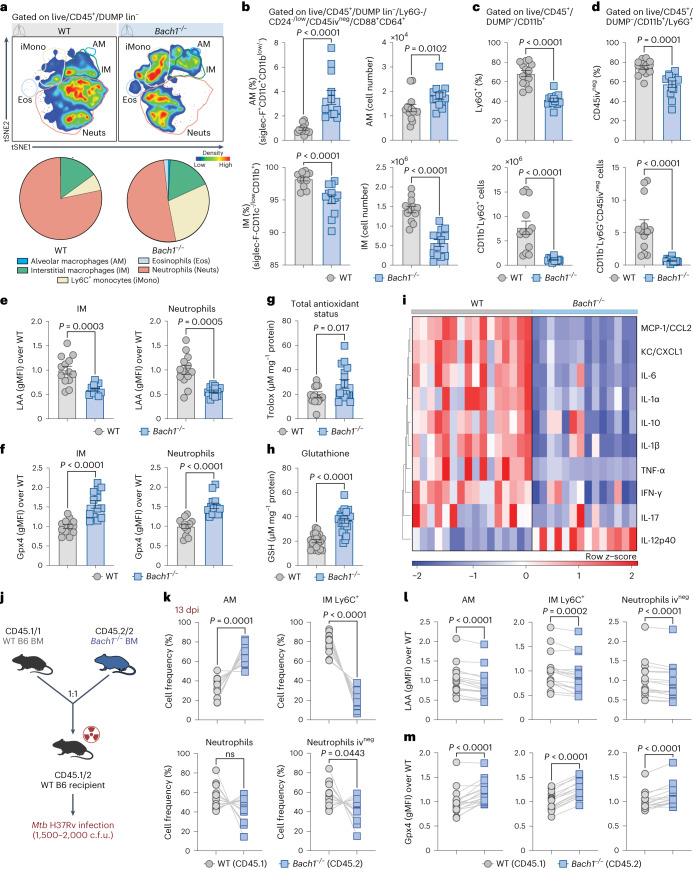
Oxidative stress triggers ferroptosis, a form of cellular necrosis characterized by iron-dependent lipid peroxidation, and has been implicated in Mycobacterium tuberculosis (Mtb) pathogenesis. We investigated whether Bach1, a transcription factor that represses multiple antioxidant genes, regulates host resistance to Mtb. We found that BACH1 expression is associated clinically with active pulmonary tuberculosis. Bach1 deletion in Mtb-infected mice increased glutathione levels and Gpx4 expression that inhibit lipid peroxidation. Bach1-/- macrophages exhibited increased resistance to Mtb-induced cell death, while Mtb-infected Bach1-deficient mice displayed reduced bacterial loads, pulmonary necrosis and lipid peroxidation concurrent with increased survival. Single-cell RNA-seq analysis of lungs from Mtb-infected Bach1-/- mice revealed an enrichment of genes associated with ferroptosis suppression. Bach1 depletion in Mtb-infected B6.Sst1S mice that display human-like necrotic lung pathology also markedly reduced necrosis and increased host resistance. These findings identify Bach1 as a key regulator of cellular and tissue necrosis and host resistance in Mtb infection.


Conflict of interest statement

The authors declare no competing interests.

Figures

Fig. 1
Fig. 1. BACH1 expression is elevated in patients displaying active disease and is associated with pulmonary necrosis in animal models of TB.
a,d, Plasma samples collected from PTB (n = 30), TBI (n = 30) and HC (n = 30) patients from a Brazilian cohort. a, BACH1 mRNA expression in CD14+ monocytes (HC vs TBI, P < 0.0001; HC vs PTB, P < 0.0001; TBI vs PTB, P = 0.0216). b, BACH1 mRNA expression in total PBMC isolated from patients from a South African cohort. c, log2 fold change (FC) of BACH1 mRNA expression in peripheral blood over time between bin-matched progressors (n = 44) and controls (n = 106) and modelled as nonlinear splines (black dashed line). Progressors are represented by light shading denoting 99% confidence interval (CI) and dark shading denoting 95% CI temporal trends. Dashed vertical line indicates the deviation time (day −238) calculated as the timepoint at which the 99% CI deviates from a log2 FC of 0. d, BACH1 mRNA expression in sorted neutrophils, monocytes and lymphocytes from PTB patients (n = 29) (neutrophils vs monocytes, P < 0.0001; neutrophils vs lymphocytes, P = 0.0216; monocytes vs lymphocytes, P = 0.011). e, BACH1 staining in a post-mortem PTB patient lung section. Yellow dashed lines delineate area surrounding necrotic zone within the granuloma. Data represent median values and interquartile ranges. Statistical significance was determined using a two-sided Kruskal–Wallis test with post-hoc Dunn’s test for multiple comparisons. Boxplots shown in b represent median (centre line), upper and lower quartiles (box limits) and the interquartile range (whiskers). Data shown in ad are presented as mean ± s.e.m. and each symbol denotes an individual patient. NS, not significant. f, BACH1 staining in lung sections from 3 rhesus macaques. The top left panel shows a cellular granuloma (delineated by yellow dashed line); middle and bottom left panels show necrotic granulomas (delineated by yellow dashed line) with the necrotic core outlined by yellow dashed line and highlighted by an asterisk. g, Representative lung sections from Mtb-infected B6.Sst1S mice stained for Bach1. Dashed lines delineate the granuloma and asterisk indicates necrotic areas within the lesion. Red arrow points out cells resembling alveolar macrophages. Images shown are representative of those observed in 5 individual animals from 2 experiments. Source data
Fig. 2
Fig. 2. Bach1 deficiency enhances host resistance to experimental Mtb infection correlating with decreased bacterial loads and tissue necrosis.
ai, Bach1−/− and WT mice were aerosol infected with H37Rv Mtb at low dose (~100–250 c.f.u; ac) or high dose (~1,000–2,000 c.f.u; di) by IPH inoculation as described in Methods. a,d, Survival curves (WT vs Bach1−/− in a, P = 0.0005; WT vs Bach1−/− in d, P < 0.0001; Mantel–Cox test) and b,e, body weight of Mtb-infected Bach1−/− and WT mice (data pooled from three independent experiments; WT vs Bach1−/− in e, P < 0.0001, two-way ANOVA). c, Mice infected at low-dose Mtb were euthanized at 30 and 120 dpi and pulmonary bacterial loads were evaluated (data pooled from 2 experiments; WT vs Bach1−/− for 120-day time-point, P = 0.0002, two-tailed, Mann–Whitney U-test). f, Bacterial loads in the lungs and spleens of mice infected at high-dose Mtb assayed at 28 dpi (data pooled from 6 separate experiments; WT vs Bach1−/− in lungs P < 0.0001 and in spleens P < 0.0001, two-tailed, Mann–Whitney U-test). g, Lung necrosis evaluated by SytoxGreen DNA staining. h, MFI of SytoxGreen staining per area of whole lung samples. Pooled results of 3 independent experiments are shown (WT, n = 23 vs Bach1−/− n = 18; P < 0.0001, two-tailed, Mann–Whitney U-test). i, Representative hematoxylin-eosin (H&E) (purple) and Ziehl-Neelsen (ZN) (blue) images of lungs isolated from Bach1−/− (bottom) and WT mice (top). Each image is representative of tissue sections from at least 5 individual mice per experiment. Mtb-infected WT mice displayed extensive necrotic lesions (yellow dashed line and asterisk) with intrabronchial accumulation of necrotic cellular material (red arrow) presenting elevated numbers of acid-fast bacilli (inset). On the bottom panel, reduced areas of inflammation and necrosis along with few AFB per cell (insets) were observed in lungs of Bach1−/− mice. j, Parenchymal enlargement (P < 0.0001, two-tailed, Mann–Whitney U-test) and k, TB lesion areas (P < 0.0001, two-tailed, Mann–Whitney U-test) were measured in the lung sections. j,k, Pooled results from two independent experiments (n = 11 per group). The data shown in af, h, j and k are presented as mean ± s.e.m. of samples. Source data
Fig. 3
Fig. 3. The effects of Bach1 expression on pulmonary inflammation is reflected in the modulation of the cell-intrinsic oxidative response.
ai, Bach1−/− and WT mice were infected at high-dose Mtb and euthanized at 28 dpi. a, tSNE analysis of myeloid cells in the lungs of Mtb-infected mice (n = 5 per group). b, Frequencies and numbers of AM (Live/CD45+/DUMP-/Ly6G/CD45ivneg/CD88+CD64+/CD11b−/low/CD11c+/Siglec-F+), IM (Live/CD45+/DUMP/Ly6G/CD45ivneg/CD88+/CD64+/CD11bhi/CD11c-/low/Siglec-F) (two-tailed, Mann–Whitney U-test), c, total neutrophils (Live/CD45+/DUMP/CD11b+Ly6G+) (two-tailed Mann–Whitney U-test) and d, parenchymal neutrophils (Live/CD45+/DUMP/CD11b+Ly6G+/CD45iv) (two-tailed Mann–Whitney U-test) were enumerated; DUMP: TCRβ, TCRγδ, NK1.1, B220. e, Lipid peroxidation (LAA staining) (two-tailed Mann–Whitney U-test) and f, Gpx4 levels (over the average MFI of the WT) (two-tailed Mann–Whitney U-test) in live IM and neutrophils. bf, Pooled data from 3 independent experiments are shown (WT n = 13 vs Bach1−/− n = 12). g, Total antioxidant status (n = 16 per group, pooled from 3 experiments; two-tailed Mann–Whitney U-test). h, Glutathione measured in lung homogenates (WT n = 20 vs Bach1−/− n = 22, pooled from 4 experiments; two-tailed Mann–Whitney U-test). i, Heatmap visualization of 10 cytokines/chemokines measured in lung homogenates. Pooled data from 3 independent experiments are shown (WT n = 16 vs Bach1−/− n = 14). j, Schematic of mixed BM chimaeric protocol. Mice were euthanized at 13 dpi. k, Analysis of cell frequency (two-tailed Wilcoxon-matched pairs), l, lipid peroxidation (two-tailed Wilcoxon-matched pairs) and m, Gpx4 expression (two-tailed Wilcoxon-matched pairs) in AM, IM and neutrophil populations in the lungs of Mtb-infected mixed (WT/Bach1−/−) BM chimaeras. Results shown are pooled from 2 independent experiments (n = 15 per group; Wilcoxon-matched pairs). Data shown in bm are presented as mean ± s.e.m. and each symbol represents an individual animal. Source data
Fig. 4
Fig. 4. Pulmonary cell populations from Bach1-deficient mice display enriched expression of genes associated with inhibition/suppression of ferroptosis (FRG).
Bach1−/− and WT mice were infected at high dose with Mtb. Mice were euthanized at 23 dpi and single-cell suspensions from lungs were prepared for analysis (n = 5 per group, samples pooled from 1 experiment). a, UMAP plot representing the clustering pattern of cells from scRNA-seq data of single-cell suspensions from lungs of Mtb-infected animals. Each dot denotes a single cell and is coloured on the basis of the automated cluster identification. Clusters of cells belonging to a certain cell type are demarcated and indicated on the plot. b, UMAP comparing cells from Mtb-infected WT (left) and Bach1−/− (right) mice lungs. c, Percent of cells from each cluster found in Mtb-infected Bach1−/− and WT mice. d, UMAP plot showing Bach1 expression in the cluster of cells identified. e, List of FRG used to assess expression of genes associated with the induction (left) or inhibition/suppression (right) of ferroptotic cell death. f, Violin plot of FRG expression in different cell clusters in Bach1−/− and WT mice. The statistical differences between WT and Bach1−/− mice for each cluster were calculated using two-tailed Wilcoxon test, with cut-off at P < 0.001. Source data
Fig. 5
Fig. 5. Bach1 deficiency in the hypernecrotic B6.Sst1S murine model of Mtb infection enhances host antioxidant and reduces lung pro-inflammatory responses.
ac, B6.Sst1S and B6.Sst1SBach1−/− mice were infected at low dose with Mtb. Mice were euthanized at 17 dpi and single-cell suspensions from lungs were isolated from Mtb-infected and uninfected animals for RNA-seq analysis (n = 3–4 per group, samples obtained from 1 experiment). a, Volcano plots from DEGs identified. The comparison betweengroups is indicated. Differentially expressed genes are represented in red, genes with log2FC > 1.4 and <- 1.4 are in green, genes with FDR < 0.05 are in blue and genes that are not significant are in grey. b, Enrichment analysis plots displaying the augmented pathways from the identified DEGs in the comparisons as indicated. Dot sizes represent the gene ratio in the pathway, fill colours are the FDR values. c, Heat map of FRG DEGs associated with induction (top) and suppression (bottom) of ferroptosis identified in the Mtb-infected and uninfected B6.Sst1S and B6.Sst1SBach1−/− mice. Coloured row at the top of each panel corresponds to groups of mice analysed. d, Total antioxidant status (B6.Sst1S n = 14 vs B6.Sst1SBach1−/− n = 17; two-tailed Mann–Whitney U-test), e, GSH (B6.Sst1S n = 15 vs B6.Sst1SBach1−/− n = 16; two-tailed Mann–Whitney U-test) and f, MDA levels (B6.Sst1S n = 13 vs B6.Sst1SBach1−/− n = 16; two-tailed Mann–Whitney U-test) measured in lung homogenates from Mtb-infected mice at 35 dpi. Pooled data from 3 independent experiments are shown and each dot denotes an individual animal. g, Heat map visualization of 10 cytokines/chemokines measured in lung homogenates from Mtb-infected B6.Sst1S (n = 15) and B6.Sst1SBach1−/− (n = 17) mice (pooled from 3 independent experiments). Data shown in df are presented as mean ± s.e.m. Statistical significance was assessed using the Mann–Whitney test for the indicated experimental conditions. Source data
Fig. 6
Fig. 6. B6.Sst1SBach1−/− mice exhibit enhanced host resistance to Mtb infection.
ae, B6.Sst1S and B6.Sst1SBach1−/− mice were infected at low dose with Mtb. a, Survival curves of Mtb-infected B6.Sst1S (n = 44) and B6.Sst1SBach1−/− (n = 33) mice. Data pooled from 4 independent experiments (P < 0.0001, Mantel–Cox test). b, C.f.u.s determined at 35 dpi by plating lung and spleen homogenates onto 7H11 agar plates. Results are pooled from 3 separate experiments (WT n = 15 vs Bach1−/− n = 18 for lungs and WT n = 10 vs Bach1−/− n = 10 for spleens; two-tailed Mann–Whitney U-test). c, Representative H&E (purple) and ZN (blue) images of lungs from B6.Sst1S (top) and B6.Sst1SBach1−/− (bottom) mice. Each image is a composite of sections from 4–6 individual mice per group per experiment (n = 13–16 total, 3 experiments performed; two-tailed Mann–Whitney U-test). As indicated, B6.Sst1S mice exhibited massive necrotic tissue damage (asterisk) with intrabronchial and intra-alveolar (arrow) accumulation of necrotic cellular material. B6.Sst1SBach1−/− mice also showed markedly reduced tissue necrosis (arrow). d,e, Parenchymal enlargement (d) and TB lesion areas (e) as measured in the lung sections. Data pooled from 3 independent experiments (B6.Sst1S n = 16 vs B6.Sst1SBach1−/− n = 13; two-tailed Mann–Whitney U-test). Data shown in a, b, d and e represent mean ±s.e.m. Source data
Extended Data Fig. 1
Extended Data Fig. 1. Publicly available data supporting the association of BACH1 expression with TB disease in infected patients and in a murine model of Mtb-induced pulmonary necrosis.
RNAseq data from an available data set previously published by Moreira-Teixeira et al. 2020 were re-analyzed. (A) BACH1 mRNA expression was assessed in TBI and PTB patients (TBI (n = 21) vs PTB (n = 21) London cohort, P = 0.0037; TBI (n = 31) vs PTB (n = 16) South Africa cohort P < 0.0001; two-tailed, Mann–Whitney U-test) from two different cohorts (London and South Africa cohorts). Each dot denotes a single patient analyzed and the data shown represent the means ± SEM of the pooled samples for each group. (B-C) C3HeB/FeJ mice (n = 5 for each group) were aerosol infected with H37Rv Mtb at different doses (low-dose and high-dose) and RNAseq analysis performed in lung homogenates and blood at 42 p.i. Each symbol represents an individual animal within the group and data shown are from one experiment performed. (B) mRNA expression of Bach1 in the lungs of Mtb-infected and uninfected animals (control vs low, P < 0.0001; control vs high, P = 0.008; one-way ANOVA). (C) Paired comparison of Bach1 mRNA expression in the lungs and blood samples from the same animal (P = 0.0079, two-tailed, Mann–Whitney U-test). (D) Representative lung tissue sections from C57BL/6 mice (n = 7) infected with H37Rv Mtb strain at high-dose (~1500-2000 c.f.u) and euthanized 26 days later. The sections were stained for Bach1. Strong staining (brown) for Bach1 was observed in inflamed areas in the lungs from these animals. The images shown are representative of those observed in 7 individual animals from one experiment performed. (ns, not significant). Source data
Extended Data Fig. 2
Extended Data Fig. 2. Gating strategies for identifying granulocyte and myeloid cells by flow cytometry as well as cytokine/chemokine production in lungs.
Single-cell suspensions were prepared from the lungs of naïve animals i.v. injected with labeled panCD45 antibody prior euthanasia to identify cells located within the lung vasculature. Gating strategy was used to identify myeloid populations in Mtb-infected lungs. *DUMP: TCRβ, TCRγδ, NK1.1, B220; AM, alveolar macrophages, IM, interstitial macrophages; Eos, eosinophils; Neuts, neutrophils; Neuts iv-, parenchymal neutrophils. Anti-Siglec-F antibody was added to the panel in the same channel as the DUMP makers and analyzed in combination with F4/80 to isolate AM and EOS out from DUMP+ cells as showed in the FACS plot. (B-D) Sample FACS plot of (B) parenchymal macrophages gated on Live/CD45+/DUMP/Ly6G/CD45ivneg/F4/80+CD64+ events, (C) total neutrophils (gated on Live/CD45+/DUMP/CD11b+Ly6G+) and (D) parenchymal neutrophils (gated on Live/CD45+/DUMP/CD11b+Ly6G+/CD45ivneg) shown in the Fig. 3b,c. (E) Summary data of cytokine/chemokine levels in lung homogenates from Mtbinfected Bach1-/- (n = 23) and WT (n = 26) at 28 days p.i. (pooled from five independent experiments; two-tailed, Mann–Whitney U-test). (F) Sample FACS plot of CD45.1 (WT) vs CD45.2 (KO) within AM, Ly6C+ IM, total and parenchymal neutrophils shown in the Fig. 3k–m. (G) Sample gating strategy used for the in vitro experiments with BMDMs. FACS plots shown in A-D and F-G are representative of at least two independent experiments performed. Each symbol represents an individual animal within the group. Significant differences are indicated with asterisks (ns, not significant). Source data
Extended Data Fig. 3
Extended Data Fig. 3. Bach1 deficiency does not affect numbers of myeloid cells in the lungs of mice at baseline.
(AC) Total numbers of (A) AMs (Live/CD45ivneg/F4/80+CD64+/CD11b-/CD11c+/Siglec-F+), (B) IMs (Live/CD45ivneg/ F4/80+CD64+/CD11bhi/CD11c-/l°w/Siglec-F-), and (C) neutrophils (Live/CD45+/DUMP/CD11b+Ly6G+) in the lungs of uninfected Bach1-/- and WT mice as measured by flow cytometry. Results are pooled from of three independent experiments performed (WT n = 10 vs Bach1-/- n = 9) and the data shown are presented as mean values ± SEM of the pooled samples for each group. Each symbol represents an individual animal from each group. Statistical significance was assessed by the Mann-Whitney test, two-tailed. (ns, not significant). Source data
Extended Data Fig. 4
Extended Data Fig. 4. UMAP showing the expression of genes used to identify the different cell population clusters in the scRNA-seq dataset.
Expression levels of cell type defining markers are shown as blue dots overlapping the original UMAP used to determine the clusters of cells (n = 5, each group; samples pooled from one experiment). Source data
Extended Data Fig. 5
Extended Data Fig. 5. Bach1 expression in different cell population clusters in the scRNA-seq dataset.
Violin plot of Bach1 expression in different cell clusters in Bach1-/- and WT mice. (n = 5, each group; samples pooled from one experiment). Source data
Extended Data Fig. 6
Extended Data Fig. 6. Bach1-deficient mice exhibit increased expression of antioxidant genes associated with iron and glutathione metabolism.
Volcano plot of the differentially expressed genes between Bach1-/- and WT AM (cluster 15), neutrophil (clusters 4, 5 and 17) and macrophage/monocyte populations (cluster 1, 2, 6, 8, 9, 16, 18) are shown (n = 5, each group; samples pooled from one experiment). Vertical and horizontal red lines indicate log fold change ≥ 0.5 and p-ad value < 0.05 respectively. Positive-fold change indicates higher expression in Bach1-/- relative to WT. Statistical significance in was calculated with the Wilcoxon Rank-Sum test. Source data
Extended Data Fig. 7
Extended Data Fig. 7. Cell death measurement of BMDM infected with Mtb at low MOI.
Bach1-/- and WT BMDMs were infected with H37Rv Mtb at an MOI of 1. (A) Sample FACS plots demonstrating Mtb-induced macrophage necrosis in vitro as measured by Live/Dead staining on the X axis at day 4 p.i. (B) Summary graph of data shown in A. The data represent means ± SEM of triplicate samples and are representative of two independent experiments. Statistical significance was assessed by one-way ANOVA for the indicated experimental conditions. (ns, not significant). Source data
Extended Data Fig. 8
Extended Data Fig. 8. Bach1 deficiency suppresses Mtb-induced macrophage necrosis by enhancing the cellular antioxidant response.
A-F) Bach1-/- and WT BMDMs were infected with H37Rv Mtb at an MOI of 10. (A) Sample FACS plots demonstrating Mtb-induced macrophage necrosis in vitro as measured by Live/Dead staining on the X axis at day 1 versus day 4 p.i. (B) Summary graph of data shown in A presenting the means ± SEM of triplicate samples analyzed. (C) Mitochondrial superoxide (measured by MitoSOX staining), (D) lipid peroxidation (evaluated by LAA staining) and (E) Gpx4 protein expression analyzed in live CD11b+ cells by flow cytometry. (F) Intracellular GSH levels measured on day 1 p.i. The data represent means ± SEM of triplicate samples and are representative of at least two independent experiments. Statistical significance was assessed by one-way ANOVA for the indicated experimental conditions. Source data
Extended Data Fig. 9
Extended Data Fig. 9. Evaluation of cell death in Mtb-infected and bystander BMDM at an MOI of 10.
Bach1-/- and WT BMDMs were infected with RFP-labeled H37Rv (H37Rv-RFP) Mtb at an MOI of 10 and cell death, lipid peroxidation and Gpx4 expression assessed at day 1 p.i. (A) Frequencies of Mtb-infected (Mtbp°s) and bystander (Mtbneg) BMDMs. (B) Frequency of Live/Deadhigh cells within total CD11b+ cells. (C) Lipid peroxidation (evaluated by LAA staining) and (D) Gpx4 protein expression analyzed by flow cytometry. The data represent means ± SEM of triplicate samples and are representative of two independent experiments. Statistical significance was assessed by one-way ANOVA for the indicated experimental conditions. (ns, not significant). Source data
Extended Data Fig. 10
Extended Data Fig. 10. Transcriptional and inflammatory profiles of the lungs in B6.Sst1S and B6.Sst1SBach1-/- mice.
(A-E) B6.Sst1S and B6.Sst1SBach1-/- mice were infected at low-dose with Mtb. Mice were euthanized at 17 days p.i. and single-cell suspensions from lungs were isolated from Mtb-infected and uninfected animals for RNAseq analysis (n = 3-4, each group; samples from one experiment). (A) Heatmap displaying the DEGs identified for each group analyzed. (B) Venn diagram plot from the identified DEGs with the corresponding comparisons. (C) Molecular degree of perturbation (MDP) plot displaying values as bars for each group. Boxplots shows median (centre line), upper and lower quartiles (box limits) and the interquartile range (whiskers). Each symbol represents an individual animal within the group (n = 3-4, each group) and data shown are from one experiment performed. (D) Bacterial loads in the lungs from B6.Sst1S and B6.Sst1SBach1-/- mice at 17 days p.i. (E) Correlation between MDP values and bacterial counts in the lung from Scatter plot summarizing the MDP and CFU values from B6.Sst1S and B6.Sst1SBach1-/- mice at 17 days p.i. (F) Summary data of cytokine/chemokine levels in lung homogenates from B6.Sst1S and B6.Sst1SBach1-/- mice at 35 days p.i. shown in the Fig. 5G. (B6.Sst1S n = 15 vs B6.Sst1SBach1-/- n = 17, pooled from three independent experiments). (G) tSNE analysis of the myeloid cells in the lungs of Mtb infected mice at 17 and 35 days p.i. Proportional events from each animal were concatenated (n = 4-5 each group; samples from one experiment). AM (dark blue gate), IM (green gate), neutrophils (red gate), parenchymal neutrophils (orange gate), DCs (purple and light blue gate) and inflammatory monocytes (yellow gate) are indicated in the tSNE plot and the proportion of each cell population cells is shown (bottom). The data shown in D-F are presented as mean values ± SEM of the pooled samples for each group. Statistical significance was assessed by two-tailed, Mann–Whitney test for the indicated experimental conditions. (ns, not significant). Source data

References

    1. Global Tuberculosis Report (World Health Organization, 2022).
    1. Cohen, S. B. et al. Alveolar macrophages provide an early Mycobacterium tuberculosis niche and initiate dissemination. Cell Host Microbe24, 439–446 (2018). - PMC - PubMed
    1. Rothchild, A. C. et al. Alveolar macrophages generate a noncanonical NRF2-driven transcriptional response to Mycobacterium tuberculosis in vivo. Sci. Immunol. 4, eaaw6693 (2019). - PMC - PubMed
    1. Flynn JL, Chan J. Immune cell interactions in tuberculosis. Cell. 2022;185:4682–4702. doi: 10.1016/j.cell.2022.10.025. - DOI - PubMed
    1. Lee J, Repasy T, Papavinasasundaram K, Sassetti C, Kornfeld H. Mycobacterium tuberculosis induces an atypical cell death mode to escape from infected macrophages. PLoS ONE. 2011;6:e18367. doi: 10.1371/journal.pone.0018367. - DOI - PMC - PubMed

Substances