. 2023 Dec 8;24(1):953.
doi: 10.1186/s12891-023-07084-4.

Exploring biomarkers associated with severity of knee osteoarthritis in Southern China using widely targeted metabolomics

Affiliations

Exploring biomarkers associated with severity of knee osteoarthritis in Southern China using widely targeted metabolomics

Xiaochao Wang et al. BMC Musculoskelet Disord. .

Abstract

Background: Metabolomics is a tool to study the pathogenesis of diseases and their associated metabolites, but there are still insufficient metabolomic studies on severe knee osteoarthritis.To investigate the differences in serum metabolites between healthy populations and knee osteoarthritis (KOA) patients in Southern China using widely targeted metabolomics, and to explore biomarkers and their metabolic pathways that could be associated with the severity of KOA.

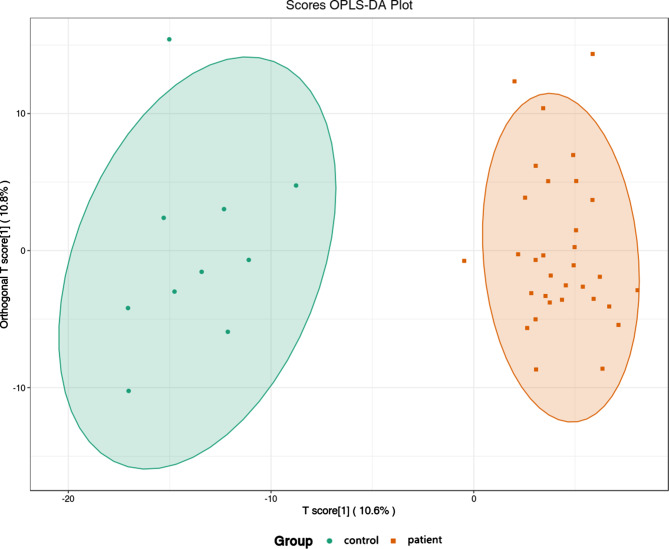
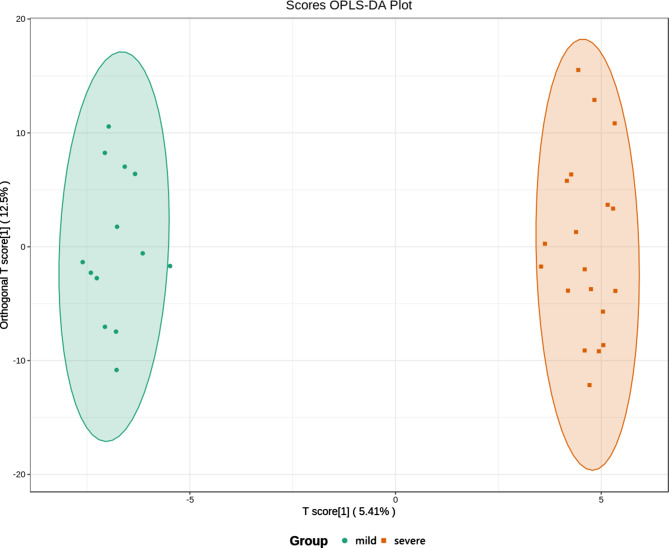
Methods: There were 10 healthy individuals in the control group and 32 patients with KOA. According to the Kellgren-Lawrence (KL) grading system, KOA was further divided into mild (n = 13, KL grade 1 and 2) and severe (n = 19, KL grade 3 and 4). Serum samples from all participants were collected and analyzed metabolomics based on ultra-performance liquid chromatography/electrospray ionization/tandem mass spectrometry. We screened for differential metabolites between patients and controls, and between mild and severe KOA. We explored the metabolic pathways involved in differential metabolism using the Kyoto Encyclopedia of Genes and Genomes database.

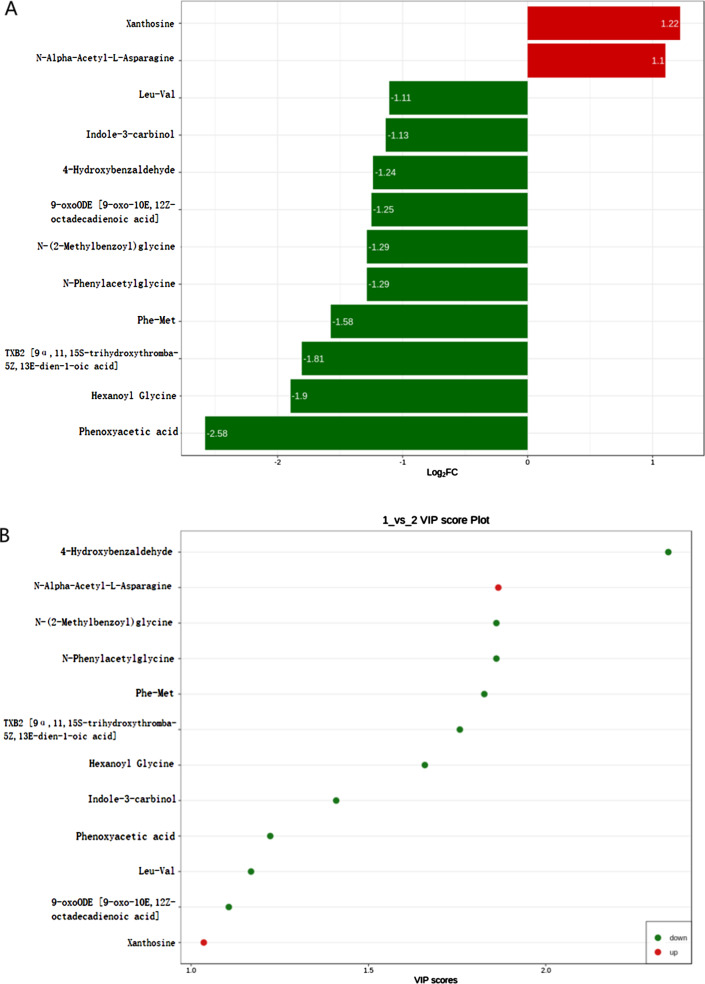
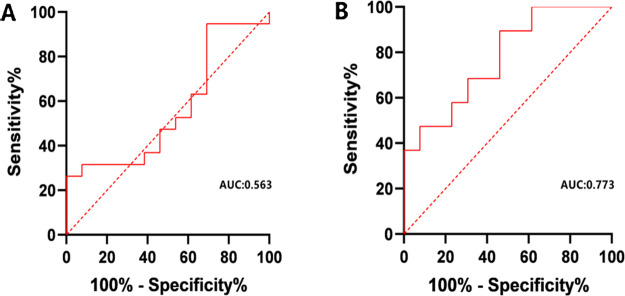
Results: Sixty-one metabolites were differentially expressed in the sera of the patient group compared with the control group (45 upregulated and 16 downregulated). Analysis of the mild and severe KOA groups showed a total of 12 differential metabolites. Receiver operating characteristic curve analysis showed N-alpha-acetyl-L-asparagine was a good predictor of advanced osteoarthritis(OA).Differential metabolites are enriched in multiple pathways such as arachidonic acid metabolism.

Conclusion: Widely targeted metabolomics found that upregulation of the amino acid metabolite N-α-acetyl-L-asparagine was significantly associated with severe KOA and could be a biomarker for predicting severity of KOA. Arachidonic acid metabolism may play an important role in patients with severe KOA.

Keywords: Biomarkers; Knee osteoarthritis; Metabolomics.


Conflict of interest statement

The authors declare no competing interests.

Figures

Fig. 1
Fig. 1
Plot of OPLS-DA scores in the control versus patient groups. One circle represents one participant in the control group, one square represents one patient in the patient group. The samples of both groups showed the trend of intra-group aggregation and inter-group classification
Fig. 2
Fig. 2
Heatmap presentation of 61 differential metabolites in the KOA group versus the control group.The horizontal axis shows 42 participants and the vertical axis shows 61 different metabolites. The numbers beginning with 3 are the control group, and the numbers beginning with 1 and 2 are the patient group
Fig. 3
Fig. 3
Plot of OPLS-DA scores for the mild versus severe KOA groups. The circles represent patients with mild KOA and the squares represent patients with severe KOA. The two groups had obvious trends of intra-group aggregation and inter-group separation
Fig. 4
Fig. 4
Identification of differentially expressed metabolites between mild and severe KOA. Xanthosine and N–acetyl-L-asparagine are metabolites associated with severe KOA. (A) The 12 differentially expressed metabolites ranked by log2 fold change (Log2 FC). (B) The 12 differentially expressed metabolites ranked by VIP
Fig. 5
Fig. 5
ROC curve analysis for the differential metabolites: xanthosine (A) and N-α-acetyl-L-asparagine (B). The area under the ROC curve for xanthosine is 0.563, however N–acetyl-L-asparagine is 0.773
Fig. 6
Fig. 6
Pathway enrichment analysis of differentially expressed metabolites. (A) KEGG classification of differentially expressed metabolites between mild and severe KOA. (B) KEGG pathway enrichment analysis of differentially expressed metabolites

References

    1. Berenbaum F. Osteoarthritis as an inflammatory Disease (osteoarthritis is not osteoarthrosis!) Osteoarthritis Cartilage. 2013;21:16–21. doi: 10.1016/j.joca.2012.11.012. - DOI - PubMed
    1. Mobasheri A, Batt M. An update on the pathophysiology of osteoarthritis. Ann Phys Rehabil Med. 2016;59(5–6):333–9. doi: 10.1016/j.rehab.2016.07.004. - DOI - PubMed
    1. Kim S, Hwang J, Kim J, Ahn JK, Cha HS, Kim KH. Metabolite profiles of synovial fluid change with the radiographic severity of knee osteoarthritis. Joint Bone Spine. 2017;84(5):605–10. doi: 10.1016/j.jbspin.2016.05.018. - DOI - PubMed
    1. O’Neill TW, McCabe PS, McBeth J. Update on the epidemiology, risk factors and Disease outcomes of osteoarthritis. Best Pract Res Clin Rheumatol. 2018;32(2):312–26. doi: 10.1016/j.berh.2018.10.007. - DOI - PubMed
    1. Johnson VL, Hunter DJ. The epidemiology of osteoarthritis. Best Pract Res Clin Rheumatol. 2014;28(1):5–15. doi: 10.1016/j.berh.2014.01.004. - DOI - PubMed

LinkOut - more resources