. 2023 Dec 8;24(1):284.
doi: 10.1186/s13059-023-03122-5.

Pediatric glioma histone H3.3 K27M/G34R mutations drive abnormalities in PML nuclear bodies

Affiliations

Pediatric glioma histone H3.3 K27M/G34R mutations drive abnormalities in PML nuclear bodies

Hsiao P J Voon et al. Genome Biol. .

Abstract

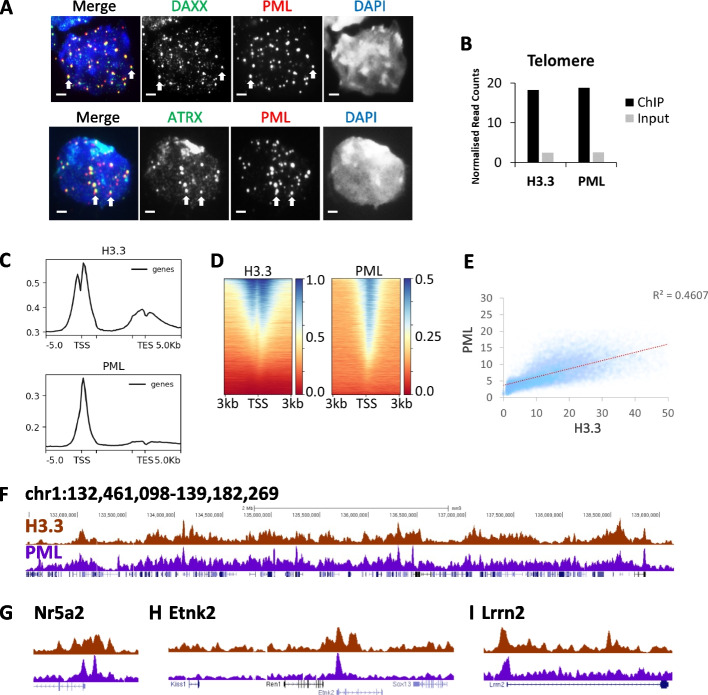
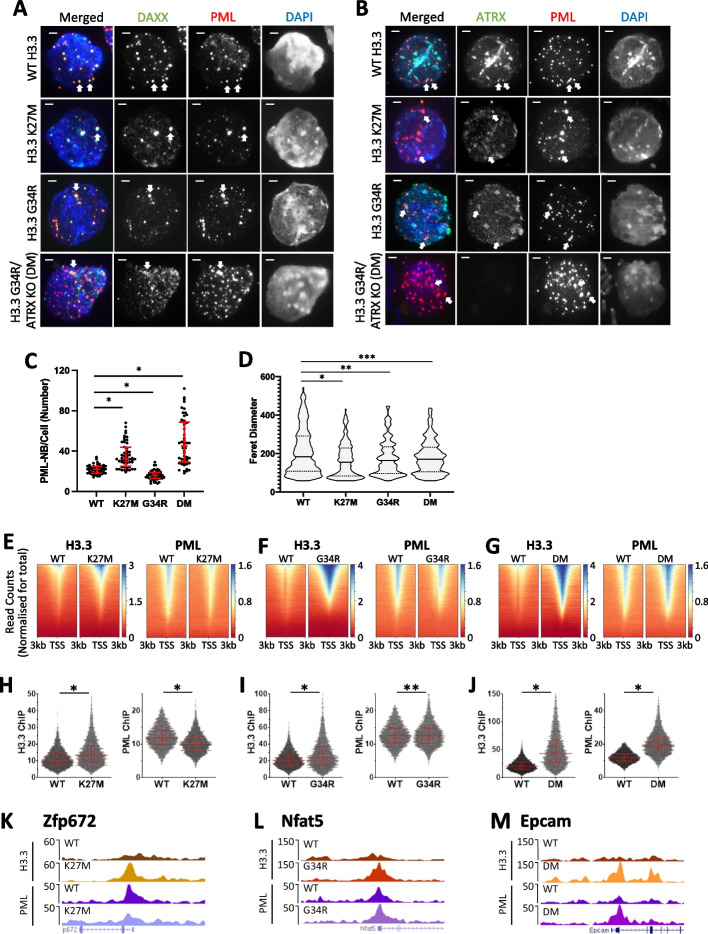
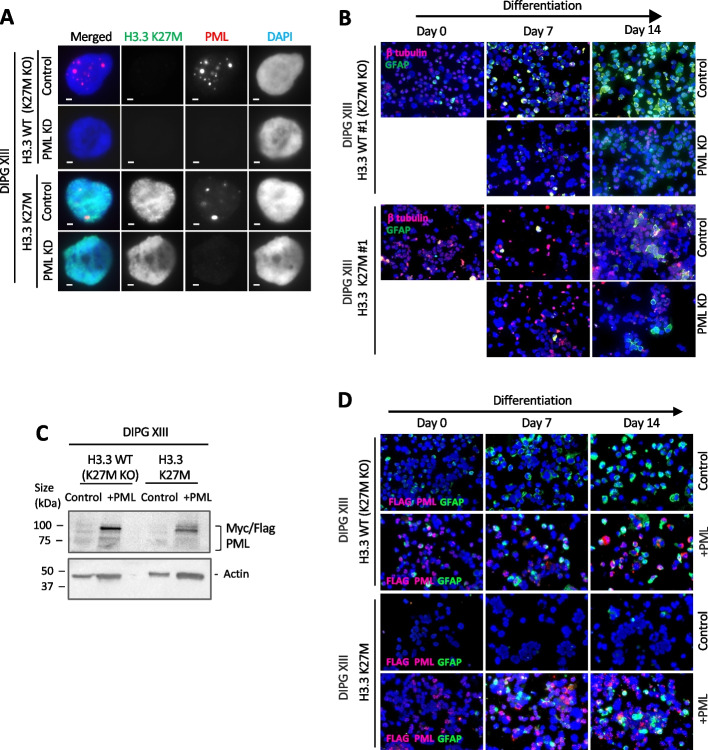
Background: Point mutations in histone variant H3.3 (H3.3K27M, H3.3G34R) and the H3.3-specific ATRX/DAXX chaperone complex are frequent events in pediatric gliomas. These H3.3 point mutations affect many chromatin modifications but the exact oncogenic mechanisms are currently unclear. Histone H3.3 is known to localize to nuclear compartments known as promyelocytic leukemia (PML) nuclear bodies, which are frequently mutated and confirmed as oncogenic drivers in acute promyelocytic leukemia.

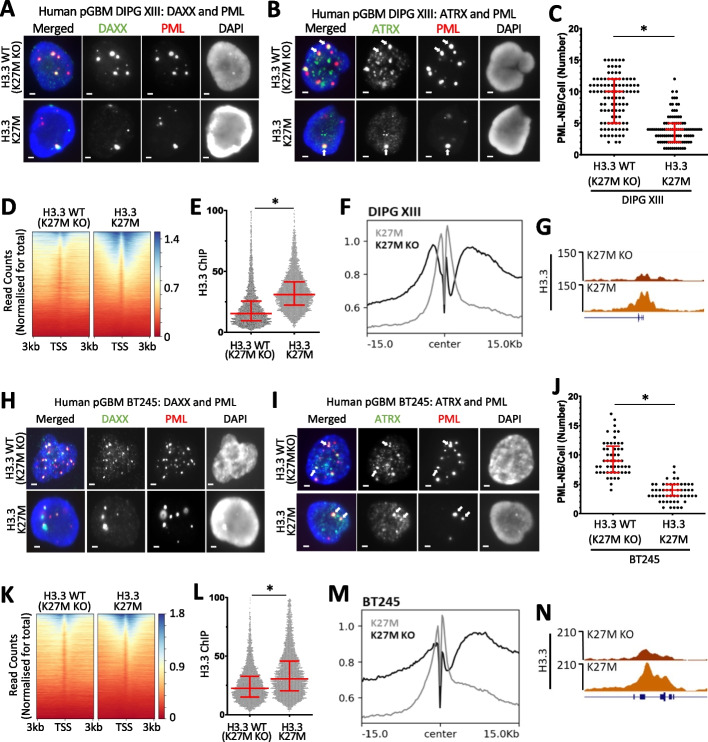
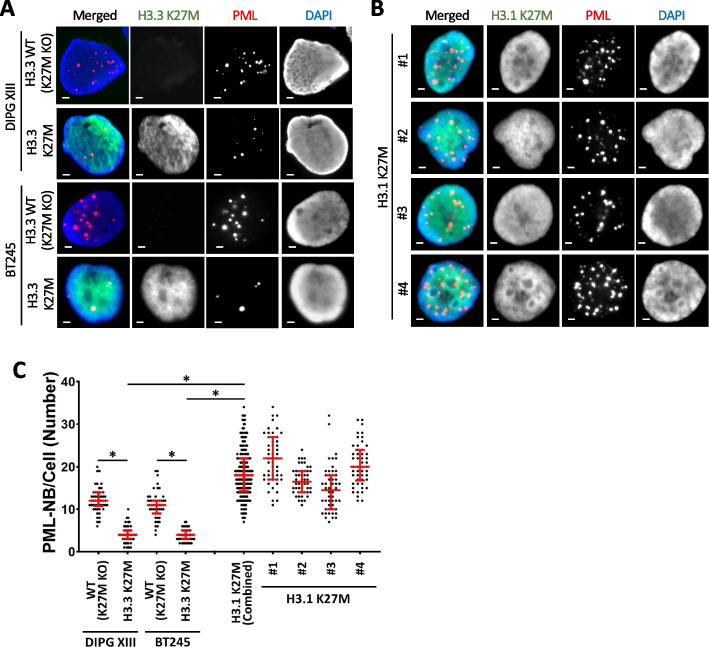
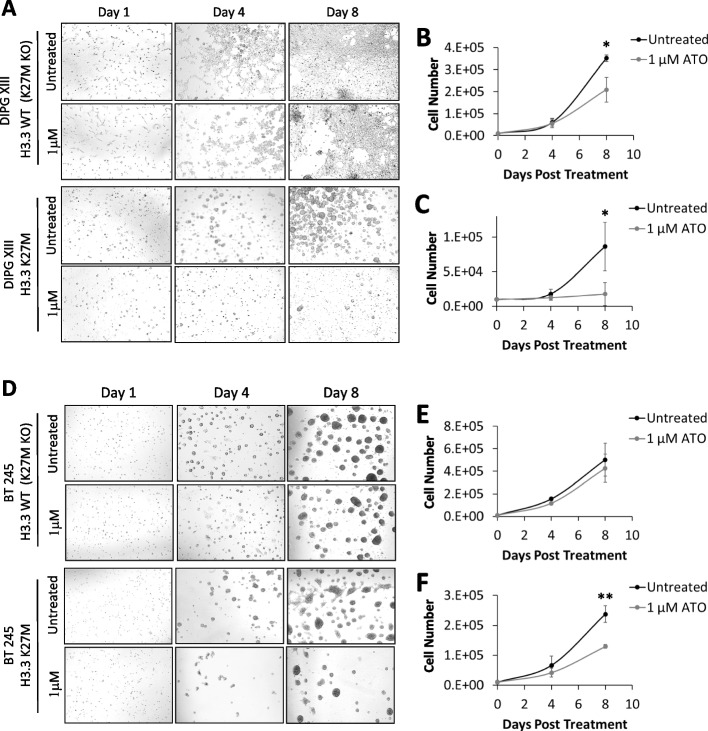
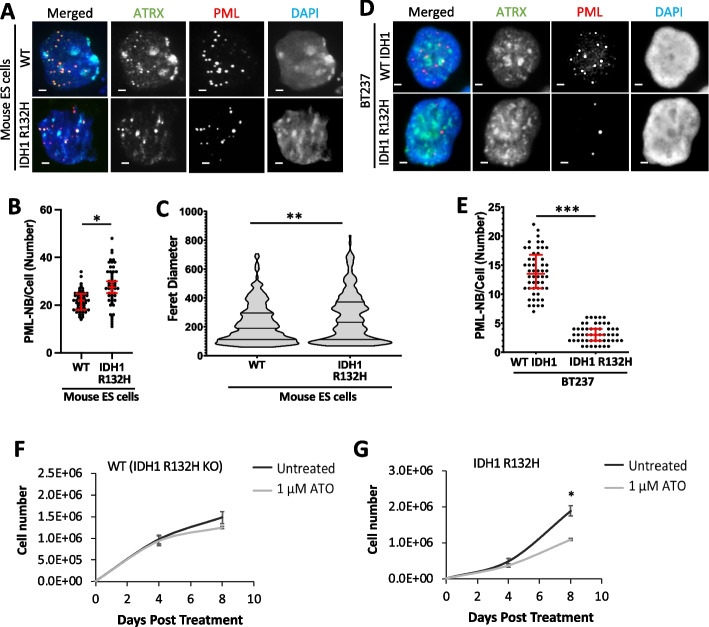
Results: We find that the pediatric glioma-associated H3.3 point mutations disrupt the formation of PML nuclear bodies and this prevents differentiation down glial lineages. Similar to leukemias driven by PML mutations, H3.3-mutated glioma cells are sensitive to drugs that target PML bodies. We also find that point mutations in IDH1/2-which are common events in adult gliomas and myeloid leukemias-also disrupt the formation of PML bodies.

Conclusions: We identify PML as a contributor to oncogenesis in a subset of gliomas and show that targeting PML bodies is effective in treating these H3.3-mutated pediatric gliomas.

Keywords: Arsenic trioxide; Histone variant H3.3; PML bodies; Pediatric glioma.


Conflict of interest statement

The authors declare that they have no competing interests.

Figures

Fig. 1
Fig. 1
Histone H3.3 co-localizes with PML across the genome. A Immunofluorescence of PML (red) and DAXX (green) (top panel), and PML (red) and ATRX (green) (bottom panel) in WT mouse ES cells. Scale bar 2 µM. B H3.3 and PML ChIP-sequencing and input reads which map to telomere repeats. Bars represent ChIP-sequencing reads of H3.3 and PML in mouse ES cells normalized to total read count. Input sequencing shown as a control. C Composite profile of H3.3 and PML ChIP-seq reads across genes in mouse ES cells. D Heatmap of H3.3 and PML ChIP-seq reads at individual promoters [56], sorted by H3.3 enrichment. E Scatter plot of H3.3 and PML ChIP-seq reads which mapped to individual promoters, normalized for total read counts. F Representative UCSC genome browser profile of H3.3 and PML ChIP-seq (mm9, chr1: 132,461,098 – 139,182,269). G–I Zoom of promoter regions showing H3.3 and PML ChIP-seq G Nr5a2; mm9; chr1:138,666,969–138,977,687, H Etnk2; mm9; chr1:135,155,366–135,381,931, and I Lrrn2; mm9; chr1:134,680,403–135,017,359
Fig. 2
Fig. 2
PML and H3.3 profiles in mouse ES cells with single-copy H3.3 (K27M/G34R) point mutations, and ATRX KO mutations. Immunofluorescence of A PML (red) and DAXX (green) and B PML (red) and ATRX (green), in WT, H3.3 K27M, H3.3 G34R, and H3.3 G34R/ATRX KO (double mutant; DM) mouse ES cell lines. Scale bar 2 µM. C Quantitation of PML-NBs per cell. Fifty nuclei (n = 50) were counted from three independent immunofluorescence experiments per cell line. Dots represent counts per cell (WT; H3.3 K27M; H3.3 G34R; DM). P-values were calculated using two-tailed Student’s t test (*P < 0.0001). D dSTORM quantitation of Feret diameter (size) of PML-NBs dies in WT (n = 292), H3.3 K27M (n = 200), H3.3 G34R (n = 276), and H3.3 G34R/ATRX KO (DM) (n = 289) cells. 25th, median, and 75th percentiles are shown. P-values were calculated using a two-tailed Mann–Whitney U test (*P < 0.0005, **P < 0.01, **P < 0.05). E–G ChIP-seq read count density heatmaps (normalized for total read counts) of H3.3 (left panel) and PML (right panel) ChIP-seq at transcriptional start sites (TSS) ± 3 kb, sorted by H3.3 enrichment in E H3.3 K27M, F H3.3 G34R, and G DM mutant cell lines, compared to WT cells. H,I H3.3 (left panel) and PML (right panel) ChIP-seq read counts at H3K4me3 enriched promoters (TSS ± 1 kb) in WT and H H3.3 K27M, I H3.3 G34R, and J DM cell lines. P-values were calculated using two-tailed Student’s t test (*P < 0.0001, **P < 0.0005). 25th, median, and 75th percentiles are shown. K–M Representative UCSC genome browser profiles of H3.3 and PML ChIP-seq in WT, K H3.3 K27M (Zfp672; mm9; chr11:58,105,009 – 58,165,027), L H3.3 G34R (Nfat5; mm9; chr8:109,772,915 – 109,862,824), and M DM cell lines (Epcam1; mm9; chr17:87,986,869–88,086,768)
Fig. 3
Fig. 3
PML and H3.3 profiles in H3.3 K27M mutant patient-derived glioma cells. Immunofluorescence of A PML (red) and DAXX (green) and B PML (red) and ATRX (green), in H3.3 K27M in the DIPG XIII patient-derived glioma cell line compared to an H3.3 WT (K27M KO) isogenic control. Scale bar 2 µM. C PML-NBs per cell in H3.3 K27M and H3.3 WT (K27M KO) DIPG XIII cells (n = 103). P-values were calculated using two-tailed Student’s t test (*P < 0.0001). 25th, median, and 75th percentiles are shown. D ChIP-seq read count density heatmaps (normalized for total read counts) of H3.3 ChIP-seq at TSS ± 3 kb in H3.3 WT (K27M KO) and H3.3 K27M DIPG XIII cells. E ChIP-seq read counts at H3K27ac enriched promoters (TSS ± 1 kb) in H3.3 WT (K27M KO) and H3.3 K27M DIPG XIII cells (n = 5108). P-values were calculated using two-tailed Student’s t test (*P < 0.0001). 25th, median, and 75th percentiles are shown. F Composite profile of H3.3 at H3K27ac enriched promoters, centered on transcriptional start sites in H3.3 K27M DIPG XIII glioma cells compared to H3.3 WT (K27M KO) isogenic control. G Representative UCSC genome browser profile of H3.3 ChIP-seq in H3.3 K27M DIPG XIII and H3.3 WT (K27M KO) isogenic control (Ak3; hg38; chr9:4,635,308 – 4,827,283). H–N Experiments repeated across an independent (BT245) H3.3 K27M patient-derived glioma cell line. H Immunofluorescence of PML (red) and DAXX (green) and I PML (red) and ATRX (green), in H3.3 K27M BT245 cells compared to an H3.3 WT (K27M KO) isogenic control. Scale bar 2 µM. J PML-NBs per cell in H3.3 K27M BT245 and H3.3 WT (K27M KO) cells (n = 53). P-values were calculated using two-tailed Student’s t test (*P < 0.0001). K ChIP-seq read count density heatmaps of H3.3 ChIP-seq at TSS ± 3 kb in H3.3 WT (K27M KO) and H3.3 K27M BT245 cells. L ChIP-seq read counts at H3K27ac enriched promoters (TSS ± 1 kb) in H3.3 WT (K27M KO) and H3.3 K27M BT245 cells. P-values were calculated using two-tailed Student’s t test (*P < 0.0001). 25th, median, and 75th percentiles are shown. M Composite profile of H3.3 at promoters, centered on transcriptional start sites in H3.3 K27M BT245 ells compared to H3.3 WT (K27M KO) isogenic control. N Representative UCSC genome browser profile of H3.3 ChIP-seq in H3.3 K27M BT245 and H3.3 WT (K27M KO) isogenic control. Rims2; hg38; chr8:103,455,749 – 103,545,748
Fig. 4
Fig. 4
PML nuclear bodies in H3.3 K27M vs canonical H3.1 K27M mutated patient-derived glioma cells. Immunofluorescence of PML (red) and H3K27M (green) in A DIPG XIII and BT245 H3.3 K27M mutated patient-derived glioma cells compared to isogenic H3.3 WT (K27M KO) controls. B H3.1 K27M mutated patient-derived glioma cells: #1 (SU_DIPG_36), #2 (ICR_B184_2D), #3 (SU_DIPG_33), and #4 (SU_DIPG_4). Scale bar 2 µM. C Quantitation of PML-NBs per cell. 50 nuclei (n = 50) were counted from three independent immunofluorescence experiments per cell line. Dots represent counts per cell (WT (K27MKO); H3.3 K27M in DIPG XIII and BT245 cells; #1; #2; #3; #4 H3.1 K27M lines). 25th, median, and 75th percentiles are shown. H3.1 K27M (combined) shows an aggregate of all four H3.1 K27M cell lines. P-values were calculated using two-tailed Student’s t test (*P < 0.0001)
Fig. 5
Fig. 5
PML knockdown inhibits differentiation in H3.3 WT (K27M KO) glioma cells. A Immunofluorescence of K27M (green) and PML (red) in DIPG XIII H3.3 WT (K27M KO) and H3.3 K27M pediatric glioma cells (clone #1) with and without doxycycline-induced PML knockdown. Scale bar 2 µM. B Immunofluorescence staining of GFAP glial marker (green) and β-tubulin (red) of DIPG XIII H3.3 WT (K27M KO) and H3.3 K27M glioma cells (clone #1) with and without PML knockdown, over 7 and 14 days of culture in differentiation media. C Western blots of DIPG XIII H3.3 WT (K27M KO) and H3.3 K27M glioma cells overexpressing myc/flag tagged PML (denoted + PML) using anti-myc and actin antibodies. D Immunofluorescence staining of GFAP glial marker (green) and β-tubulin (red) of DIPG XIII H3.3 WT (K27M KO) and H3.3 K27M glioma cells with and without PML overexpression, over 7 and 14 days of culture in differentiation media
Fig. 6
Fig. 6
Arsenic trioxide treatment of H3.3 K27M mutated patient-derived glioma cells. A Phase-contrast microscopy of DIPG XIII H3.3 WT (K27M KO) and H3.3 K27M pediatric glioma cells treated with 1 µM of arsenic trioxide for 1, 4, and 8 days. Untreated cells are shown as controls. Cell counts of B H3.3 WT (K27M KO) and C H3.3 K27M pediatric glioma cells treated with 1 µM of arsenic trioxide for 0, 4, and 8 days compared to untreated controls. D–F Experiments were repeated in an independent BT245 H3.3 WT (K27M KO) and H3.3 K27M pediatric glioma cell line. Points and error bars represent the mean average and standard deviation of three independent experiments. P-values were calculated using two-tailed Student’s t test (*P < 0.05 **P < 0.005)
Fig. 7
Fig. 7
PML-NBs and arsenic trioxide treatment of IDH1 R132H mutated oligodendroglioma cells. A Immunostaining of ATRX (green) and PML (red) in WT and heterozygous IDH1 R132H mouse ES cells. Scale bar 2 µM. B Quantitation of PML-NBs per cell. Fifty nuclei (n = 50) were counted per cell line from three independent immunofluorescence experiments. Dots represent counts per cell. P-values were calculated using two-tailed Student’s t test (*P < 0.0001). C dSTORM quantitation of Feret diameter (size) of PML nuclear bodies in WT (n = 292), IDH1 R132H (n = 256) cells. 25th, median, and 75th percentiles are shown. P-values were calculated using a two-tailed Mann–Whitney U test (**P < 0.005). D Immunostaining of ATRX (green) and PML (red) in IDH1 WT (R132H KO) and BT237 IDH1 R132H patient-derived glioma cells. Scale bar 2 µM. E PML-NBs per cell in IDH1 KO and IDH1 R132H mutant cells. Dots represent counts per cell (n = 103). 25th, median, and 75th percentiles are shown. P-values were calculated using two-tailed Student’s t test (***P < 0.0001). Cell counts of F IDH1 WT (R132H KO) and G IDH1 R132H pediatric glioma cells treated with 1 µM of arsenic trioxide for 0, 4, and 8 days compared to untreated controls. Points and error bars represent the mean average and standard deviation of three independent experiments. P-values were calculated using two-tailed Student’s t test (*P < 0.005)

References

    1. Schwartzentruber J, Korshunov A, Liu XY, Jones DT, Pfaff E, Jacob K, Sturm D, Fontebasso AM, Quang DA, Tonjes M, et al. Driver mutations in histone H3.3 and chromatin remodelling genes in paediatric glioblastoma. Nature. 2012;482:226–231. doi: 10.1038/nature10833. - DOI - PubMed
    1. Wu G, Broniscer A, McEachron TA, Lu C, Paugh BS, Becksfort J, Qu C, Ding L, Huether R, Parker M, et al. Somatic histone H3 alterations in pediatric diffuse intrinsic pontine gliomas and non-brainstem glioblastomas. Nat Genet. 2012;44:251–253. doi: 10.1038/ng.1102. - DOI - PMC - PubMed
    1. Deshmukh S, Ptack A, Krug B, Jabado N. Oncohistones: a roadmap to stalled development. FEBS J. 2022;289:1315–1328. doi: 10.1111/febs.15963. - DOI - PMC - PubMed
    1. Louis DN, Perry A, Reifenberger G, von Deimling A, Figarella-Branger D, Cavenee WK, Ohgaki H, Wiestler OD, Kleihues P, Ellison DW. The 2016 World Health Organization Classification of Tumors of the Central Nervous System: a summary. Acta Neuropathol. 2016;131:803–820. doi: 10.1007/s00401-016-1545-1. - DOI - PubMed
    1. Ederveen TH, Mandemaker IK, Logie C. The human histone H3 complement anno 2011. Biochim Biophys Acta. 2011;1809:577–586. doi: 10.1016/j.bbagrm.2011.07.002. - DOI - PubMed

Publication types