. 2023 Dec 8;21(1):488.
doi: 10.1186/s12916-023-03195-w.

Association between menstrual cycle phase and metabolites in healthy, regularly menstruating women in UK Biobank, and effect modification by inflammatory markers and risk factors for metabolic disease

Affiliations

Association between menstrual cycle phase and metabolites in healthy, regularly menstruating women in UK Biobank, and effect modification by inflammatory markers and risk factors for metabolic disease

Kirstin A MacGregor et al. BMC Med. .

Abstract

Background: Preliminary evidence demonstrates some parameters of metabolic control, including glycaemic control, lipid control and insulin resistance, vary across the menstrual cycle. However, the literature is inconsistent, and the underlying mechanisms remain uncertain. This study aimed to investigate the association between the menstrual cycle phase and metabolites and to explore potential mediators and moderators of these associations.

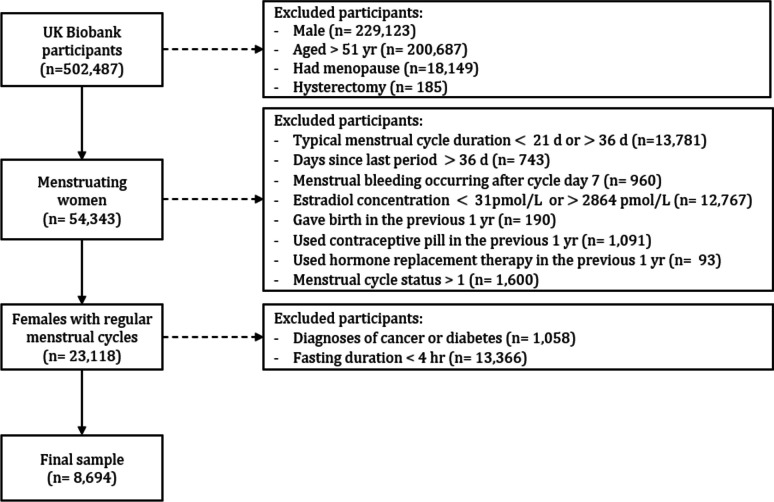
Methods: We undertook a cross-sectional cohort study using UK Biobank. The outcome variables were glucose; triglyceride; triglyceride to glucose index (TyG index); total, HDL and LDL cholesterol; and total to HDL cholesterol ratio. Generalised additive models (GAM) were used to investigate non-linear associations between the menstrual cycle phase and outcome variables. Anthropometric, lifestyle, fitness and inflammatory markers were explored as potential mediators and moderators of the associations between the menstrual cycle phase and outcome variables.

Results: Data from 8694 regularly menstruating women in UK Biobank were analysed. Non-linear associations were observed between the menstrual cycle phase and total (p < 0.001), HDL (p < 0.001), LDL (p = 0.012) and total to HDL cholesterol (p < 0.001), but not glucose (p = 0.072), triglyceride (p = 0.066) or TyG index (p = 0.100). Neither anthropometric, physical fitness, physical activity, nor inflammatory markers mediated the associations between the menstrual cycle phase and metabolites. Moderator analysis demonstrated a greater magnitude of variation for all metabolites across the menstrual cycle in the highest and lowest two quartiles of fat mass and physical activity, respectively.

Conclusions: Cholesterol profiles exhibit a non-linear relationship with the menstrual cycle phase. Physical activity, anthropometric and fitness variables moderate the associations between the menstrual cycle phase and metabolite concentration. These findings indicate the potential importance of physical activity and fat mass as modifiable risk factors of the intra-individual variation in metabolic control across the menstrual cycle in pre-menopausal women.

Keywords: Follicular phase; Glucose; Lipid; Luteal phase; Metabolic control; Triglyceride.


Conflict of interest statement

The authors declare that they have no competing interests.

Figures

Fig. 1
Fig. 1
Flow diagram depicting participant inclusion in the current study
Fig. 2
Fig. 2
Variations in glucose, triglyceride and TyG index across the menstrual cycle for each model. Fat mass %, muscle mass %, age-specific grip strength (kg) z-score and age-specific cardiorespiratory fitness (METs) level z-score are categorised as quartiles. Physical activity (METs) is categorised into low, medium and high according to previously defined criteria. Curves represent GAM estimates using a smoothing spline function. Shaded areas represent 95% confidence intervals. The menstrual cycle phase is shown on a scale of 0–1 corresponding to the approximate phases: follicular phase, 0–0.54; luteal phase, 0.54–1 [38]. Analyses were adjusted for age, ethnicity and deprivation. Significant model fit for each sub-group is denoted by the respective number at the top right corner. TyG index, triglyceride to glucose index
Fig. 3
Fig. 3
Variations in total cholesterol, HDL, LDL and total choleserol:HDL across the menstrual cycle for each model. Fat mass %, muscle mass %, age-specific grip strength (kg) z-score and age-specific cardiorespiratory fitness (METs) z-score are categorised as quartiles. Physical activity (METs) is categorised into low, medium and high according to previously defined criteria. Lines represent GAM estimates using a smoothing spline function. Shaded areas represent 95% confidence intervals. The menstrual cycle phase is shown on a scale of 0–1; this corresponds to the approximate phases: follicular phase, 0–0.54; luteal phase, 0.54–1 [38]. Analyses were adjusted for age, ethnicity and deprivation. Significant non-linear relationships for each category level are denoted by the respective number at the top right corner. LDL, low-density lipoprotein; HDL, high-density lipoprotein

References

    1. Ramos RG, Olden K. The prevalence of metabolic syndrome among US women of childbearing age. Am J Public Health. 2008;98(6):1122–1127. doi: 10.2105/AJPH.2007.120055. - DOI - PMC - PubMed
    1. Huang PL. A comprehensive definition for metabolic syndrome. Dis Model Mech. 2009;2(5–6):231–237. doi: 10.1242/dmm.001180. - DOI - PMC - PubMed
    1. Monnier L, Colette C. Postprandial and basal hyperglycaemia in type 2 diabetes: contributions to overall glucose exposure and diabetic complications. Diabetes Metabol. 2015;41(6):6S9–15. doi: 10.1016/S1262-3636(16)30003-9. - DOI - PubMed
    1. Wan EYF, Yu EYT, Chin WY, Barrett JK, Mok AHY, Lau CST, et al. Greater variability in lipid measurements associated with cardiovascular disease and mortality: a 10-year diabetes cohort study. Diabetes Obes Metab. 2020;22(10):1777–1788. doi: 10.1111/dom.14093. - DOI - PMC - PubMed
    1. Tang X, Li S, Wang Y, Wang M, Yin Q, Mu P, et al. Glycemic variability evaluated by continuous glucose monitoring system is associated with the 10-y cardiovascular risk of diabetic patients with well-controlled HbA1c. Clin Chim Acta. 2016;461:146–150. doi: 10.1016/j.cca.2016.08.004. - DOI - PubMed

LinkOut - more resources