. 2023 Dec 8;24(1):285.
doi: 10.1186/s13059-023-03130-5.

DNA methylation modulated genetic variant effect on gene transcriptional regulation

Affiliations

DNA methylation modulated genetic variant effect on gene transcriptional regulation

Yong Zeng et al. Genome Biol. .

Abstract

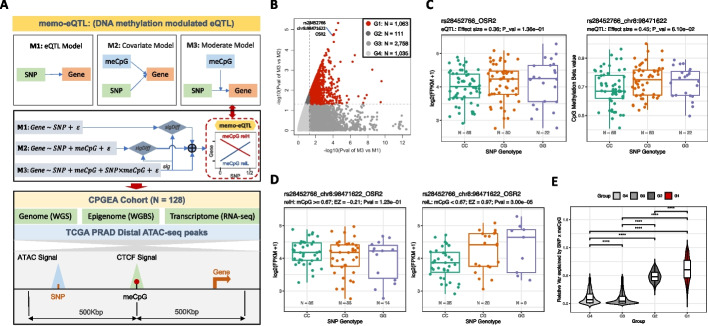
Background: Expression quantitative trait locus (eQTL) analysis has emerged as an important tool in elucidating the link between genetic variants and gene expression, thereby bridging the gap between risk SNPs and associated diseases. We recently identified and validated a specific case where the methylation of a CpG site influences the relationship between the genetic variant and gene expression.

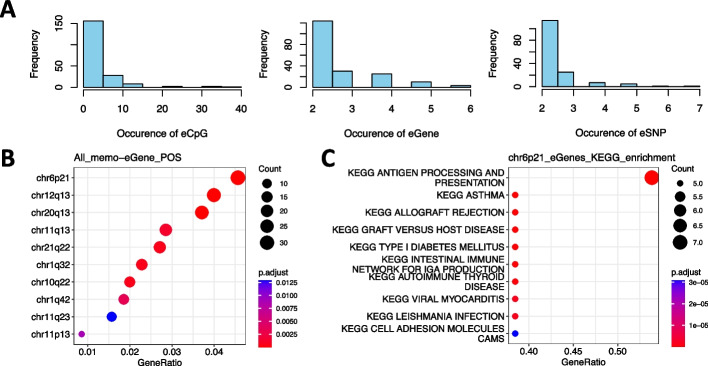
Results: Here, to systematically evaluate this regulatory mechanism, we develop an extended eQTL mapping method, termed DNA methylation modulated eQTL (memo-eQTL). Applying this memo-eQTL mapping method to 128 normal prostate samples enables identification of 1063 memo-eQTLs, the majority of which are not recognized as conventional eQTLs in the same cohort. We observe that the methylation of the memo-eQTL CpG sites can either enhance or insulate the interaction between SNP and gene expression by altering CTCF-based chromatin 3D structure.

Conclusions: This study demonstrates the prevalence of memo-eQTLs paving the way to identify novel causal genes for traits or diseases associated with genetic variations.

Keywords: CTCF; Chromatin 3D structure; Memo-eQTL; SNP; eQTL; meCpG.


Conflict of interest statement

The authors declare that they have no competing interests.

Figures

Fig. 1
Fig. 1
Correlation between meCpG and CTCF binding. A The correlation coefficients and statistical significance for the most significantly correlated meCpG and CTCF per each CTCF binding site. Neg and Pos refer to negatively correlated and positively correlated meCpG-CTCF pairs, respectively. B Examples of negatively and positively correlated meCpG-CTCF pair across 26 ENCODE samples (SCC: Spearman correlation coefficient; Pval: p-value; CpG to CTCF: the distance from the meCpG site to the center of the CTCF binding site). Comparisons of the average CpG methylation levels (C) and average CTCF binding intensity (D) between Neg and Pos groups (Wilcoxon rank-sum two-sided test: mean CpG methylation level: p < 2.20 × 10−16; mean CTCF intensity: p = 2.20 × 10−3). E Comparison of the distances between the meCpG site and the center of CTCF binding site for Neg and Pos groups (Kolmogorov–Smirnov test: p = 1.05 × 10.−5). **p < 0.01; ***p < 0.001
Fig. 2
Fig. 2
Mapping and characteristics of memo-eQTLs. A The framework of memo-eQTL mapping method and its implementation in the CPGEA cohort (sig: significant; sigDiff: significantly different; relH and relL refer to the subsamples with relatively high and low methylation levels at corresponding meCpG site, respectively). B Four different groups of SNP-meCpG-Gene combinations based on comparisons of M3 versus M1 and M3 versus M2 after requiring that M3 be significant. Note that combinations belonging to the group 1 (G1) are considered as memo-eQTLs. C Canonical eQTL (left) and meQTL (right) analysis for SNP rs28452766 with gene OSR2 and CpG site at chr8:98,471,622, respectively. D Visualization of selected memo-eQTL, depicting the relationship between rs28452766 and OSR2 in subsamples with relatively high (relH: Beta ≥ 0.67) and low (relL: Beta < 0.67) methylation levels at chr8:98,471,622. E The comparisons of the relative variance of gene expression can be explained by SNP × meCpG across groups G1-4 (Wilcoxon rank-sum two-sided test: ****p < 0.0001)
Fig. 3
Fig. 3
Characteristics eCpG, eGene, and eSNP for memo-eQTLs. A The occurrence of eCpG (left), eGene (middle), and eSNP (right) in 1063 memo-eQTLs. B Enrichment of eGenes in various chromosome regions. C Enriched KEGG pathways for eGenes located in chr6p21
Fig. 4
Fig. 4
Mechanisms investigation for memo-eQTLs. A Stratified four subgroups of memo-eQTLs based on the p-values of M1 models for relatively high (relH) and low (relL) subsamples of the eCpG site, 0.05 was used as the significance cutoff. B The effect size and direction of eSNPs on eGenes in eCpG relH and relL subsamples for the sigBoth memo-eQTLs. C Comparisons of the Spearman correlation coefficients for meCpG-CTCF pairs across four memo-eQTL groups (Wilcoxon rank-sum two-sided test: ns: not significant). D The number of 22Rv1 HiChIP data derived CTCF loops that overlapped with the eSNP-eCpG-eGene loci. E The illustration plot of the overlapping patterns between eSNP-eCpG-eGene loci and eCpG-CTCF loops. F The overlapping patterns between the eSNP-eCpG-eGene loci and eCpG-CTCF loops derived from 22Rv1 HiChIP data for the four memo-eQTL groups (chi-squared test: p = 1.68 × 10.−3)

References

    1. Buniello A, MacArthur JAL, Cerezo M, Harris LW, Hayhurst J, Malangone C, et al. The NHGRI-EBI GWAS Catalog of published genome-wide association studies, targeted arrays and summary statistics 2019. Nucleic Acids Res. 2019;47:D1005–D1012. doi: 10.1093/nar/gky1120. - DOI - PMC - PubMed
    1. Maurano MT, Humbert R, Rynes E, Thurman RE, Haugen E, Wang H, et al. Systematic localization of common disease-associated variation in regulatory DNA. Science. 2012;337:1190–1195. doi: 10.1126/science.1222794. - DOI - PMC - PubMed
    1. Cookson W, Liang L, Abecasis G, Moffatt M, Lathrop M. Mapping complex disease traits with global gene expression. Nat Rev Genet. 2009;10:184–194. doi: 10.1038/nrg2537. - DOI - PMC - PubMed
    1. Farh KKH, Marson A, Zhu J, Kleinewietfeld M, Housley WJ, Beik S, et al. Genetic and epigenetic fine mapping of causal autoimmune disease variants. Nature. 2015;518:337–43. doi: 10.1038/nature13835. - DOI - PMC - PubMed
    1. Albert FW, Kruglyak L. The role of regulatory variation in complex traits and disease. Nat Rev Genet. 2015;16:197–212. doi: 10.1038/nrg3891. - DOI - PubMed

Publication types

LinkOut - more resources