. 2023 Dec 9;22(1):200.
doi: 10.1186/s12943-023-01886-9.

Safety and efficacy of a novel anti-CD19 chimeric antigen receptor T cell product targeting a membrane-proximal domain of CD19 with fast on- and off-rates against non-Hodgkin lymphoma: a first-in-human study

Affiliations

Safety and efficacy of a novel anti-CD19 chimeric antigen receptor T cell product targeting a membrane-proximal domain of CD19 with fast on- and off-rates against non-Hodgkin lymphoma: a first-in-human study

Yunlin Zhang et al. Mol Cancer. .

Abstract

Background: Commercial anti-CD19 chimeric antigen receptor T-cell therapies (CART19) are efficacious against advanced B-cell non-Hodgkin lymphoma (NHL); however, most patients ultimately relapse. Several mechanisms contribute to this failure, including CD19-negative escape and CAR T dysfunction. All four commercial CART19 products utilize the FMC63 single-chain variable fragment (scFv) specific to a CD19 membrane-distal epitope and characterized by slow association (on) and dissociation (off) rates. We hypothesized that a novel anti-CD19 scFv that engages an alternative CD19 membrane-proximal epitope independent of FMC63 and that is characterized by faster on- and off-rates could mitigate CART19 failure and improve clinical efficacy.

Methods: We developed an autologous CART19 product with 4-1BB co-stimulation using a novel humanized chicken antibody (h1218). This antibody is specific to a membrane-proximal CD19 epitope and harbors faster on/off rates compared to FMC63. We tested h1218-CART19 in vitro and in vivo using FMC63-CART19-resistant models. We conducted a first-in-human multi-center phase I clinical trial to test AT101 (clinical-grade h1218-CART19) in patients with relapsed or refractory (r/r) NHL.

Results: Preclinically, h1218- but not FMC63-CART19 were able to effectively eradicate lymphomas expressing CD19 point mutations (L174V and R163L) or co-expressing FMC63-CAR19 as found in patients relapsing after FMC63-CART19. Furthermore, h1218-CART19 exhibited enhanced killing of B-cell malignancies in vitro and in vivo compared with FMC63-CART19. Mechanistically, we found that h1218-CART19 had reduced activation-induced cell death (AICD) and enhanced expansion compared to FMC63-CART19 owing to faster on- and off-rates. Based on these preclinical results, we performed a phase I dose-escalation trial, testing three dose levels (DL) of AT101 (the GMP version of h1218) using a 3 + 3 design. In 12 treated patients (7 DLBCL, 3 FL, 1 MCL, and 1 MZL), AT101 showed a promising safety profile with 8.3% grade 3 CRS (n = 1) and 8.3% grade 4 ICANS (n = 1). In the whole cohort, the overall response rate was 91.7%, with a complete response rate of 75.0%, which improved to 100% in DL-2 and -3. AT101 expansion correlates with CR and B-cell aplasia.

Conclusions: We developed a novel, safe, and potent CART19 product that recognizes a membrane-proximal domain of CD19 with fast on- and off-rates and showed significant efficacy and promising safety in patients with relapsed B-cell NHL.

Trial registration: NCT05338931; Date: 2022-04-01.

Keywords: CAR T cells; CD19; CD19 mutations; Epitope masking; Fast on- and off-rate; Leukemia; Low avidity; Lymphoma; Membrane-proximal epitope; Resistance.


Conflict of interest statement

MR holds patents related to CD19 CAR T cells (non-AT101) which are licensed to Novartis, Tmunity (Kite-Gilead), and viTToria Biotherapeutics. MR has served as a consultant for NanoString, BMS, GSK, GLG, Sana, Bayer, Guidepoint, Scailyte, and AbClon. MR receives research funding from AbClon, Beckman Coulter, CurioX, Oxoford Nano Imaging, and viTToria Biotherapeutics. MR is the scientific founder of viTToria biotherapeutics. RPP and GG received honoraria for consultation with viTToria Biotherapeutics. DHY has served as a consultant for Roche, Janssen, Amgen, BMS, Novartis, AbClon, GI cell, GC cell, and Pharos Bio. DHY receives honoraria from Roche, Janssen, Amgen, BMS, Kirin, Boryung, and Takeda. DHY receives research funding from Samyang, Kirin, Roche, Janssen and Boryung.

Figures

Fig. 1
Fig. 1
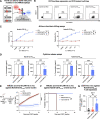
The h1218 antibody is specific for CD19 and recognizes a non-FMC63 membrane proximal epitope. A Schematic of FMC63 and h1218 antibodies binding sites on CD19. B Binding of h1218 to FMC63 bound-human CD19 complex. Sensor chips were coated with FMC63 Fc and CD19-ECD-Ck from 1700 to 2300 s. Additional FMC63 or h1218 antibody was added to the FMC63-bound sensor chip at 2300 s and monitored for further binding activities. C h1218 antibody binding test on wild-type HEK293T (CD19 negative), HEK293T cell expressing human CD19 (huCD19, HHH), and HEK293T cells expressing one of the three chimeric CD19 forms that had cynomolgus residues replacement at different region of CD19, respectively (CHH, HCH, and HHC). D Mutagenesis study to identify key residues corresponding to the h1218 CD19 epitope. E Quantification of IFNγ release on HEK293T cells expressing WT or mutant CD19 to identify additional key residues corresponding to the h1218 CD19 epitope. F Binding affinity of FMC63 and h1218 scFv to recombinant human CD19-ECD-Ck (M1-P278). Each line represents affinity measured at a different scFv concentration. All the experiments were repeated at least twice
Fig. 2
Fig. 2
h1218-CART19 recognize and kill malignant B cells carrying FMC63-resistant CD19 mutations. A Schematic representation of B cell leukemia cells with point mutations in the membrane-distal CD19 domain (CD19R163L or CD19L174V) as clinically identified post FMC63-CART19 treatment. B CD19 expression levels in Nalm6-CD19 KO, Nalm6 (wild type), Nalm6-CD19L174V (left) and Nalm6-CD19R163L (right) cell lines as measured by flow cytometry. C CART19 cytotoxicity against Nalm6-CD19L174V and Nalm6-CD19R163L at various effector to target (E:T) ratios (n = 3 independent donors) (luciferase assay). D IL-2 and TNF cytokine release measured by ELISA 24 h after CART19 and cancer cell co-culture at an E:T ratio of 5:1 (n = 2 donors). All values determined to be negative by comparison with the standard curve are shown as zero. E (Left) Schematic of the xenograft NSG mouse model: 1 × 106 luciferase + Nalm6-CD19L174V cells and 0.75 × 106 UTD, FMC63-CART19, or h1218-CART19 cells were intravenous injected with a 5-day interval. (Right) Tumor burden of engrafted mice treated with UTD (n = 5), FMC63-CART19 (n = 5), or h1218-CART19 (n = 5) as measured by bioluminescence imaging. The bold lines represent the median luminescence of each group. F Overall survival in each treatment group (p = 0.0027). G Absolute cell counts of huCD45+ huCD3+ T cells in 100μL mouse blood on day 9. All bar graphs and cytotoxicity curves are presented as the mean ± SEM. Survival curves were compared using the log-rank (Mantel-Cox) test, and one-way ANOVA was performed with Tukey’s correction for multiple comparisons; **** p < 0.0001, *** p < 0.001, ** p < 0.01, and * p < 0.05. All bar graphs are presented as the mean ± SEM. All experiments were repeated at least twice
Fig. 3
Fig. 3
h1218-CART19 recognize and kill relapsed FMC63-CAR19+ Nalm6. A Schematic representation of a B cell lymphoma/leukemia cell accidentally transduced with the FMC63-CAR19 lentivirus during manufacturing that leads to epitope masking and resistance to FMC63-based CART19. B FMC63 expression level on Nalm6 cells measured by flow cytometry. C IL-2 cytokine release quantification by ELISA 24 h after CART and cancer cell co-culture at a E:T ratio of 5:1 (n = 2 donors). All values determined as negative by comparison to the standard curve are shown as zero. D 48-h CART cytotoxicity against Nalm6-FMC63 at various E:T ratios (n = 2 donors) by flow cytometry. E Tumor growth in the presence of CART cells over 10 days (n = 3 donors) by flow cytometry. (Left) Fold change over time of Nalm6-FMC63 cells compared to day 0 counts. (Right) Nalm6-FMC63 fold change on day 6. F (Left) Schematic of the xenograft mouse model: 1 × 106 luciferase+ Nalm6-FMC63 cancer cells were engrafted 5 days before intravenous injection of 0.75 × 106 UTD or CART cells. (Right) Tumor burden over time in mice bearing Nalm6-FMC63 with UTD (n = 5), FMC63-CART19 (n = 5), or h1218-CART19 (n = 5). Bolded line represents the median of each group. G. Overall survival in mice bearing Nalm6-FMC63 (p = 0.0016). All bar graphs and cytotoxicity curves are represented as mean ± SEM. One-way ANOVA was performed with Tukey correction for multiple comparisons; survival curves were compared using the log-rank (Mantel-Cox) test; **** p < 0.0001, *** p < 0.001, ** p < 0.01, and * p < 0.05. All bar graphs are represented as mean ± SEM. All the experiments were repeated at least twice
Fig. 4
Fig. 4
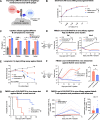
h1218-CART19 demonstrates enhanced efficacy than FMC63-CART19. A Schematic of h1218-CART19 targeting the membrane-proximal domain of CD19 in B cell lymphoma/leukemia as compared to standard FMC63-CART19. B Nalm6 tumor killing by UTD, h1218-CART19, or FMC63-CART19 cells at various E:T ratios (n = 3 donors) by flow cytometry. C IFNγ release as measured by ELISA upon stimulation of CD19-expressing tumor cells (Raji, Pfeiffer, Toledo, and Nalm6) at an E:T ratio of 3:1 (n = 2 donors). D (Left) Schematic of the in vivo experiment: either 1.5 × 106 UTD or CART19 cells were infused 7 days after intravenous injection of  luciferase + Raji or lNalm6 cells. Tumor progression in mice bearing Raji (middle) or Nalm6 (right) cells is shown. E Quantification of Nalm6 fold change over 14 days in the presence of UTD, FMC63-CART19, or h1218-CART19 at low-E:T ratio model (n = 2 donors) using flow cytometry. F (Left) Schematic of the in vivo xenograft model: 0.75 × 106 UTD or CAR T cells were infused intravenously 5 days after luciferase+ Nalm6 engraftment. (Middle) Tumor progression over time in mice bearing Nalm6 cells treated with UTD (n = 3), FMC63-CART19 (n = 7), or h1218-CART19 (n = 7) measured by luminescence. Bolded lines represent the median tumor burden in the corresponding group. (Right) Tumor burden on day 42 after CART19 injection. G Overall survival in mice bearing Nalm6. H (Left) CAR T cell expansion kinetics in the peripheral blood after CART19 injection. Bolded lines represent the median CAR T expansion. (Right) Quantification of CAR T cells in the blood 14 days after CART19 injection using flow cytometry. All bar graphs and cytotoxicity curves are presented as the mean ± SEM. Student's t-test was used to compare two groups; one-way ANOVA was performed with Tukey’s correction for multiple comparisons; survival curves were compared using the log-rank (Mantel-Cox) test; **** p < 0.0001, *** p < 0.001, ** p < 0.01, and * p < 0.05. All bar graphs are presented as the mean ± SEM. All experiments were repeated at least twice
Fig. 5
Fig. 5
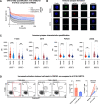
h1218-CART19 demonstrates lower avidity and less activation-induced cell death than FMC63-CART19. A Quantification of UTD, FMC63-CART19, and h1218-CART19 binding avidity to Nalm6 after 15-min co-culture (n = 2 donors) by Lumicks analysis. B Representative confocal microscopy images of F-actin, CD19, perforin, and phosphorylated-CD3ζ (pCD3ζ) (CAR) expressed in FMC63-CART19 or h1218-CART19 cells when engaged with biotinylated CD19 protein. C Quantification of F-actin, perforin polarization, and pCD3ζ in FMC63-CART19 or h1219-CART19 cells engaged with biotinylated CD19 protein (n = 2 donors). In total, 200 events were recorded for each group. D (Left) Representative flow cytometric analysis of Caspase3/7 + FMC63-CART19 and h1218-CART19 cells with and without 4-h stimulation by Nalm6. Caspase3/7 + population of CART19 cells is boxed in red. (Middle) Baseline level of Caspase3/7 + population in FMC63- or h1218-CART19 cells at 0 h. (Right) Differential increase in the Caspase3/7 + population after 4-h stimulation. All graphs are represented as the mean ± SEM. Student's t-test was used to compare two groups; one-way ANOVA was performed with Tukey’s correction for multiple comparisons; **** p < 0.0001, *** p < 0.001, ** p < 0.01, and * p < 0.05. All bar graphs are presented as the mean ± SEM. All experiments were repeated at least twice
Fig. 6
Fig. 6
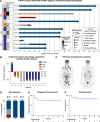
h1218-CART19 phase I clinical trial patient characteristics and response. A Swimmers' plot of individual patients with their responses to AT101 over time. Specific NHL subtype and baseline tumor burden is indicated (sum of the product of the diameters (SPD), mm2). See box legends for detail. Note: patients 7 had non-measurable disease involvement of sigmoid colon at time of AT101 infusion and patient 12 did not have a measurable target lesion after bridging therapy. B Waterfall plot depicting the change in tumor burden from baseline to the best response post-treatment for each patient. C Patient 10's PET/CT-scan before AT101 infusion and 1 month after AT101 infusion, showing complete metabolic response. D (Top) Best overall responses across all 12 patients. (Bottom) Best overall response by dose level (DL-1, DL-2, and DL-3). E Progression-free survival of patients treated with AT101. Patients at risk listed below. F Overall survival of patients treated with AT101. Patients at risk listed below
Fig. 7
Fig. 7
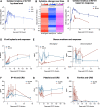
h1219-CART19 phase I clinical trial CAR T expansion, blood cell counts, and serum cytokine levels. A AT101 expansion and persistence in the blood detected by qPCR in DL-1, DL-2 and DL-3. B Mean serum levels of sFas ligand, granzyme A, or perforin across 12 patients over time by Luminex. C AT101 expansion in complete response patients (n = 9) and not complete response patients (n = 3) by qPCR. D B cell count in complete response patients (n = 9) and not complete response patients (n = 3). E (Left) sFas ligand and (right) serum amyloid A levels on day 1 pre AT101 infusion and days 2–168 post AT101 infusion in complete response patients and not-complete response patients by Luminex. F IP-10 serum level change over time in patients without CRS (n = 8) and patients with CRS (n = 4) by Luminex. G Platelet level change over time in patients without CRS (n = 8) and patients with CRS (n = 4) by Luminex. H Ferritin level change over time in patients without CRS (n = 8) and patients with CRS (n = 4)

References

    1. Schuster SJ, Tam CS, Borchmann P, Worel N, McGuirk JP, Holte H, Waller EK, Jaglowski S, Bishop MR, Damon LE, et al. Long-term clinical outcomes of tisagenlecleucel in patients with relapsed or refractory aggressive B-cell lymphomas (JULIET): a multicentre, open-label, single-arm, phase 2 study. Lancet Oncol. 2021;22:1403–1415. doi: 10.1016/S1470-2045(21)00375-2. - DOI - PubMed
    1. Lu J, Jiang G. The journey of CAR-T therapy in hematological malignancies. Mol Cancer. 2022;21:194. doi: 10.1186/s12943-022-01663-0. - DOI - PMC - PubMed
    1. Vairy S, Garcia JL, Teira P, Bittencourt H. CTL019 (tisagenlecleucel): CAR-T therapy for relapsed and refractory B-cell acute lymphoblastic leukemia. Drug Des Devel Ther. 2018;12:3885–3898. doi: 10.2147/DDDT.S138765. - DOI - PMC - PubMed
    1. Roberts ZJ, Better M, Bot A, Roberts MR, Ribas A. Axicabtagene ciloleucel, a first-in-class CAR T cell therapy for aggressive NHL. Leuk Lymphoma. 2018;59:1785–1796. doi: 10.1080/10428194.2017.1387905. - DOI - PubMed
    1. Mao R, Kong W, He Y. The affinity of antigen-binding domain on the antitumor efficacy of CAR T cells: moderate is better. Front Immunol. 2022;13:1032403. doi: 10.3389/fimmu.2022.1032403. - DOI - PMC - PubMed

Publication types

MeSH terms

Associated data