. 2023 Dec 8;21(1):286.
doi: 10.1186/s12915-023-01782-0.

Imputation strategies for genomic prediction using nanopore sequencing

Affiliations

Imputation strategies for genomic prediction using nanopore sequencing

H J Lamb et al. BMC Biol. .

Abstract

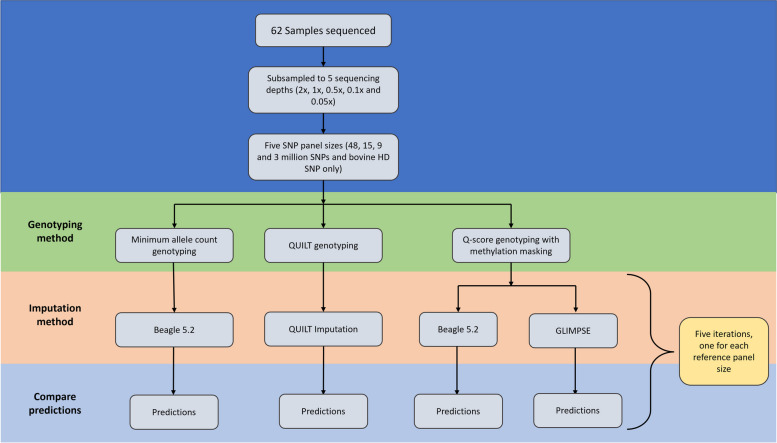
Background: Genomic prediction describes the use of SNP genotypes to predict complex traits and has been widely applied in humans and agricultural species. Genotyping-by-sequencing, a method which uses low-coverage sequence data paired with genotype imputation, is becoming an increasingly popular SNP genotyping method for genomic prediction. The development of Oxford Nanopore Technologies' (ONT) MinION sequencer has now made genotyping-by-sequencing portable and rapid. Here we evaluate the speed and accuracy of genomic predictions using low-coverage ONT sequence data in a population of cattle using four imputation approaches. We also investigate the effect of SNP reference panel size on imputation performance.

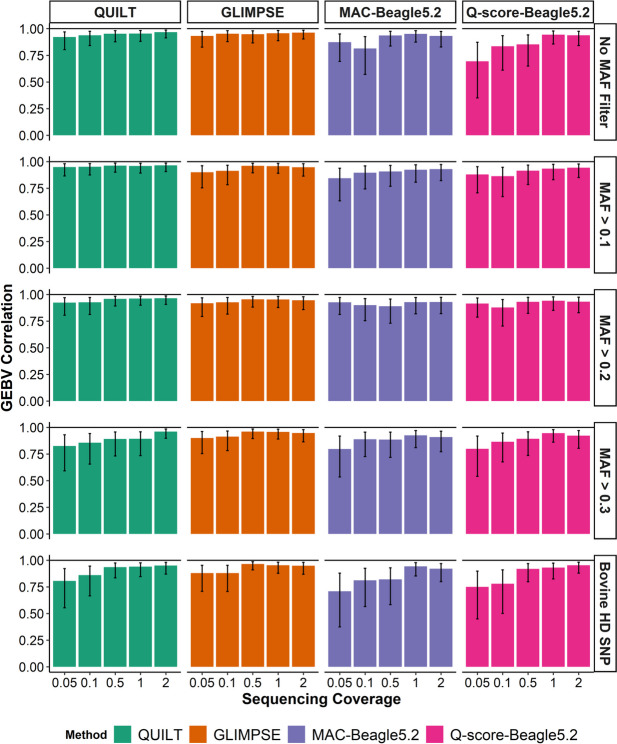
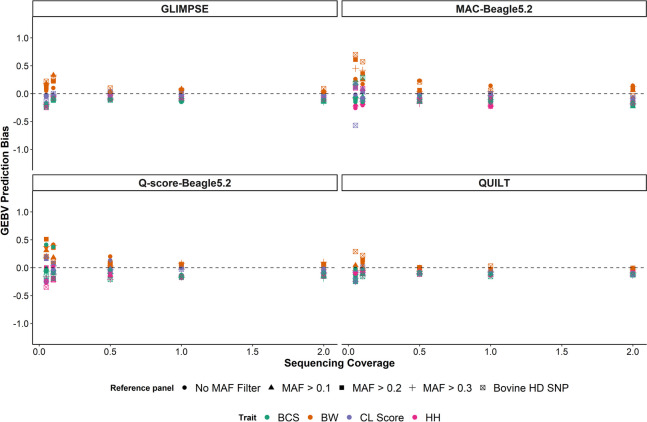
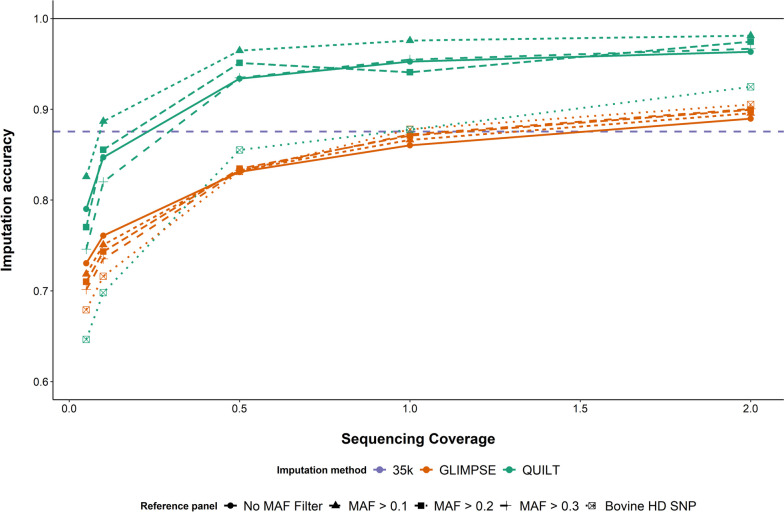
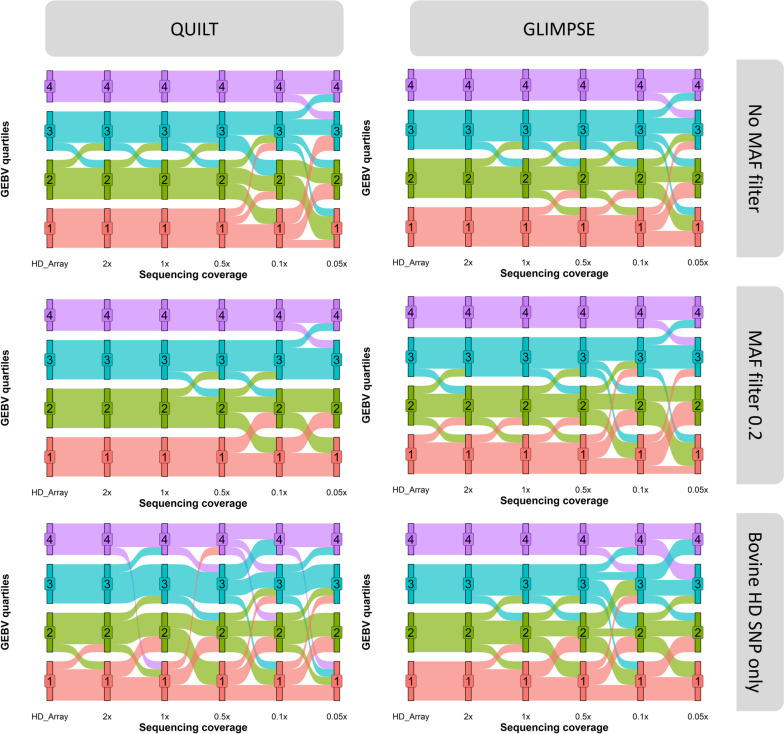
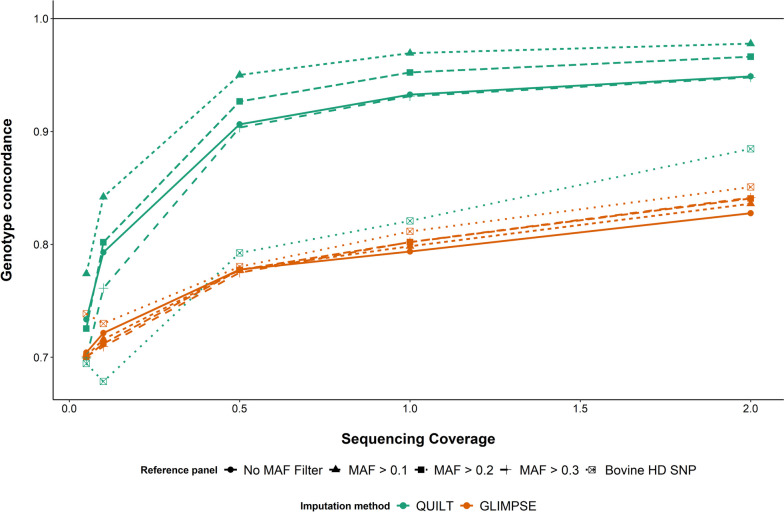
Results: SNP array genotypes and ONT sequence data for 62 beef heifers were used to calculate genomic estimated breeding values (GEBVs) from 641 k SNP for four traits. GEBV accuracy was much higher when genome-wide flanking SNP from sequence data were used to help impute the 641 k panel used for genomic predictions. Using the imputation package QUILT, correlations between ONT and low-density SNP array genomic breeding values were greater than 0.91 and up to 0.97 for sequencing coverages as low as 0.1 × using a reference panel of 48 million SNP. Imputation time was significantly reduced by decreasing the number of flanking sequence SNP used in imputation for all methods. When compared to high-density SNP arrays, genotyping accuracy and genomic breeding value correlations at 0.5 × coverage were also found to be higher than those imputed from low-density arrays.

Conclusions: Here we demonstrated accurate genomic prediction is possible with ONT sequence data from sequencing coverages as low as 0.1 × , and imputation time can be as short as 10 min per sample. We also demonstrate that in this population, genotyping-by-sequencing at 0.1 × coverage can be more accurate than imputation from low-density SNP arrays.

Keywords: Genomic prediction; Genotype imputation; Genotyping-by-sequencing; Oxford Nanopore Technologies sequencing; Skim-whole genome sequencing.


Conflict of interest statement

The authors declare that the research was conducted in the absence of any commercial or financial relationships that could be construed as a potential conflict of interest.

Figures

Fig. 1
Fig. 1
Flowchart of the genotyping and imputation methods used to generate genomic estimated breeding values from the Oxford Nanopore Technologies sequence data
Fig. 2
Fig. 2
Correlations between body weight (BW) genomic estimated breeding values (GEBV) derived from 35 k SNP array genotypes and BW GEBVs derived from Oxford Nanopore Technologies (ONT) data. ONT GEBVs were imputed using four different imputation strategies and across five sequencing coverages. Labels at the top of the figure indicate the imputation method used starting from left to right with GLIMPSE [22], minor allele count (MAC) genotyping with Beagle5.2 [18], quality score (Q-score) genotyping with Beagle5.2 and QUILT [21]. SNP reference panel size is indicated by the minor allele frequency (MAF) filter on the right-hand side in descending order of size from top to bottom. The largest panel had 48,203,338 SNP and was referred to as the No MAF filter panel, while the smallest panel was referred to as the bovine high density (HD) SNP which had only the 641 k SNP used to calculate the GEBVs. Error bars indicate 95% confidence of the Pearson correlation
Fig. 3
Fig. 3
Genomic prediction bias, defined as β1-1, where β1 is the regression coefficient of the 35 k SNP array genomic estimated breeding values ~ Oxford Nanopore Technologies derived genomic estimated breeding values, for the four different imputation approaches across the sequencing coverages for four traits: body weight (BW), body condition score (BCS), corpus luteum score (CL score) and hip height (HH). Labels at the top of each figure indicate the imputation method used starting with GLIMPSE [22], minor allele count (MAC) genotyping with Beagle5.2 [18], quality score (Q-score) genotyping with Beagle5.2 and QUILT [21]. Prediction bias was also calculated across five different SNP reference panel sizes which were created using minor allele frequency (MAF) filters from whole genome sequence SNP. The smallest SNP reference panel, the bovine high definition (HD) SNP, had only the 641 k SNP used to calculate the GEBVs
Fig. 4
Fig. 4
Mean time taken to impute the genotypes of each animal from Oxford Nanopore Technologies sequence data using four different imputation methods. Genotypes were imputed using five SNP reference panels created using minor allele frequency (MAF) filters
Fig. 5
Fig. 5
Average time taken for genotyping and imputation of all 48 million SNP in the unfiltered SNP panel from sequence alignment file using the four different methods and the five sequencing coverages. The imputation method QUILT genotyped and imputed SNP in one iteration while the other three methods used base pair position pileups to genotype and then impute missing SNP
Fig. 6
Fig. 6
Imputation accuracy for genotypes derived from low-coverage Oxford Nanopore Technologies (ONT) sequence data imputed using QUILT and GLIMPSE and compared to bovine HD SNP array genotypes. ONT genotypes were imputed across five different sequencing coverages and using five different imputation reference panels. The imputation accuracy of genotypes imputed from the low-density SNP array to the HD array density is illustrated by the green dashed line
Fig. 7
Fig. 7
A Correlations between genomic estimated breeding values (GEBVs) derived from Oxford Nanopore Technologies (ONT) sequence data and GEBVs derived from bovine HD SNP array genotypes for body weight (BW). ONT-derived GEBVs were imputed using QUILT and GLIMPSE and calculated across five coverages and five SNP panels. The different SNP reference panels were created using minor allele frequency (MAF) filters to reduce the size of the panels down from whole genome sequence SNP. The largest panel had 48,203,338 SNP and was referred to as the No MAF filter panel, while the smallest panel was referred to as the bovine high definition (HD) SNP panel and featured only the 641 k SNP used to calculate the GEBVs. SNP array genotypes were from the Illumina bovine HD SNP array. The correlation for each trait between GEBVs calculated from the 35 k GGP SNP array imputed to 700 k and GEBVs calculated from the Illumina bovine HD SNP array are indicated by the dashed line. The colour of each bar indicates how well the ONT derived GEBV accuracies compare to the 35 K SNP array accuracies. Error bars indicate 95% confidence interval of the Pearson correlation. B Genomic prediction bias for body weight (BW), defined as β2-1, where β2 is the regression coefficient of the bovine HD SNP array genomic estimated breeding value (GEBV) ~ Oxford Nanopore Technologies GEBV derived using QUILT and GLIMPSE. The prediction bias of the HD SNP array GEBVs ~ 35 k SNP array GEBVs are displayed for each trait by the dotted lines, where the colour of the line corresponds to the colour of the trait in the figure legend
Fig. 8
Fig. 8
Change in body weight genomic estimated breeding values (GEBV) quartile rankings between the HD SNP array GEBVs and GEBVs derived from five different Oxford Nanopore Technologies (ONT) sequencing coverages. ONT GEBVs were derived using either GLIMPSE or QUILT for genotype imputation. Three different imputation reference panels were used: The first reference panel included all 48 million SNP; the second reference panel used a minor allele frequency (MAF) filter of > 0.2 and had 9.5 million SNP. The third reference panel included only the 700,000 SNP in the bovine HD SNP array
Fig. 9
Fig. 9
Genotype concordance for genotypes derived from low-coverage Oxford Nanopore Technologies (ONT) sequence data imputed using GLIMPSE and QUILT. Twelve animals were sequenced twice at two separate time points and genotypes were calculated separately for each of the sequencing runs. Five different sequencing coverages were evaluated for the two different imputation methods as well as five different imputation reference panel sizes. The largest imputation reference panel used 48 million SNP, a minor allele frequency (MAF) cutoff of 0.1, 0.2 and 0.3, was used to subset the 48 million SNP reference panel down. The final imputation reference panel used only the 700 k SNP in the bovine HD SNP array

References

    1. Suratannon N, van Wijck RTA, Broer L, Xue L, van Meurs JBJ, et al. Rapid low-cost microarray-based genotyping for genetic screening in primary immunodeficiency. Front Immunol. 2020;11:614. doi: 10.3389/fimmu.2020.00614. - DOI - PMC - PubMed
    1. Gardner SN, Thissen JB, McLoughlin KS, Slezak T, Jaing CJ. Optimizing SNP microarray probe design for high accuracy microbial genotyping. J Microbiol Methods. 2013;94:303–310. doi: 10.1016/j.mimet.2013.07.006. - DOI - PubMed
    1. Yadav S, Wei X, Joyce P, Atkin F, Deomano E, et al. Improved genomic prediction of clonal performance in sugarcane by exploiting non-additive genetic effects. Theor Appl Genet. 2021;134:2235–2252. doi: 10.1007/s00122-021-03822-1. - DOI - PMC - PubMed
    1. Odegard J, Moen T, Santi N, Korsvoll SA, Kjoglum S, Meuwissen TH. Genomic prediction in an admixed population of Atlantic salmon (Salmo salar) Front Genet. 2014;5:402. - PMC - PubMed
    1. Hayes BJ, Corbet NJ, Allen JM, Laing AR, Fordyce G, et al. Towards multi-breed genomic evaluations for female fertility of tropical beef cattle. J Anim Sci. 2019;97:55–62. doi: 10.1093/jas/sky417. - DOI - PMC - PubMed

Publication types

LinkOut - more resources