. 2023 Dec 8;21(1):284.
doi: 10.1186/s12915-023-01772-2.

New chromosome-scale genomes provide insights into marine adaptations of sea snakes (Hydrophis: Elapidae)

Affiliations

New chromosome-scale genomes provide insights into marine adaptations of sea snakes (Hydrophis: Elapidae)

Alastair J Ludington et al. BMC Biol. .

Abstract

Background: Sea snakes underwent a complete transition from land to sea within the last ~ 15 million years, yet they remain a conspicuous gap in molecular studies of marine adaptation in vertebrates.

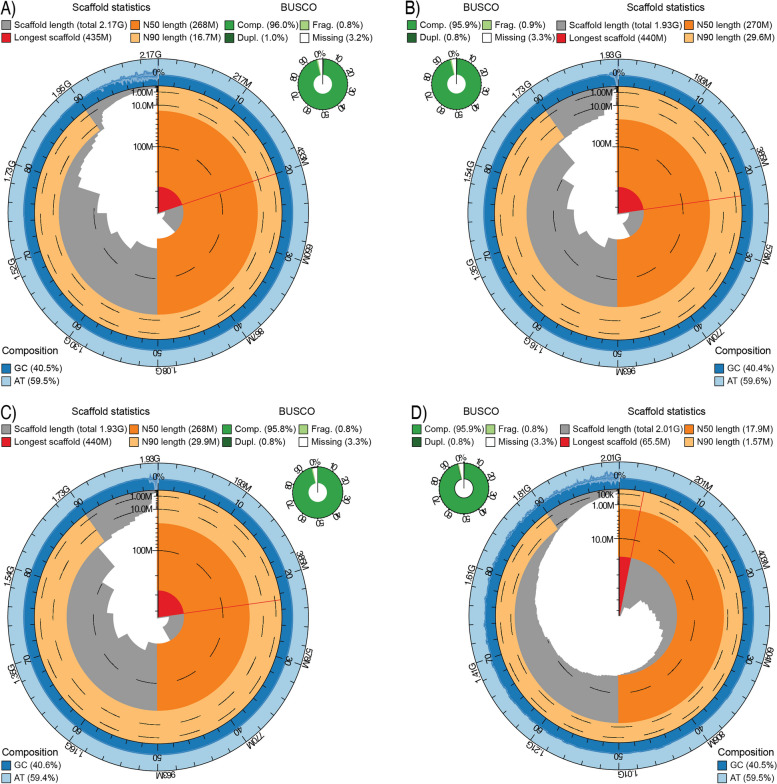
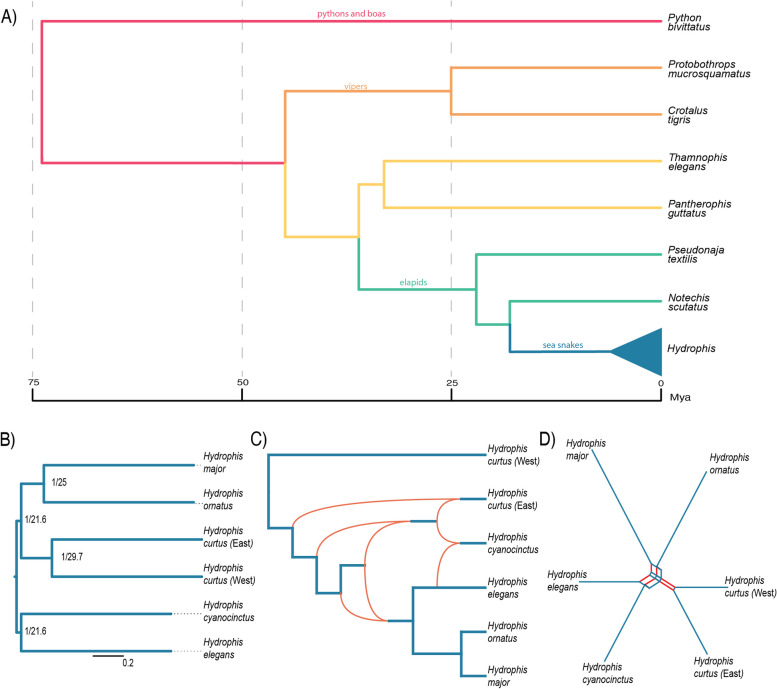
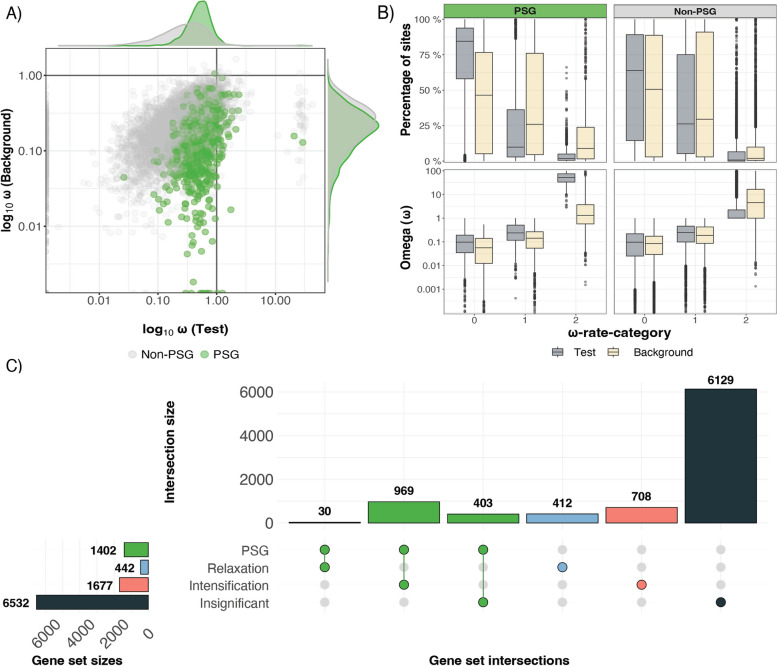
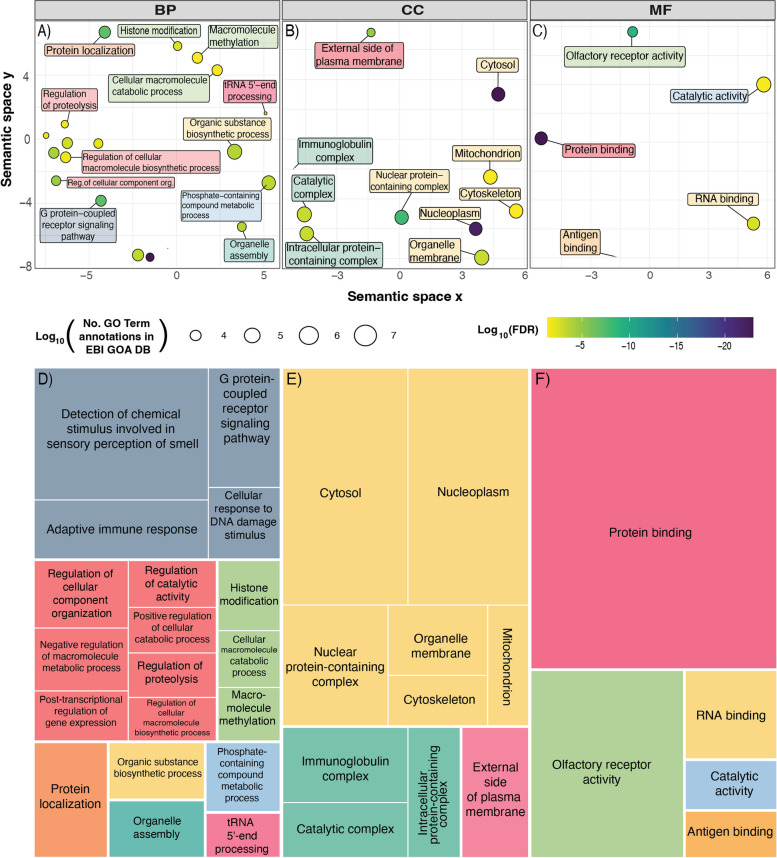
Results: Here, we generate four new annotated sea snake genomes, three of these at chromosome-scale (Hydrophis major, H. ornatus and H. curtus), and perform detailed comparative genomic analyses of sea snakes and their closest terrestrial relatives. Phylogenomic analyses highlight the possibility of near-simultaneous speciation at the root of Hydrophis, and synteny maps show intra-chromosomal variations that will be important targets for future adaptation and speciation genomic studies of this system. We then used a strict screen for positive selection in sea snakes (against a background of seven terrestrial snake genomes) to identify genes over-represented in hypoxia adaptation, sensory perception, immune response and morphological development.

Conclusions: We provide the best reference genomes currently available for the prolific and medically important elapid snake radiation. Our analyses highlight the phylogenetic complexity and conserved genome structure within Hydrophis. Positively selected marine-associated genes provide promising candidates for future, functional studies linking genetic signatures to the marine phenotypes of sea snakes and other vertebrates.

Keywords: Chromosome-scale genome; Marine adaptation; Positive selection; Sea snake; Synteny.


Conflict of interest statement

The authors declare that they have no competing interests.

Figures

Fig. 1
Fig. 1
Snail plots summarising each of the de novo assembled Hydrophis sea snakes. For each assembly, chromosomes are arranged by length clockwise around the circle, with the largest chromosome/scaffold represented by the red segment and line at the start. The dark and light orange sections represent the N50 and N90 values, respectively, while the dark and light blue rings represent the GC and AT content in the genome. BUSCO scores for each genome are presented in the green ring next to each snail plot. Facets represent A H. major, B H. ornatus, C H. curtus (West) and D H. elegans
Fig. 2
Fig. 2
Summary of repeat annotations in the four de novo repeat-annotated sea snakes. A-D PieDonut repeat-summaries for the four Hydrophis snakes: A Hydrophis major, B Hydrophis ornatus, C Hydrophis curtus (West), D Hydrophis elegans. The inner circle represents the broad classification, with the outer donut ring consisting of the sub-family percentages. E Distribution of sequence divergence between TEs in each of the four Hydrophis assemblies relative to consensus references. The x-axis is the Kimura 2-parameter sequence divergence estimate, while the y-axis is the percentage of each genome that is annotated as TEs. F Insertion ages of LTR elements in the Hydrophis snakes. The x-axis shows the estimated insertion time (mya), estimated from the divergence level and mutation rate, while the y-axis shows the count of TEs inserted at each time interval
Fig. 3
Fig. 3
Species tree inference using Hydrophis single-copy orthologs and whole-genome sequences. A Time tree of sampled taxa drawn with Archaeopteryx 0.968 beta BG using relationships and divergence times from Lee et al. [11] and Zaher et al. [27]. B Species tree inferred from Hydrophis-specific single-copy orthologs using IQ-TREE and ASTRAL-III. Node labels are in the form ML support/gene concordance factor. C PhyloNet maximum likelihood network illustrating potential ILS/Introgression signals (orange arcs) between the six Hydrophis snakes. D A SANS serif weakly compatible splits network between the six Hydrophis snakes generated from the genome assemblies. Splits between snakes are represented by the red parallel edges
Fig. 4
Fig. 4
Synteny between the five chromosome-scale Hydrophis sea snakes and Thamnophis elegans. Chromosome sequences have been reverse transcribed in some instances to correct for strand variation between assemblies to improve interpretability (see Additional file 1: Fig. S16). Inter-chromosomal rearrangements are highlighted in dark-blue, chromosome fusion/fission events are in red and the chromosome 6 and 14 fusion/fission event which alternates between each of the Hydrophis snakes is in yellow
Fig. 5
Fig. 5
Exploration of selection testing results, along with the overlap between the marine positively selected genes (PSGs) and RELAX results. A Gene-wide ω values were computed during the BUSTED-PH analysis for each gene using the MG94xREV method. The x- and y-axes show the log10 transformed ω values for Test and Background branches, respectively. B Summary of the BUSTED-PH unconstrained model results (ω ≥ 1). The first facet column represents the marine PSGs (green) and the second facet column represents non-PSGs (grey). The top row shows the percentage of sites falling into each of the three ω rate classes, while the bottom row shows the distribution of ω values in each rate-class. C UpSet plot visualising intersections between the marine PSGs and each RELAX category (intensification, relaxation, insignificant). The central interaction matrix shows the combination of gene sets, with the top bar plot representing the size of the overlap. The left horizontal bar plot represents the size of the gene sets being compared
Fig. 6
Fig. 6
REVIGO multidimensional scaling (MDS) and TreeMap plots. A-C MDS plots for the Gene ontologies BP, CC and MF, respectively. The x- and y-axes represent arbitrary values for the semantic space. GO terms that are semantically similar cluster together. The colour of the circles represents the Log10(FDR) value, while the size of the circles represent the Log10 value of the number of annotations for the GO Term in the selected species in the EBI GOA database. Point labels have been coloured to match the TreeMap figures. D-F TreeMap figures generated by REVIGO. Semantically similar terms are clustered into broad categories, with the top-left term being the representative term for the group. Colours are ontology specific and do not match across ontologies

References

    1. McGowen MR, Grossman LI, Wildman DE. Dolphin genome provides evidence for adaptive evolution of nervous system genes and a molecular rate slowdown. Proc R Soc B. 2012;279(1743):3643–3651. doi: 10.1098/rspb.2012.0869. - DOI - PMC - PubMed
    1. Sun YB, Zhou WP, Liu HQ, Irwin DM, Shen YY, Zhang YP. Genome-Wide scans for candidate genes involved in the aquatic adaptation of dolphins. Genome Biol Evol. 2013;5(1):130–139. doi: 10.1093/gbe/evs123. - DOI - PMC - PubMed
    1. Foote AD, Liu Y, Thomas GWC, Vinař T, Alföldi J, Deng J, et al. Convergent evolution of the genomes of marine mammals. Nat Genet. 2015;47(3):272–275. doi: 10.1038/ng.3198. - DOI - PMC - PubMed
    1. Chikina M, Robinson JD, Clark NL. Hundreds of Genes Experienced Convergent Shifts in Selective Pressure in Marine Mammals. Mol Biol Evol. 2016;33(9):2182–2192. doi: 10.1093/molbev/msw112. - DOI - PMC - PubMed
    1. Gayk ZG, Le Duc D, Horn J, Lindsay AR. Genomic insights into natural selection in the common loon (Gavia immer): evidence for aquatic adaptation. BMC Evol Biol. 2018;18:64. doi: 10.1186/s12862-018-1181-6. - DOI - PMC - PubMed

Publication types

LinkOut - more resources