Genome-Wide Identification and Characterization of CDPK Gene Family in Cultivated Peanut (Arachis hypogaea L.) Reveal Their Potential Roles in Response to Ca Deficiency
- PMID: 38067104
- PMCID: PMC10705679
- DOI: 10.3390/cells12232676
Genome-Wide Identification and Characterization of CDPK Gene Family in Cultivated Peanut (Arachis hypogaea L.) Reveal Their Potential Roles in Response to Ca Deficiency
Abstract
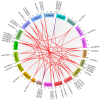
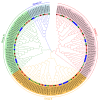
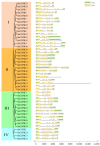
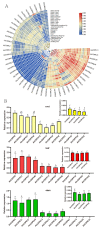
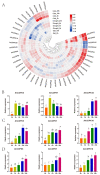
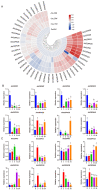
This study identified 45 calcium-dependent protein kinase (CDPK) genes in cultivated peanut (Arachis hypogaea L.), which are integral in plant growth, development, and stress responses. These genes, classified into four subgroups based on phylogenetic relationships, are unevenly distributed across all twenty peanut chromosomes. The analysis of the genetic structure of AhCDPKs revealed significant similarity within subgroups, with their expansion primarily driven by whole-genome duplications. The upstream promoter sequences of AhCDPK genes contained 46 cis-acting regulatory elements, associated with various plant responses. Additionally, 13 microRNAs were identified that target 21 AhCDPK genes, suggesting potential post-transcriptional regulation. AhCDPK proteins interacted with respiratory burst oxidase homologs, suggesting their involvement in redox signaling. Gene ontology and KEGG enrichment analyses affirmed AhCDPK genes' roles in calcium ion binding, protein kinase activity, and environmental adaptation. RNA-seq data revealed diverse expression patterns under different stress conditions. Importantly, 26 AhCDPK genes were significantly induced when exposed to Ca deficiency during the pod stage. During the seedling stage, four AhCDPKs (AhCDPK2/-25/-28/-45) in roots peaked after three hours, suggesting early signaling roles in pod Ca nutrition. These findings provide insights into the roles of CDPK genes in plant development and stress responses, offering potential candidates for predicting calcium levels in peanut seeds.
Keywords: CDPK; calcium deficiency; calcium-dependent protein kinases; cultivated peanut; gene expression; stress response.
Conflict of interest statement
The authors declare no conflict of interest.
Figures





Similar articles
-
Genome-wide identification, evolutionary and expression analysis of the cyclin-dependent kinase gene family in peanut.BMC Plant Biol. 2023 Jan 19;23(1):43. doi: 10.1186/s12870-023-04045-w. BMC Plant Biol. 2023. PMID: 36658501 Free PMC article.
-
Calcium dependent protein kinase (CDPK) expression during fruit development in cultivated peanut (Arachis hypogaea) under Ca²⁺-sufficient and -deficient growth regimens.J Plant Physiol. 2011 Dec 15;168(18):2272-7. doi: 10.1016/j.jplph.2011.07.005. Epub 2011 Sep 8. J Plant Physiol. 2011. PMID: 21862174
-
Genome-Wide Analysis of the SNARE Family in Cultivated Peanut (Arachis hypogaea L.) Reveals That Some Members Are Involved in Stress Responses.Int J Mol Sci. 2023 Apr 12;24(8):7103. doi: 10.3390/ijms24087103. Int J Mol Sci. 2023. PMID: 37108265 Free PMC article.
-
Genome-Wide Characterization of the Phenylalanine Ammonia-Lyase Gene Family and Their Potential Roles in Response to Aspergillus flavus L. Infection in Cultivated Peanut (Arachis hypogaea L.).Genes (Basel). 2024 Feb 21;15(3):265. doi: 10.3390/genes15030265. Genes (Basel). 2024. PMID: 38540324 Free PMC article.
-
Cloning and characterization of SPL-family genes in the peanut (Arachis hypogaea L.).Genet Mol Res. 2016 Feb 19;15(1). doi: 10.4238/gmr.15017344. Genet Mol Res. 2016. PMID: 26909986
Cited by
-
Genome wide identification of LcC2DPs gene family in Lotus corniculatus provides insights into regulatory network in response to abiotic stresses.Sci Rep. 2025 Apr 18;15(1):13380. doi: 10.1038/s41598-025-97896-2. Sci Rep. 2025. PMID: 40251318 Free PMC article.
-
TaCDPK1-5A positively regulates drought response through modulating osmotic stress responsive-associated processes in wheat (Triticum aestivum).Plant Cell Rep. 2024 Oct 7;43(11):256. doi: 10.1007/s00299-024-03344-2. Plant Cell Rep. 2024. PMID: 39375249
-
Comprehensive Genomic Analysis of the CDPK Gene Family in Pecan (Carya illinoinensis) and Their Potential Roles in Salt Stress Response.Plants (Basel). 2025 Feb 10;14(4):540. doi: 10.3390/plants14040540. Plants (Basel). 2025. PMID: 40006798 Free PMC article.
-
Genome wide analysis of carotenoid cleavage oxygenases (CCO) gene family in Arachis hypogaea (peanut) under biotic stress.BMC Genomics. 2024 May 14;25(1):469. doi: 10.1186/s12864-024-10351-w. BMC Genomics. 2024. PMID: 38745121 Free PMC article.
-
Identification of the AKCDPK gene family and AkCDPK15 functional analysis under drought and salt stress.PLoS One. 2025 Jun 11;20(6):e0325453. doi: 10.1371/journal.pone.0325453. eCollection 2025. PLoS One. 2025. PMID: 40498756 Free PMC article.
References
Publication types
MeSH terms
Substances
Grants and funding
LinkOut - more resources
Full Text Sources

