. 2023 Nov 25;12(23):2704.
doi: 10.3390/cells12232704.

WAVE2 Regulates Actin-Dependent Processes Induced by the B Cell Antigen Receptor and Integrins

Affiliations

WAVE2 Regulates Actin-Dependent Processes Induced by the B Cell Antigen Receptor and Integrins

Abhishek Bedi et al. Cells. .

Abstract

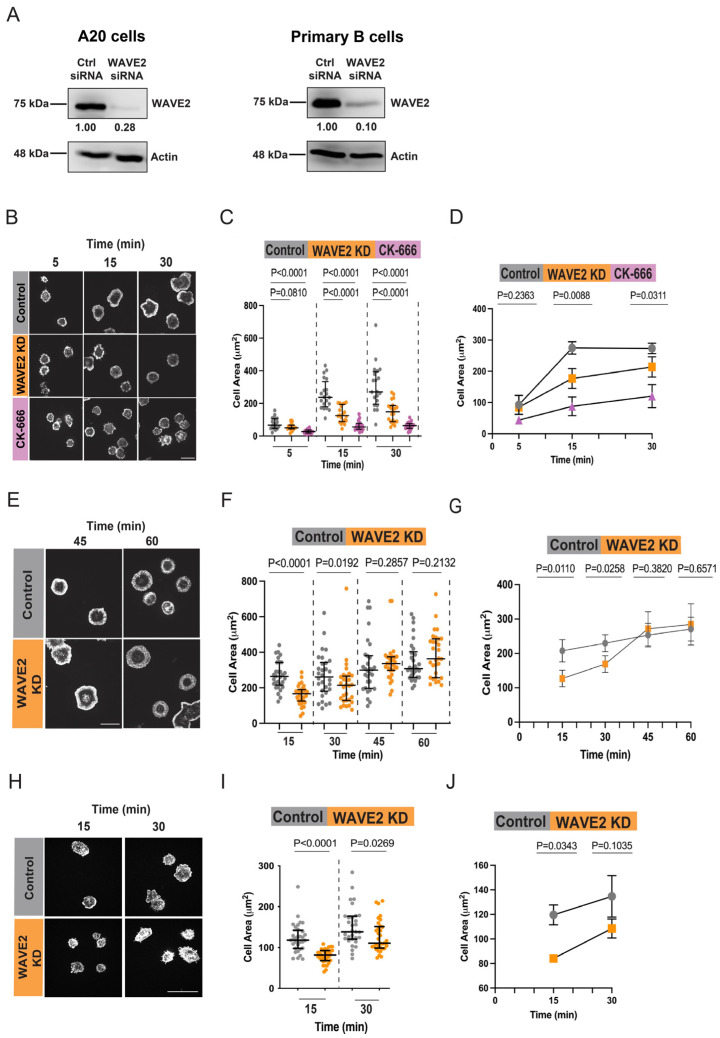
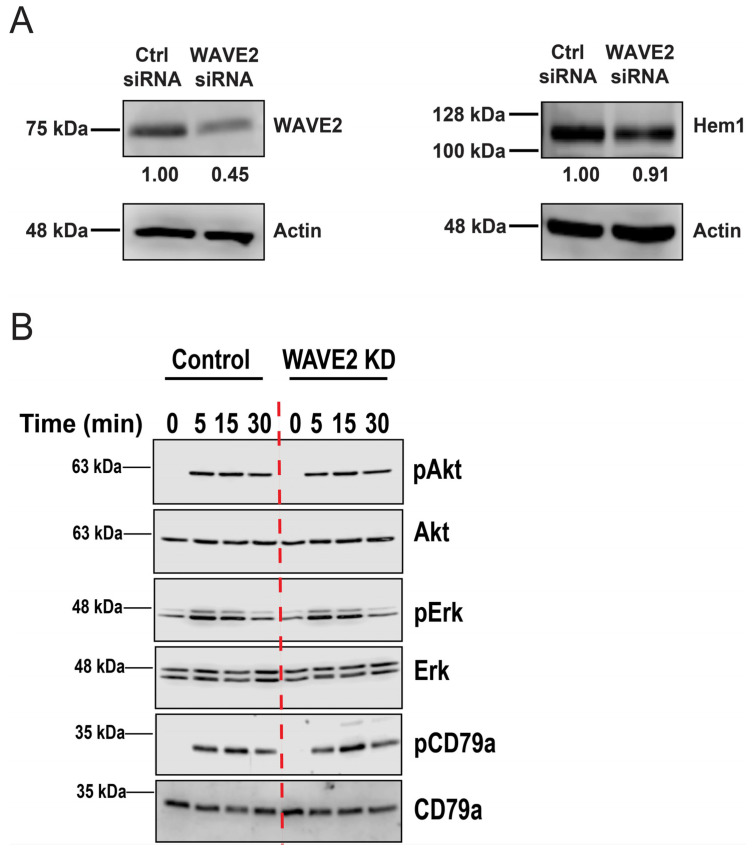
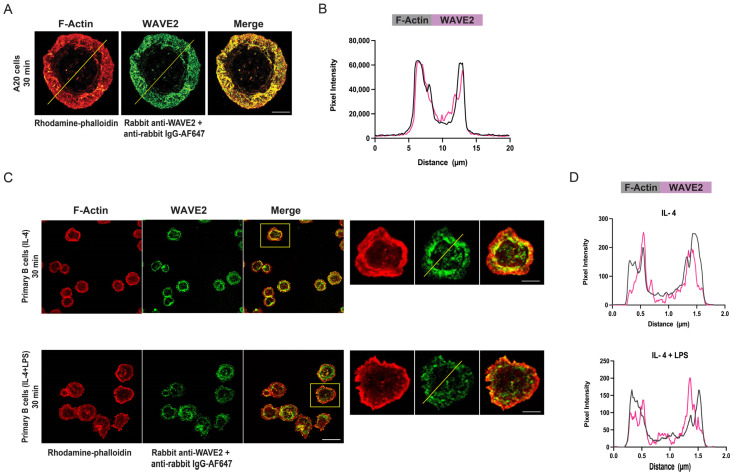
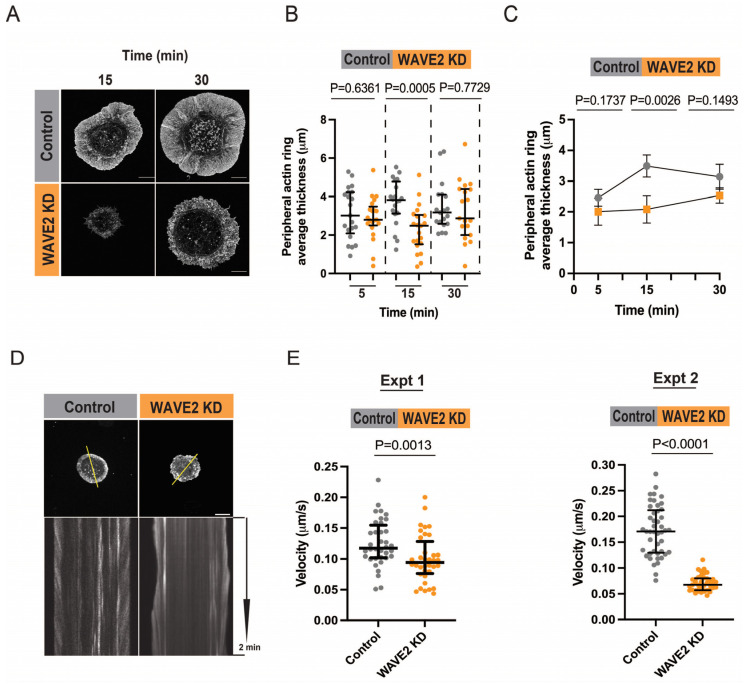
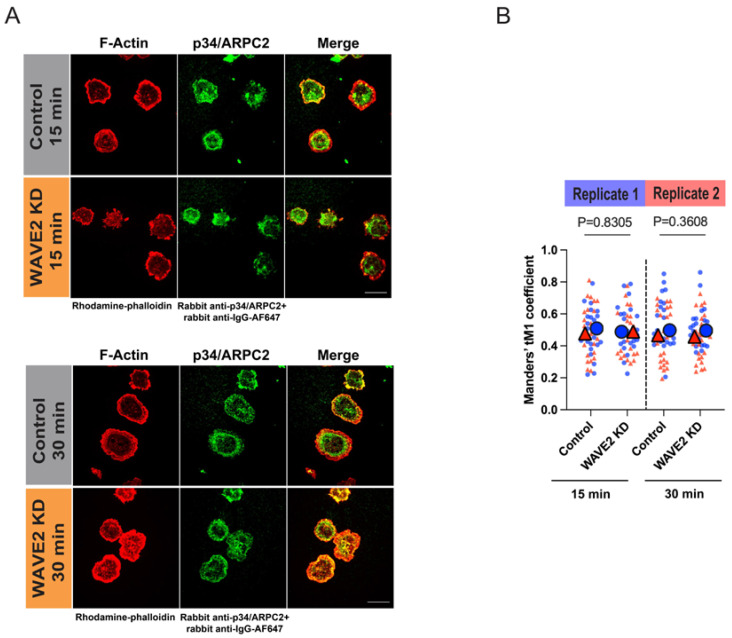
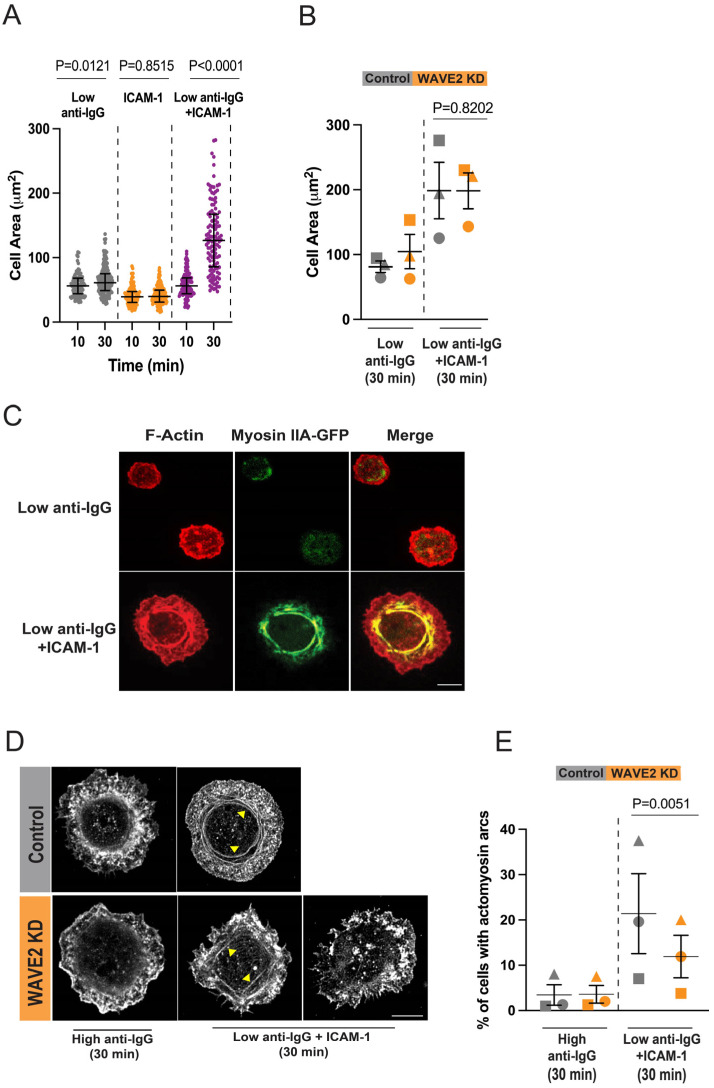
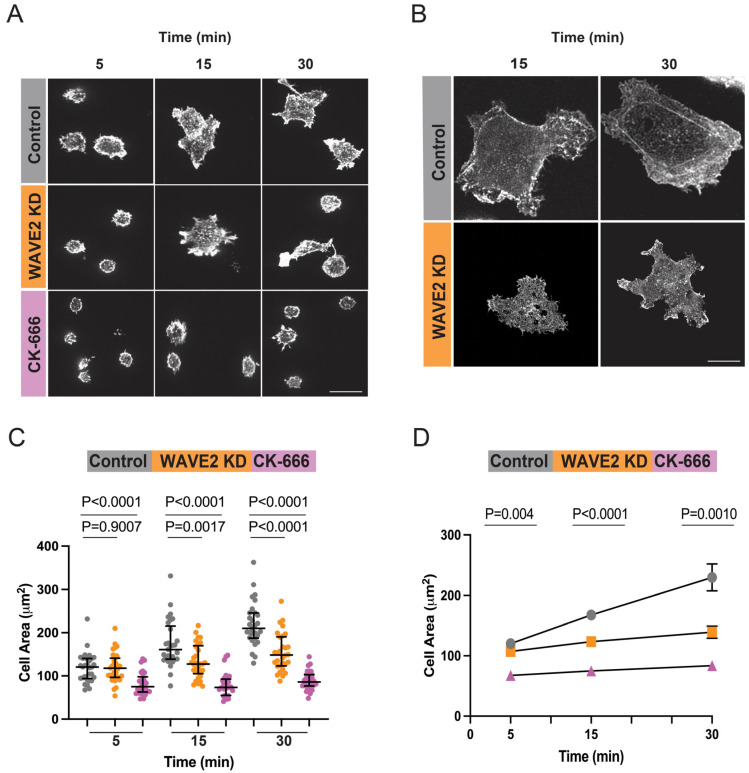
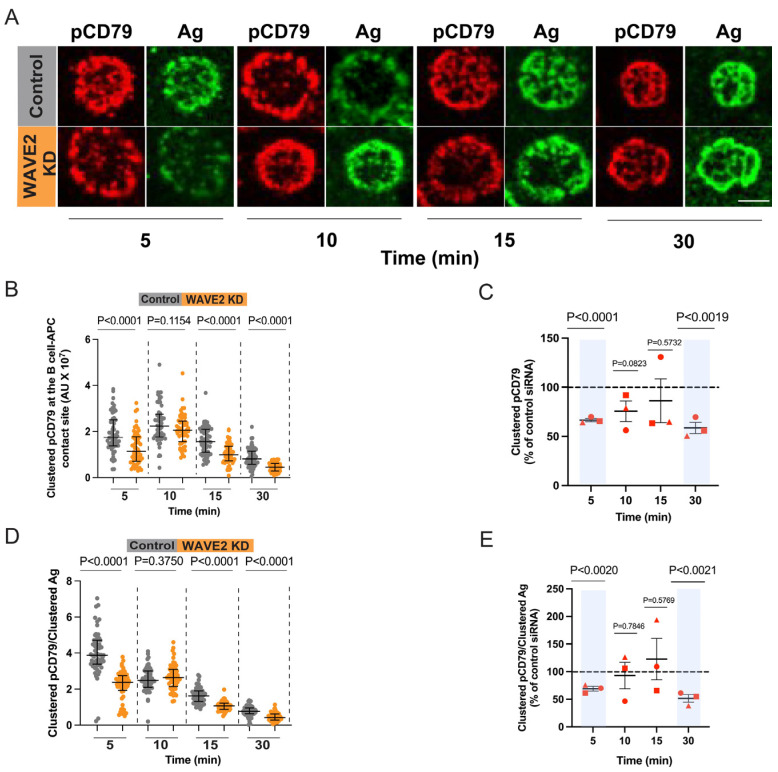
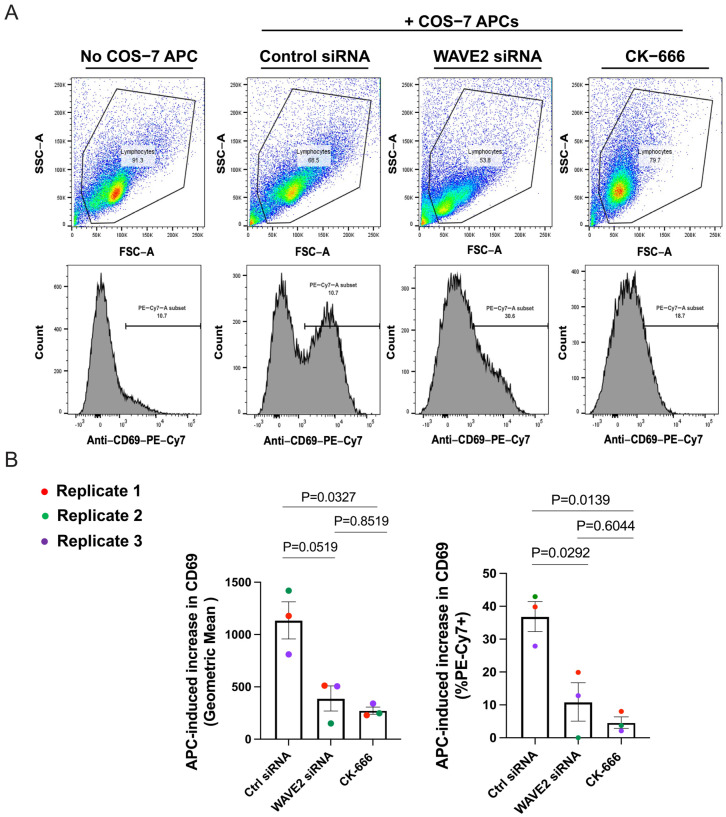
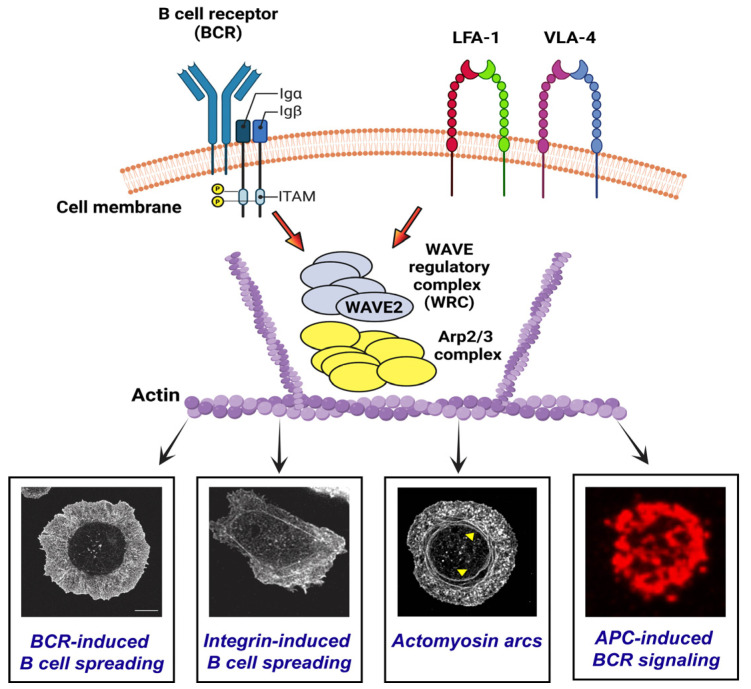
B cell antigen receptor (BCR) signaling induces actin cytoskeleton remodeling by stimulating actin severing, actin polymerization, and the nucleation of branched actin networks via the Arp2/3 complex. This enables B cells to spread on antigen-bearing surfaces in order to increase antigen encounters and to form an immune synapse (IS) when interacting with antigen-presenting cells (APCs). Although the WASp, N-WASp, and WAVE nucleation-promoting factors activate the Arp2/3 complex, the role of WAVE2 in B cells has not been directly assessed. We now show that both WAVE2 and the Arp2/3 complex localize to the peripheral ring of branched F-actin when B cells spread on immobilized anti-Ig antibodies. The siRNA-mediated depletion of WAVE2 reduced and delayed B cell spreading on immobilized anti-Ig, and this was associated with a thinner peripheral F-actin ring and reduced actin retrograde flow compared to control cells. Depleting WAVE2 also impaired integrin-mediated B cell spreading on fibronectin and the LFA-1-induced formation of actomyosin arcs. Actin retrograde flow amplifies BCR signaling at the IS, and we found that depleting WAVE2 reduced microcluster-based BCR signaling and signal amplification at the IS, as well as B cell activation in response to antigen-bearing cells. Hence, WAVE2 contributes to multiple actin-dependent processes in B lymphocytes.

Keywords: Arp2/3 complex; B cell; B cell antigen receptor (BCR); F-actin; WAVE2; antigen presenting cell (APC); cell spreading; immune synapse.


Conflict of interest statement

The authors declare no conflict of interest.

Figures

Figure 1
Figure 1
WAVE2 contributes to the ability of B cells to spread on immobilized anti-Ig. (A) A20 B-lymphoma cells and primary B cells were transfected with control siRNA or WAVE2 siRNA and analyzed via immunoblotting with Abs to WAVE2 or actin. WAVE2 band intensities were normalized to the actin loading control for the same sample and expressed relative to values for control siRNA-transfected cells. Full uncropped blots are shown in Supplementary Materials Figure S1. (BD) A20 cells were transfected with control siRNA or WAVE2 siRNA (WAVE2 KD) or pre-treated for 1 h with 100 µM CK-666. The cells were added to coverslips coated with 2.4 μg/cm2 anti-IgG for the indicated times and then stained with rhodamine-phalloidin to visualize F-actin. Representative images are shown in panel (B). Scale bars: 10 µm. Cell areas were quantified using ImageJ version 10.9.0. Panel (C) shows one of three independent experiments with similar results. Each dot is one cell, and the medians and interquartile ranges are shown for >25 cells per condition. p-values were calculated using the Mann–Whitney U test. Panel D shows combined data from 3 independent experiments. Each symbol is an individual experiment and the data are presented as the mean ± SEM for the median values from the 3 experiments. p-values were calculated using two-tailed paired t-tests. (EG) Control siRNA- and WAVE2 siRNA-transfected A20 cells were added to coverslips that had been coated with 2.4 μg/cm2 anti-IgG for the indicated times and then stained with rhodamine-phalloidin. The data are presented as in panels (BD). (HJ) Primary B cells transfected with control siRNA or WAVE2 siRNA (WAVE2 KD) were added to coverslips coated with 2.4 μg/cm2 anti-IgM for the indicated times and then stained with rhodamine-phalloidin. The data are presented as in panels (BD). All scale bars are 10 µm.
Figure 2
Figure 2
WAVE2 KD does not reduce the expression of Hem1 protein and does not affect BCR signaling in response to immobilized anti-Ig. (A) A20 cells were transfected with control siRNA or WAVE2 siRNA, cultured for 48 h, and then analyzed via immunoblotting with Abs to WAVE2, Hem1, or actin (loading control). Normalized levels of WAVE2 or Hem1 relative to control siRNA-transfected cells are shown. (B) A20 cells that had been transfected with control siRNA or WAVE2 siRNA were allowed to spread on anti-IgG-coated tissue culture wells for the indicated times before analyzing BCR signaling by immunoblotting for the phosphorylation of the CD79a ITAM (pCD79a) or the phosphorylated (activated) forms of ERK (pERK) or Akt (pAkt). The same cell lysates were probed for total CD79a, ERK, or Akt. The dashed red line was overlaid on the images of the blots to visually separate the time courses for the control siRNA and WAVE2 siRNA-transfected cells. For both panels, one of three independent experiments with similar results is shown. Full uncropped blots are shown in Supplementary Materials Figure S1.
Figure 3
Figure 3
WAVE2 localizes to the peripheral actin ring in spreading B cells. (A,B) A20 cells were allowed to spread for 30 min on coverslips coated with 2.4 μg/cm2 anti-Ig G. The cells were stained for F-actin and WAVE2 and then imaged via STED microscopy (A). Scale bar: 5 µm. Panel (B) shows F-actin and WAVE2 fluorescence intensity profiles along the yellow lines in panel (A). (C,D) Primary murine B cells that had been cultured overnight with IL-4 or with IL-4 + LPS were allowed to spread for 30 min on coverslips coated with 2.4 μg/cm2 anti-IgM. The cells were stained for F-actin and WAVE2 and imaged via confocal microscopy. Enlarged images of the cells indicated by the yellow boxes on the merge panels are shown to the right. Scale bars: 10 µm. Panel (D) shows F-actin and WAVE2 fluorescence intensity profiles along the yellow lines in the enlarged cell images in panel (C). In the plot profiles in panels (B,D), the grey lines represent F-actin fluorescence intensity and the purple lines represent WAVE2 fluorescence intensity.
Figure 4
Figure 4
WAVE2 contributes to peripheral F-actin assembly and actin retrograde flow. (A) Control siRNA- and WAVE2 siRNA-transfected A20 cells were allowed to spread on anti-IgG-coated coverslips for 15 or 30 min before being stained for F-actin and imaged via STED microscopy. Scale bar: 5 µm. (B,C) Confocal microscopy images of the control siRNA- and WAVE2 siRNA-transfected A20 cells from the experiments in Figure 1B–D were used to calculate the average peripheral actin ring thickness for each cell, as described in the Methods section. Panel (B) shows representative data from a single experiment with the median and interquartile range for >20 cells per condition. p-values were calculated using the Mann–Whitney U test. Panel (C) shows the mean ± SEM for the median values from 3 independent experiments. p-values were calculated using two-tailed paired t-tests. (D,E) A20 cells that had been co-transfected with F-tractin-GFP and either control siRNA or WAVE2 siRNA were allowed to spread for 10 min on coverslips coated with 2.4 μg/cm2 anti-IgG before initiating live-cell confocal microscopy imaging. Images were acquired at 1 s intervals for 2 min. In panel (D), representative kymographs along the yellow lines in the top panels (Scale bar: 10 µm) are shown in the bottom panels. The centripetal velocity (Δx/Δt) was calculated for individual actin tracks on the kymographs. Panel (E) shows two independent experiments in which the actin retrograde flow velocity was calculated for >10 tracks per cell for 3–6 cells. Each dot is one track. Medians and interquartile ranges are shown. The Mann–Whitney U test was used to calculate p-values.
Figure 5
Figure 5
WAVE2 KD does not reduce recruitment of the Arp2/3 complex to actin structures. Control siRNA- and WAVE2 siRNA-transfected A20 cells were allowed to spread on anti-IgG-coated coverslips for 15 or 30 min. The cells were stained for F-actin and the p34/ARPC2 subunit of the Arp2/3 complex and imaged via confocal microscopy (A) Representative images. Scale bars: 10 µm. (B) The confocal images were used to determine the Manders’ coefficient for the fraction of p34/ARPC2 that co-localized with F-actin. Super-plot showing combined data from 2 independent experiments for >25 cells per condition. Each dot is one cell and the different colors represent the two independent experiments. The large symbols represent the median values for each experiment. p-values for control cells versus WAVE2 KD cells in the combined experiments were calculated using the Mann–Whitney U test.
Figure 6
Figure 6
WAVE2 contributes to the LFA-1-dependent formation of actomyosin arcs. (A) A20 cells were allowed to spread for 10 or 30 min on coverslips coated with a suboptimal density of anti-IgG (0.625 µg/cm2), ICAM-1 (0.15 µg/cm2), or 0.625 µg/cm2 anti-IgG plus 0.15 µg/cm2 ICAM-1. The cells were stained for F-actin and cell areas were quantified from confocal microscopy images. Medians and interquartile ranges are shown for >25 cells per condition. p-values were calculated using the Mann–Whitney U test. (B) Control and WAVE2 KD A20 cells were allowed to spread for 30 min on coverslips coated with a low density of anti-IgG (0.625 µg/cm2) with or without 0.15 µg/cm2 ICAM-1. The means ± SEM for the median values from 3 independent experiments are shown. p-values were calculated using two-tailed paired t-tests. (C) A20 cells that had been transfected with a plasmid encoding myosin IIA-GFP were allowed to spread for 30 min on coverslips that had been coated with 2.4 µg/cm2 anti-IgG (high anti-IgG) or 0.625 µg/cm2 anti-IgG (low anti-IgG) plus 0.15 µg/cm2 ICAM-1. Representative images are shown. Scale bar: 10 µm. (D,E) Control siRNA- and WAVE2 siRNA-transfected A20 cells were allowed to spread for 30 min on coverslips that had been coated with 2.4 µg/cm2 anti-IgG (high anti-IgG) or 0.625 µg/cm2 anti-IgG (low anti-IgG) plus 0.15 µg/cm2 ICAM-1. Cells were stained for F-actin and imaged by STED microscopy. Representative images are shown, and the yellow arrowheads indicate actin arcs (D). For comparison, examples are shown of WAVE2 KD cells that did or did not form actin arcs when plated on low anti-IgG plus ICAM-1. Scale bar: 5 µm. In panel (E), the percent of cells that formed distinct actin arcs was determined in 3 independent experiments (n > 30 cells per condition). The data are presented as the mean ± SEM for the 3 experiments. p-values were calculated using two-tailed paired t-tests.
Figure 7
Figure 7
WAVE2 contributes to the ability of B cells to spread on FN. (A,B) A20 cells that had been transfected with either control siRNA or WAVE2 siRNA, or pre-treated for 1 h with 100 µM CK-666, were added to FN-coated coverslips. After the indicated times the cells were fixed, stained with rhodamine-phalloidin, and imaged via confocal microscopy ((A) scale bar: 10 µm) or STED microscopy ((B) scale bar: 5 µm). Representative images are shown. (C,D) In each experiment, cell areas were quantified from confocal microscopy images for >30 cells per condition. A single representative experiment (C) as well as combined data from 3 independent experiments (D) are shown. The data are presented in as Figure 1. In panel (D), p-values were calculated for the control cells versus WAVE2 KD cells using two-tailed paired t-tests. Where no error bars were visible, they were smaller than the symbols.
Figure 8
Figure 8
WAVE2 enhances APC-induced BCR signaling and signal amplification. Control siRNA- and WAVE2 siRNA-transfected A20 cells were added to COS-7 cells expressing the ani-Igκ surrogate Ag on their surface. After 5–30 min, the cells were fixed, permeabilized, and stained for pCD79 and the surrogate Ag. (A) Representative confocal images of clustered Ag and proximal BCR signaling (pCD79) at the B cell-COS-7 cell contact site. Scale bar: 10 µm. (BE) For each B cell, the total amount of clustered pCD79 (panels B,C) and clustered Ag were quantified for >50 cells per condition and were used to determine the ratio of clustered pCD79/clustered Ag (signal amplification; panels D,E). Panels (B,D) show the data from the same representative experiment. Each dot is one cell, and the medians and interquartile ranges are shown. p-values were determined using the Mann–Whitney U test. Panels (C,E) show combined data from 3 independent experiments. Each red symbol is an individual experiment, and the data are presented as the mean ± SEM for the median values from the 3 experiments. p-values were calculated using two-tailed paired t-tests. In panels (C,E) the dashed lines represent the values for control cells, which were defined as 100%, and the areas shaded in blue highlight time points for which the values for WAVE2 KD cells were significantly different (p < 0.005) from those for the control cells.
Figure 9
Figure 9
WAVE2 is important for APC-induced B cell activation. Control siRNA- and WAVE2 siRNA-transfected primary B cells, as well as primary B cells that had been treated with CK-666 for 1 h, were added to COS-7 cells expressing the anti-Igκ surrogate Ag. The cells were co-cultured overnight before being stained for CD69 and IgM and analyzed via flow cytometry. (A) After gating on IgM+ cells, forward/side scatter (top row) was used to identify single live B cells and quantify their CD69 fluorescence (bottom row). (B) The surrogate APC-induced increase in cell surface CD69 levels (left panel; geometric means) and percent CD69+ cells were calculated by subtracting the values for unstimulated B cells that were cultured without anti-Igκ-expressing COS-7 cells. Each colored dot is an independent experiment. The data are presented as the mean + SEM for the 3 experiments. p-values were calculated using the One-Way repeated measures ANOVA test.
Figure 10
Figure 10
WAVE2 regulates B cell responses. By activating the Arp2/3 complex, the WAVE2-containing WRC contributes to the BCR- and integrin-induced actin remodeling that promotes cell spreading, actomyosin arc formation, and APC-induced BCR signaling. Created with BioRender [79]. The red arrows represent downstream signaling from the BCR and integrins. For the images at the bottom of the figure, the integrin-induced spreading image is taken from Figure 7B, the image showing actomyosin arcs is taken from Figure 6D (the yellow arrowheads point to the actomyosin arcs), and the image for APC-induced BCR signaling is taken from Figure 8A.

Similar articles

Cited by

References

    1. Abraham L., Wang J.C., Bolger-Munro M., Gold M.R. Structure, function, and spatial organization of the B cell receptor. In: Ratcliffe M.J.H., editor. Encyclopedia of Immunobiology. Volume 2. Elsivier; Amsterdam, The Netherlands: 2016. pp. 40–54. - DOI
    1. Shen P., Fillatreau S. Antibody-independent functions of B cells: A focus on cytokines. Nat. Rev. Immunol. 2015;15:441–451. doi: 10.1038/nri3857. - DOI - PubMed
    1. Kwak K., Akkaya M., Pierce S.K. B cell signaling in context. Nat. Immunol. 2019;20:963–969. doi: 10.1038/s41590-019-0427-9. - DOI - PubMed
    1. Kurosaki T., Shinohara H., Baba Y. B cell signaling and fate decision. Annu. Rev. Immunol. 2010;28:21–55. doi: 10.1146/annurev.immunol.021908.132541. - DOI - PubMed
    1. Fleire S.J., Goldman J.P., Carrasco Y.R., Weber M., Bray D., Batista F.D. B cell ligand discrimination through a spreading and contraction response. Science. 2006;312:738–741. doi: 10.1126/science.1123940. - DOI - PubMed

Publication types

MeSH terms

Substances

Grants and funding

LinkOut - more resources