

Comparative Transcriptome Analysis Identifies Desmoglein-3 as a Potential Oncogene in Oral Cancer Cells
- PMID: 38067138
- PMCID: PMC10705960
- DOI: 10.3390/cells12232710
Comparative Transcriptome Analysis Identifies Desmoglein-3 as a Potential Oncogene in Oral Cancer Cells
Abstract
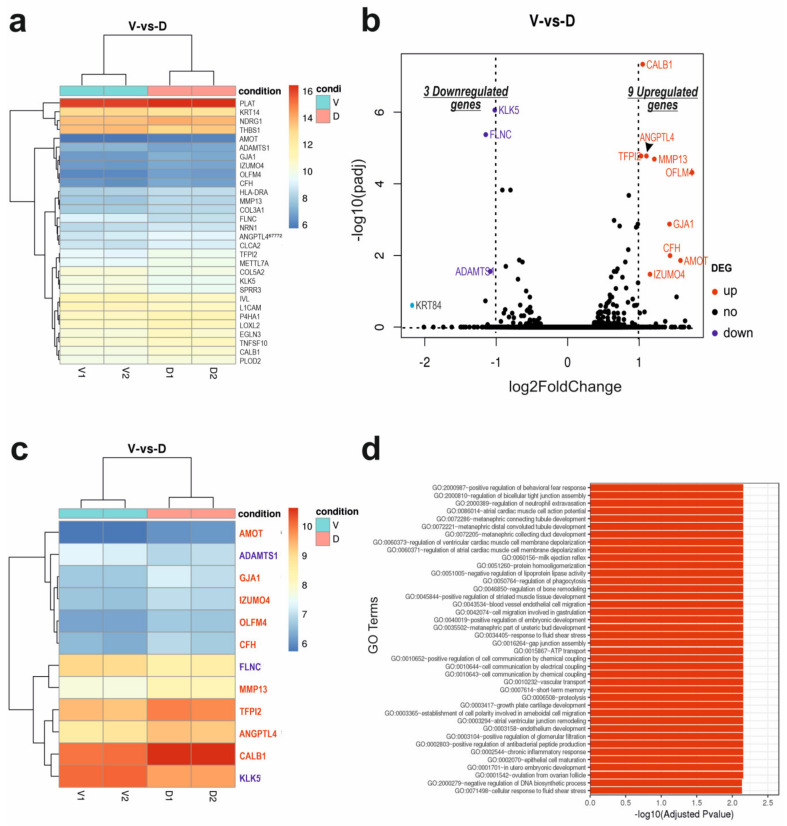
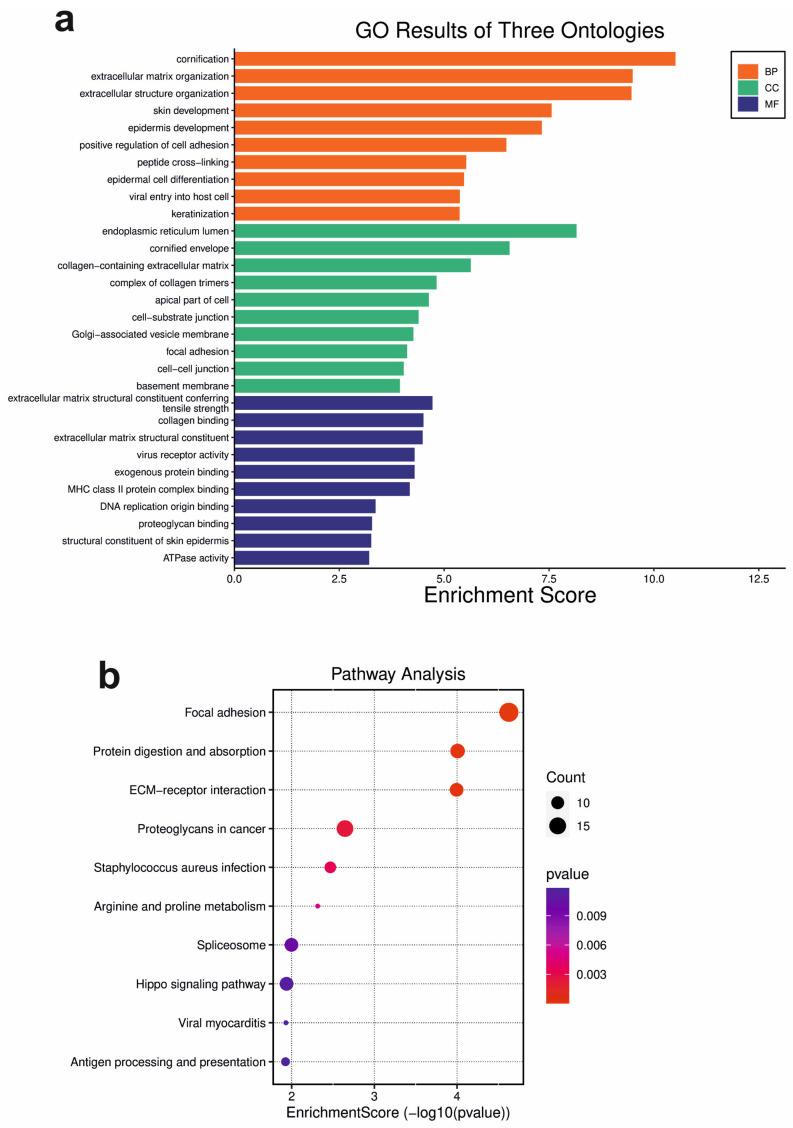
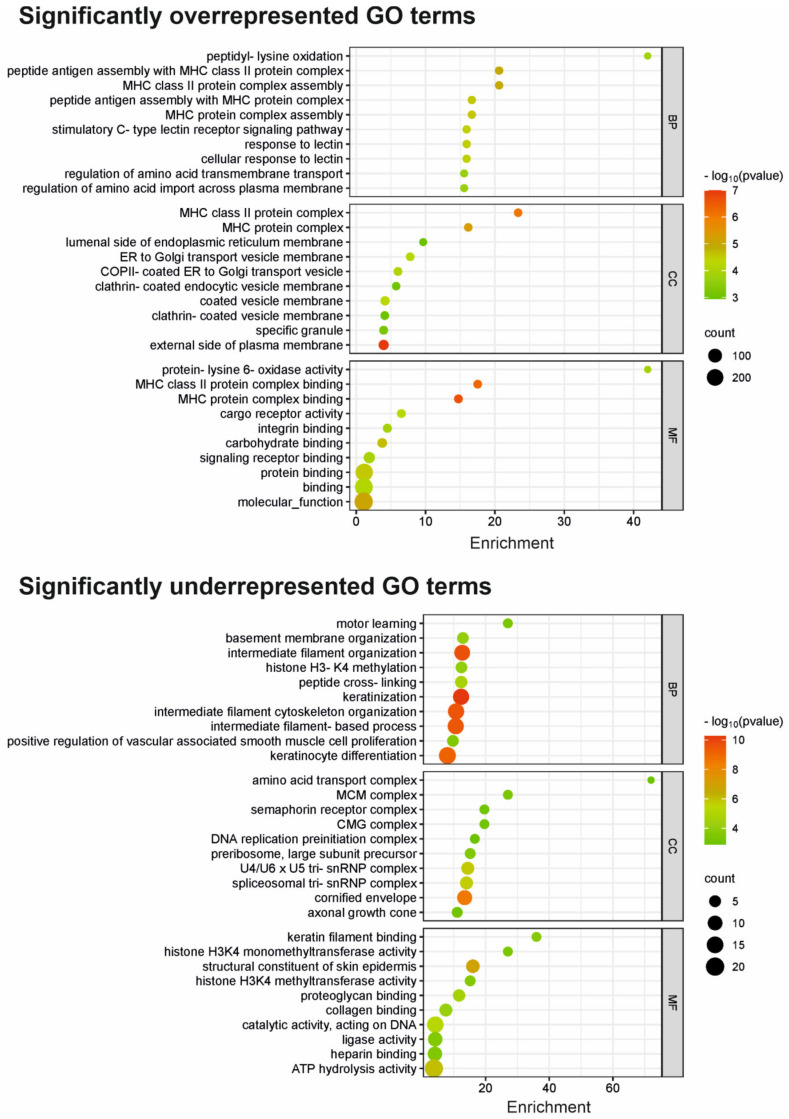
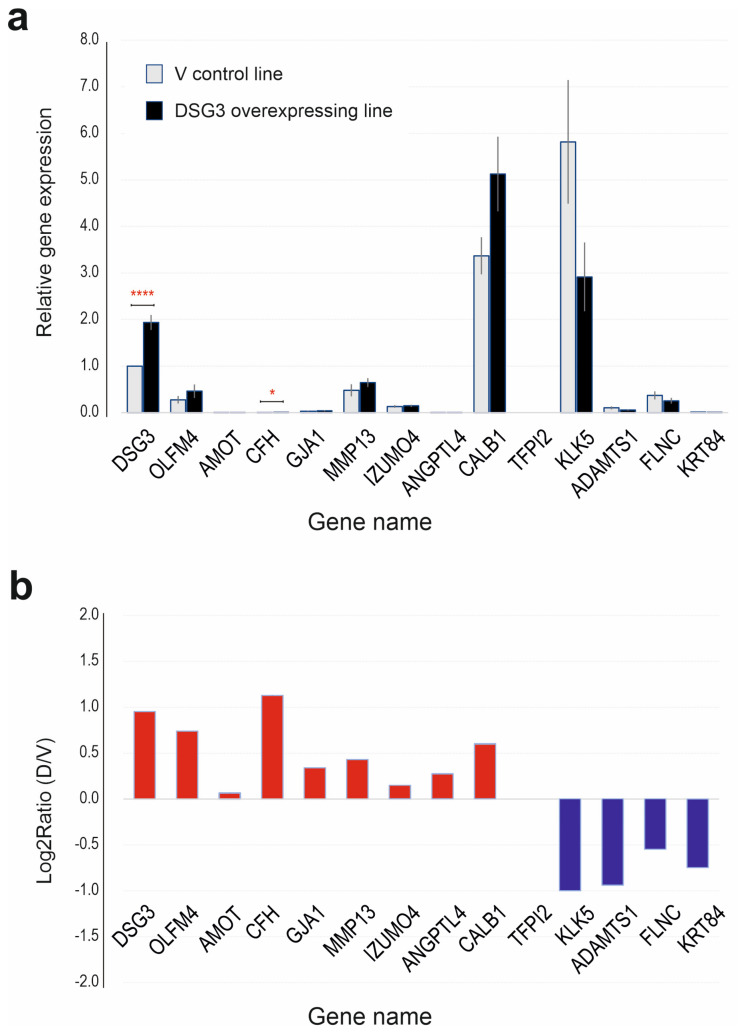
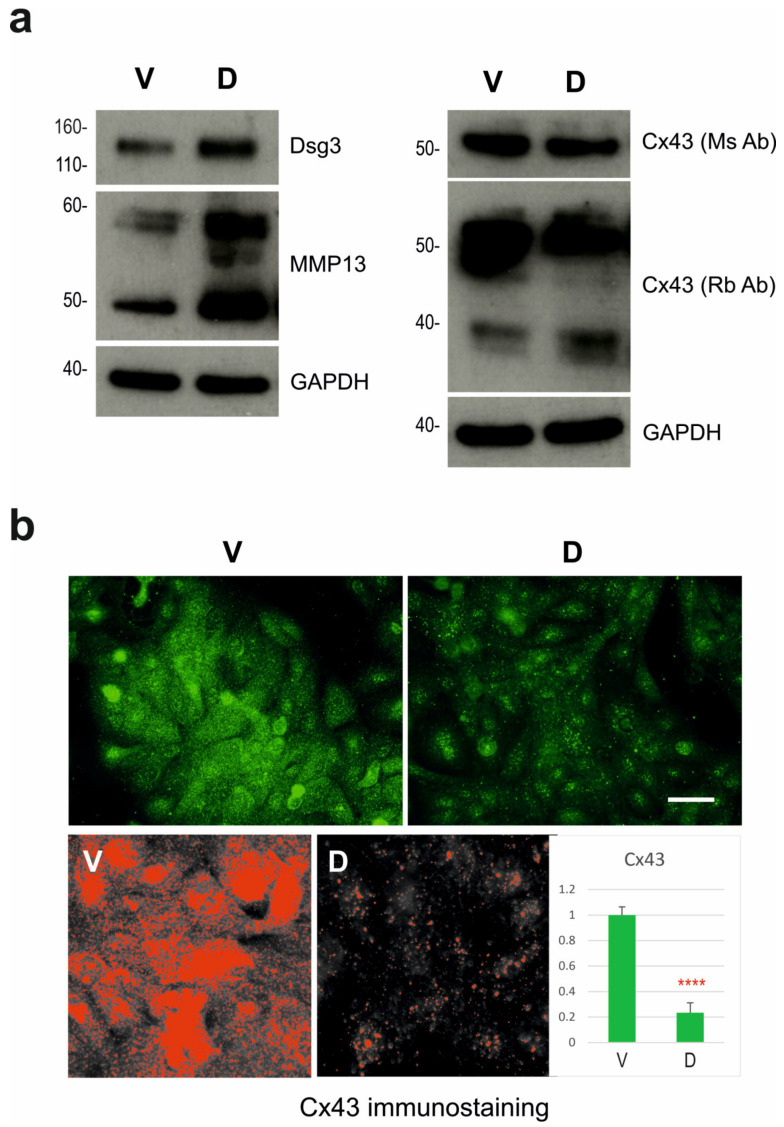
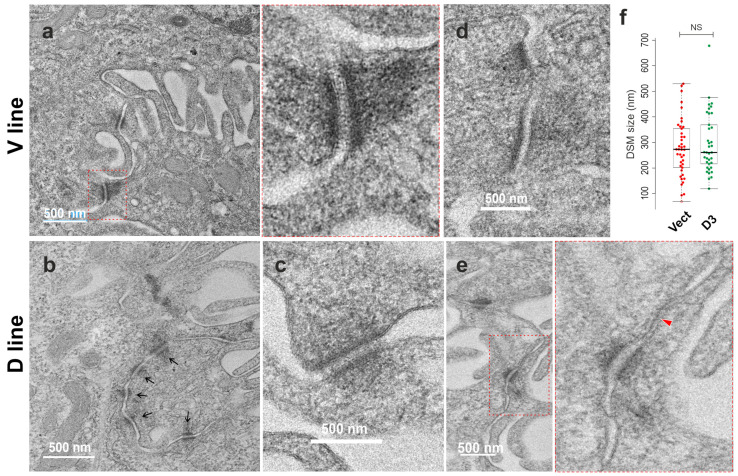
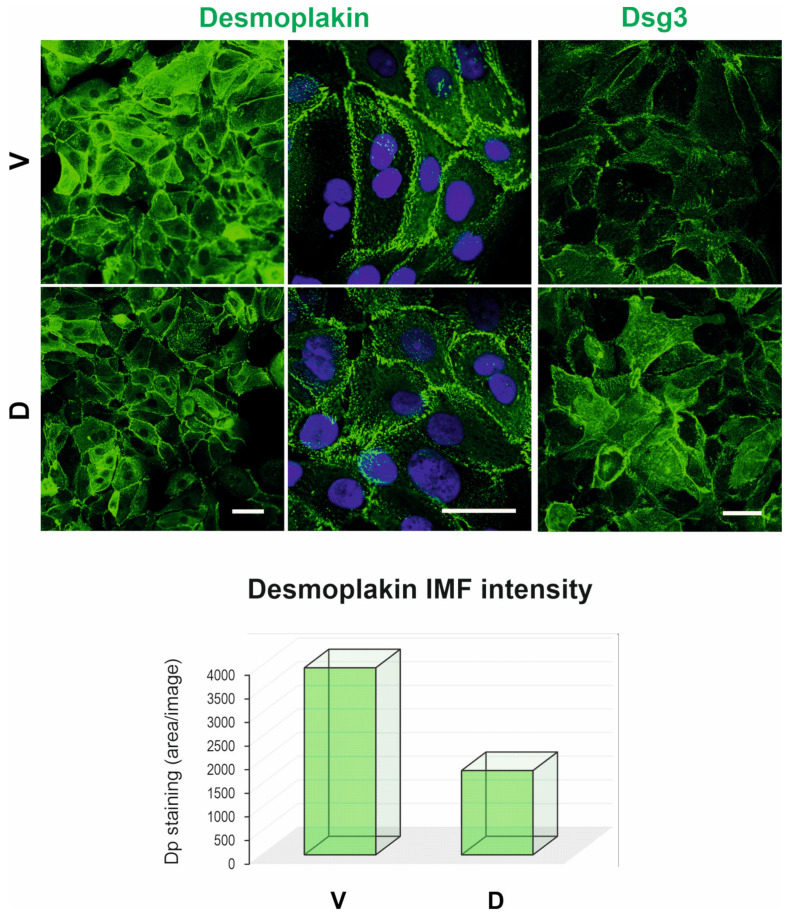
The role of desmoglein-3 (DSG3) in oncogenesis is unclear. This study aimed to uncover molecular mechanisms through comparative transcriptome analysis in oral cancer cells, defining potential key genes and associated biological processes related to DSG3 expression. Four mRNA libraries of oral squamous carcinoma H413 cell lines were sequenced, and 599 candidate genes exhibited differential expression between DSG3-overexpressing and matched control lines, with 12 genes highly significantly differentially expressed, including 9 upregulated and 3 downregulated. Genes with known implications in cancer, such as MMP-13, KRT84, OLFM4, GJA1, AMOT and ADAMTS1, were strongly linked to DSG3 overexpression. Gene ontology analysis indicated that the DSG3-associated candidate gene products participate in crucial cellular processes such as junction assembly, focal adhesion, extracellular matrix formation, intermediate filament organisation and keratinocyte differentiation. Validation of RNA-Seq was performed through RT-qPCR, Western blotting and immunofluorescence analyses. Furthermore, using transmission electron microscopy, we meticulously examined desmosome morphology and revealed a slightly immature desmosome structure in DSG3-overexpressing cells compared to controls. No changes in desmosome frequency and diameter were observed between the two conditions. This study underscores intricate and multifaceted alterations associated with DSG3 in oral squamous carcinoma cells, implying a potential oncogenic role of this gene in biological processes that enable cell communication, motility and survival.
Keywords: GJA1; MMP-13; RNA-Seq; bioinformatics; desmoglein-3; desmosomes; oral squamous carcinoma cells; transmission electron microscopy.
Conflict of interest statement
The authors declare no conflict of interest.
Figures
Similar articles
-
Evidence for the Desmosomal Cadherin Desmoglein-3 in Regulating YAP and Phospho-YAP in Keratinocyte Responses to Mechanical Forces.Int J Mol Sci. 2019 Dec 10;20(24):6221. doi: 10.3390/ijms20246221. Int J Mol Sci. 2019. PMID: 31835537 Free PMC article.
-
Desmoglein 2 compensates for desmoglein 3 but does not control cell adhesion via regulation of p38 mitogen-activated protein kinase in keratinocytes.J Biol Chem. 2014 Jun 13;289(24):17043-53. doi: 10.1074/jbc.M113.489336. Epub 2014 Apr 29. J Biol Chem. 2014. PMID: 24782306 Free PMC article.
-
A molecular study of desmosomes identifies a desmoglein isoform switch in head and neck squamous cell carcinoma.J Oral Pathol Med. 2011 Jan;40(1):67-76. doi: 10.1111/j.1600-0714.2010.00951.x. Epub 2010 Oct 4. J Oral Pathol Med. 2011. PMID: 20923451
-
Desmoglein 3, its pathogenecity and a possibility for therapeutic target in pemphigus vulgaris.Expert Opin Ther Targets. 2013 Mar;17(3):293-306. doi: 10.1517/14728222.2013.744823. Epub 2013 Jan 8. Expert Opin Ther Targets. 2013. PMID: 23294403 Review.
-
150(th) anniversary series: Desmosomes and autoimmune disease, perspective of dynamic desmosome remodeling and its impairments in pemphigus.Cell Commun Adhes. 2014 Dec;21(6):269-80. doi: 10.3109/15419061.2014.943397. Epub 2014 Jul 31. Cell Commun Adhes. 2014. PMID: 25078507 Review.
Cited by
-
DSG3 promotes bladder cancer growth and metastasis via AKT/GSK3β/β-catenin pathway.J Transl Med. 2025 Jul 2;23(1):729. doi: 10.1186/s12967-025-06754-2. J Transl Med. 2025. PMID: 40605005 Free PMC article.
-
Circulating Antibodies Against DSG1 and DSG3 in Patients with Oral Lichen Planus: A Scoping Review.Antibodies (Basel). 2025 Jun 18;14(2):51. doi: 10.3390/antib14020051. Antibodies (Basel). 2025. PMID: 40558105 Free PMC article. Review.
-
Single-cell RNA seq data analysis reveals molecular markers and possible treatment targets for laryngeal squamous cell carcinoma (LSCC): an in-silico approach.In Silico Pharmacol. 2025 Jun 17;13(2):89. doi: 10.1007/s40203-025-00382-w. eCollection 2025. In Silico Pharmacol. 2025. PMID: 40539082
References
-
- Chen Y.J., Lee L.Y., Chao Y.K., Chang J.T., Lu Y.C., Li H.F., Chiu C.C., Li Y.C., Li Y.L., Chiou J.F., et al. DSG3 facilitates cancer cell growth and invasion through the DSG3-plakoglobin-TCF/LEF-Myc/cyclin D1/MMP signaling pathway. PLoS ONE. 2013;8:e64088. doi: 10.1371/journal.pone.0064088. - DOI - PMC - PubMed
-
- Cheng J., Yang J., Xue K., Zhao Y., Zhao C., Li S., Wang Z. Desmoglein 3 Silencing Inhibits Inflammation and Goblet Cell Mucin Secretion in a Mouse Model of Chronic Rhinosinusitis via Disruption of the Wnt/beta-Catenin Signaling Pathway. Inflammation. 2019;42:1370–1382. doi: 10.1007/s10753-019-00998-z. - DOI - PubMed
MeSH terms
Substances
LinkOut - more resources
Full Text Sources
Medical
Miscellaneous
