. 2023 Nov 28;12(23):2723.
doi: 10.3390/cells12232723.

Antifibrotic Effect of Selenium-Containing Nanoparticles on a Model of TAA-Induced Liver Fibrosis

Affiliations

Antifibrotic Effect of Selenium-Containing Nanoparticles on a Model of TAA-Induced Liver Fibrosis

Elena G Varlamova et al. Cells. .

Abstract

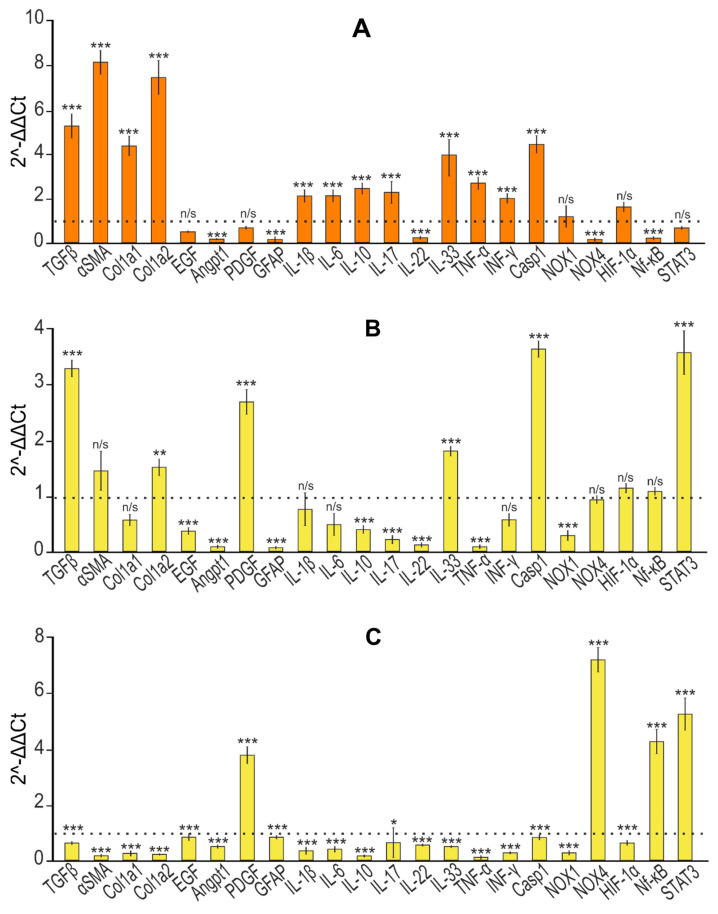
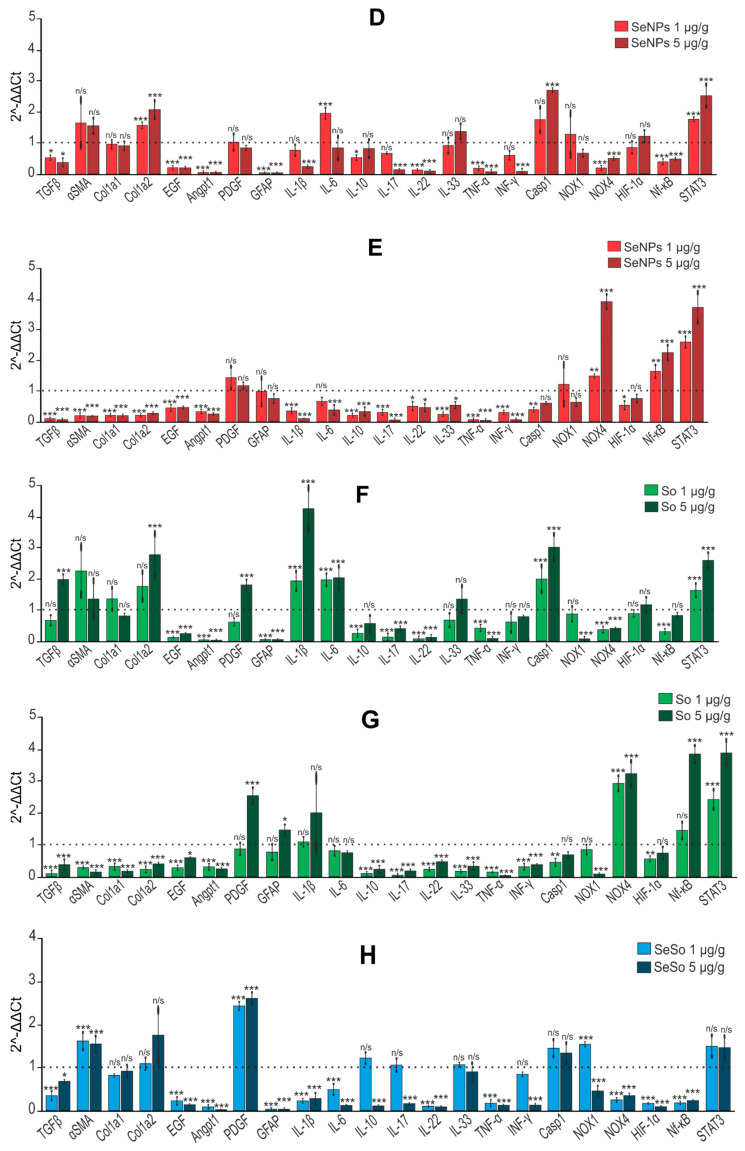
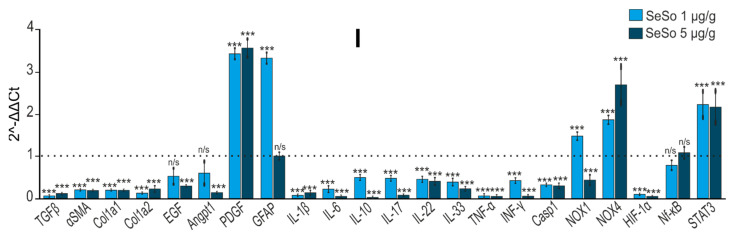
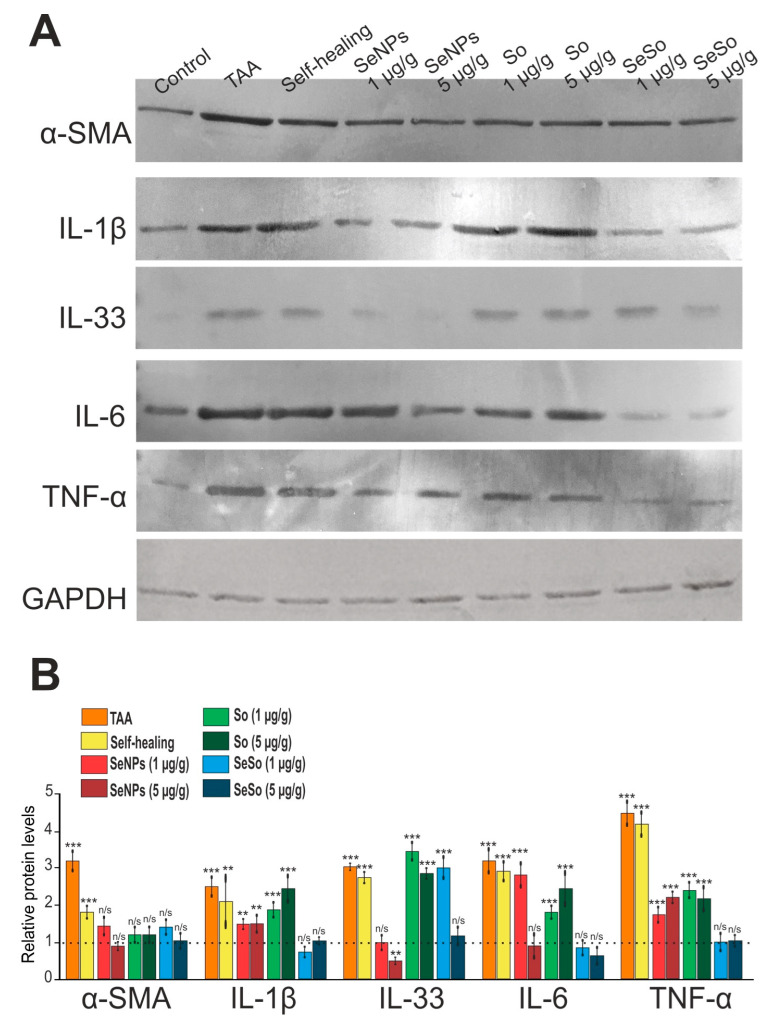
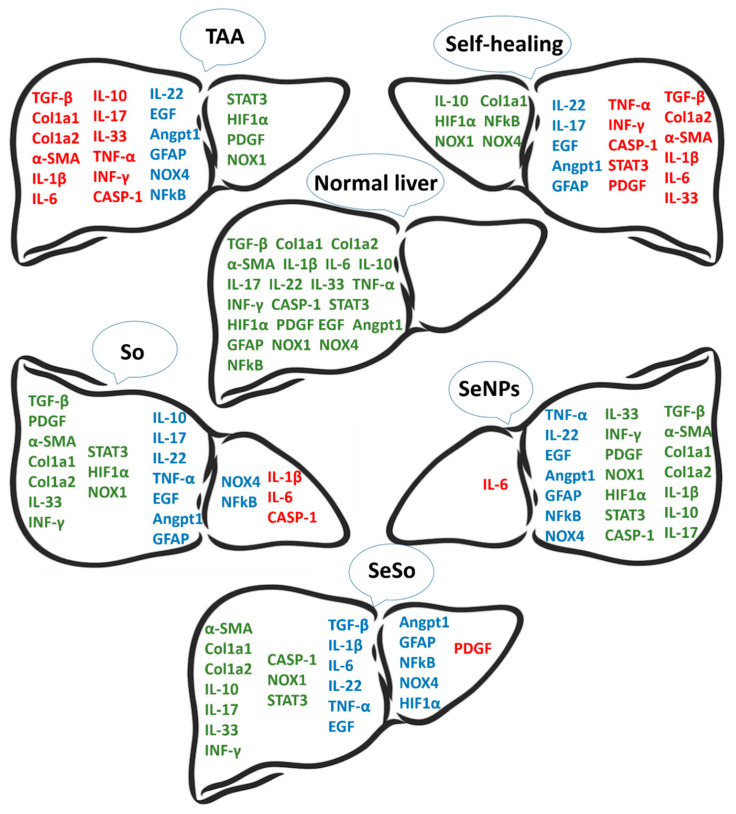
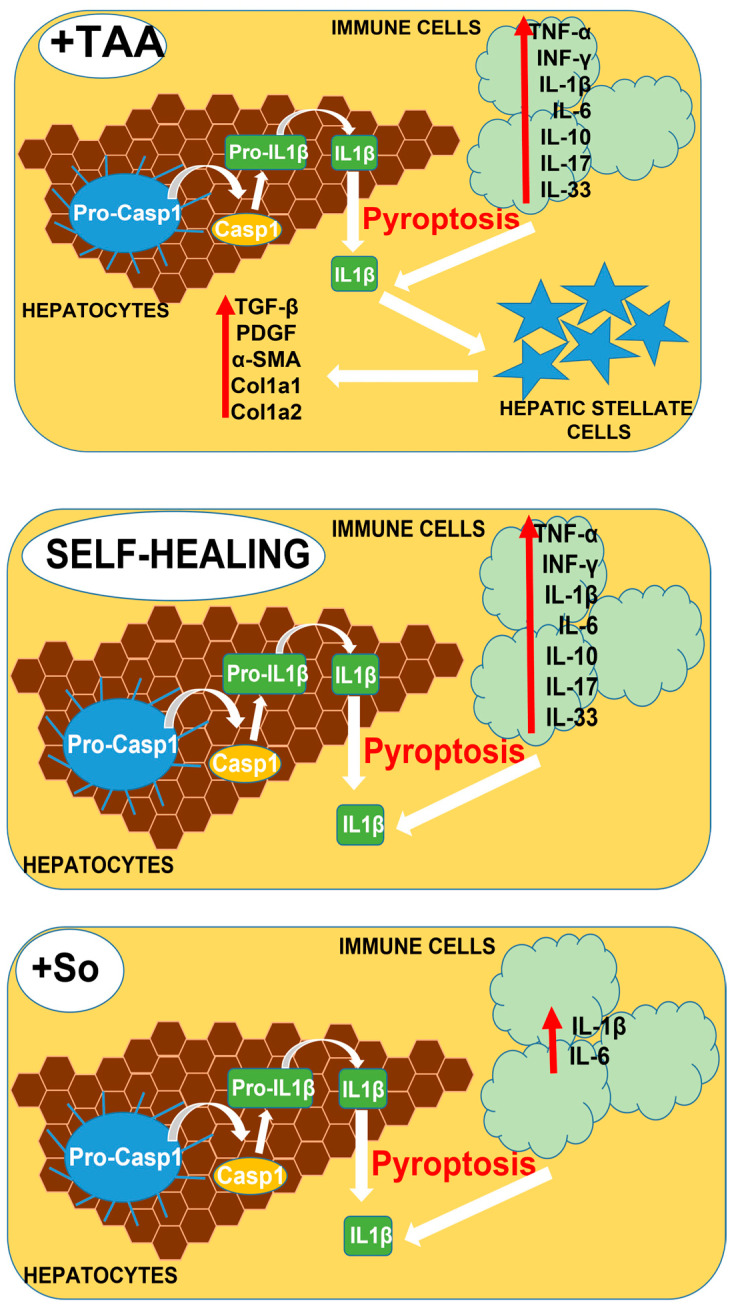
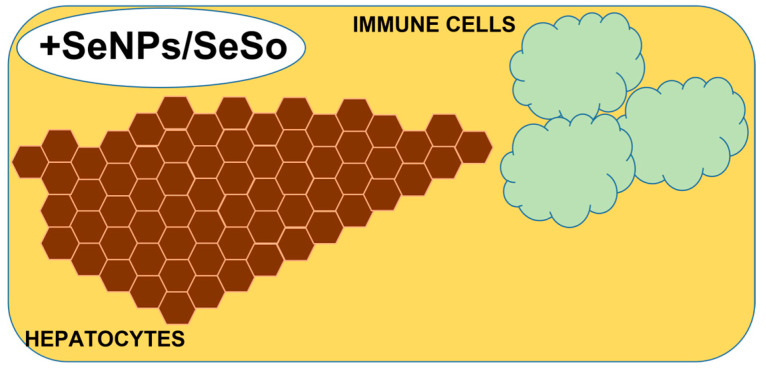
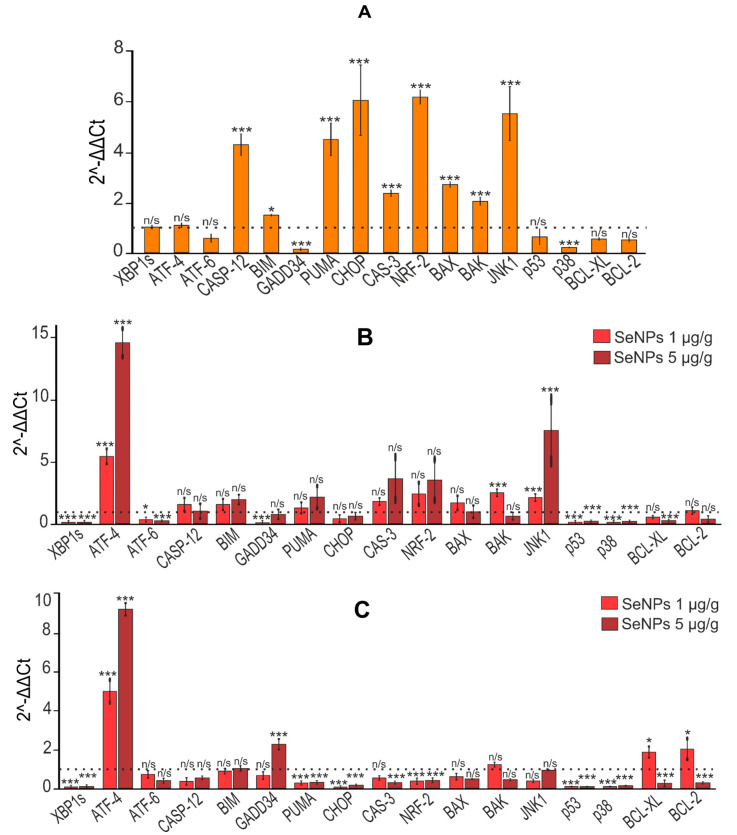
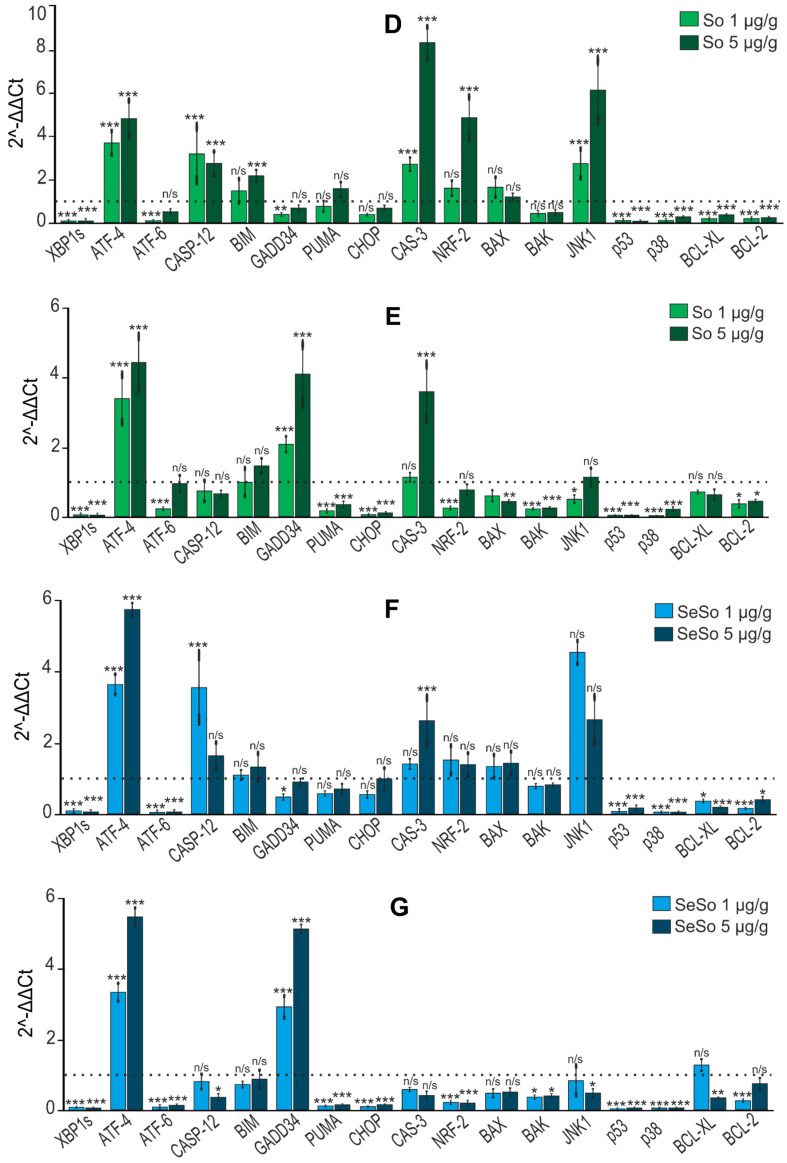
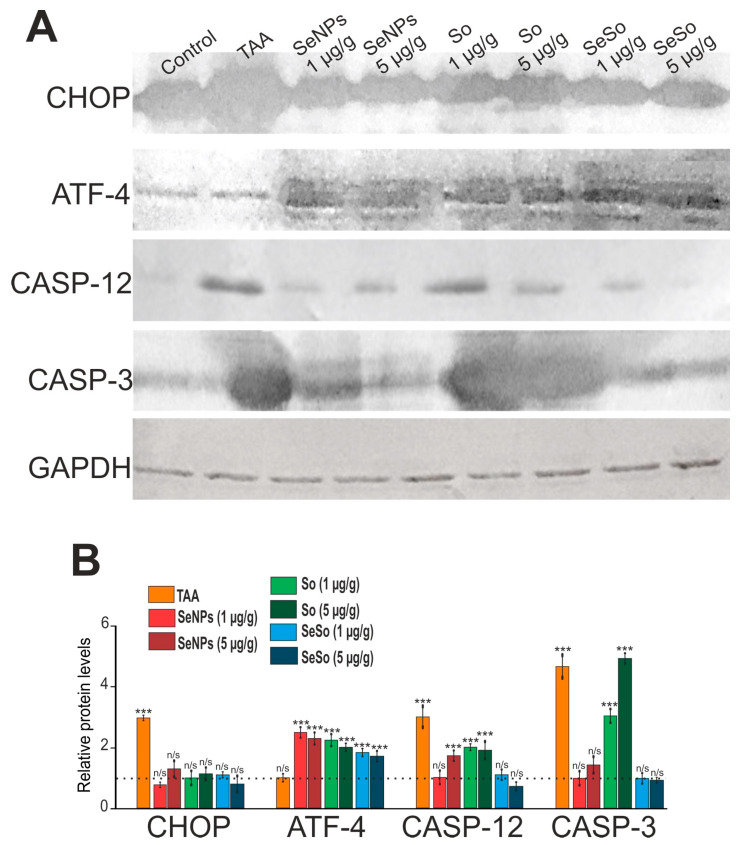
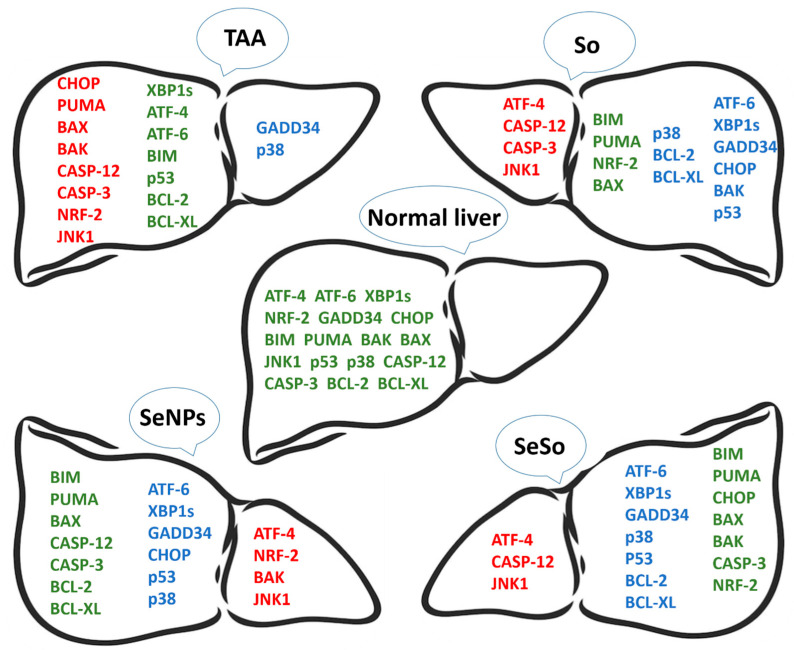
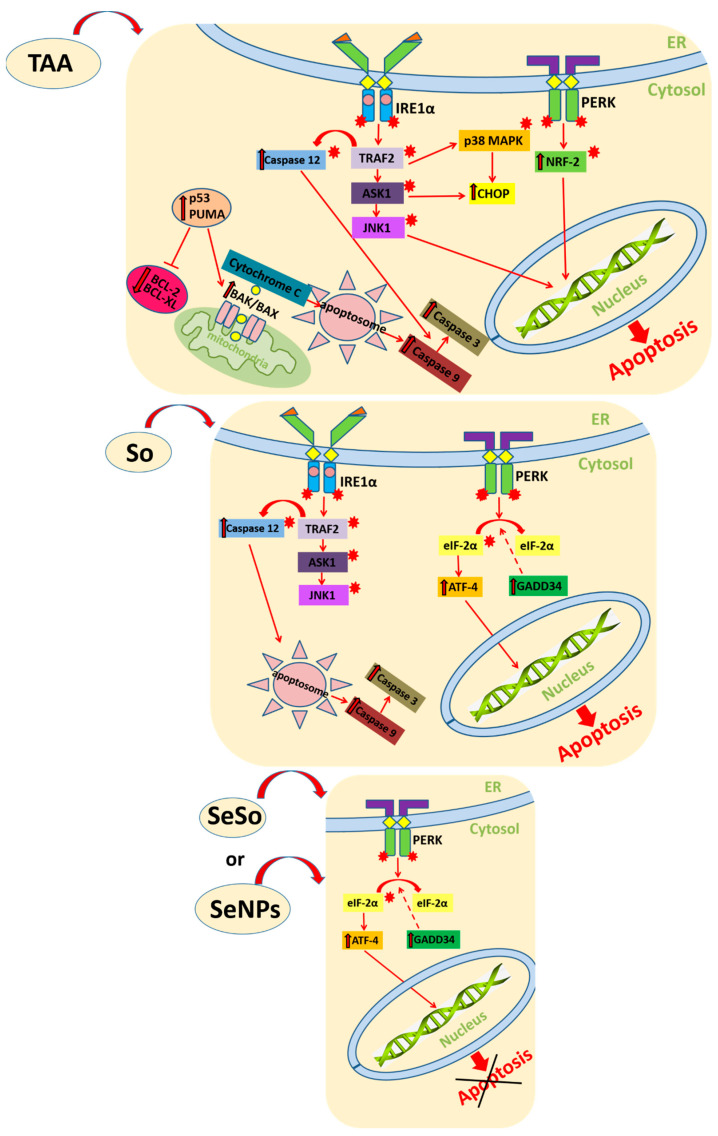
For the first time, based on the expression analysis of a wide range of pro- and anti-fibrotic, pro- and anti-inflammatory, and pro- and anti-apoptotic genes, key markers of endoplasmic reticulum stress (ER-stress), molecular mechanisms for the regulation of fibrosis, and accompanying negative processes caused by thioacetamide (TAA) injections and subsequent injections of selenium-containing nanoparticles and sorafenib have been proposed. We found that selenium nanoparticles of two types (doped with and without sorafenib) led to a significant decrease in almost all pro-fibrotic and pro-inflammatory genes. Sorafenib injections also reduced mRNA expression of pro-fibrotic and pro-inflammatory genes but less effectively than both types of nanoparticles. In addition, it was shown for the first time that TAA can be an inducer of ER-stress, most likely activating the IRE1α and PERK signaling pathways of the UPR, an inducer of apoptosis and pyroptosis. Sorafenib, despite a pronounced anti-apoptotic effect, still did not reduce the expression of caspase-3 and 12 or mitogen-activated kinase JNK1 to control values, which increases the risk of persistent apoptosis in liver cells. After injections of selenium-containing nanoparticles, the negative effects caused by TAA were leveled, causing an adaptive UPR signaling response through activation of the PERK signaling pathway. The advantages of selenium-containing nanoparticles over sorafenib, established in this work, once again emphasize the unique properties of this microelement and serve as an important factor for the further introduction of drugs based on it into clinical practice.

Keywords: apoptosis; liver fibrosis; selenium; selenium nanoparticles; sorafenib.


Conflict of interest statement

The authors declare no conflict of interest.

Figures

Figure 1
Figure 1
Basic physicochemical characteristics of a colloidal solution of selenium nanoparticles (SeNPs) and a complex of selenium nanoparticles with sorafenib (SeSo). (A) Hydrodynamic diameter of SeNPs and SeSo; (B) electro-kinetic potential of SeNPs and SeSo; (C) spectral properties of SeNPs and SeSo and chemically pure sorafenib (So); (D) TEM micrographs of SeNPs. Data on the TEM study of SeSo are not presented, since the “coat” of sorafenib has low contrast.
Figure 2
Figure 2
Study of the refractive index of aqueous solutions of SeNPs and SeSo and chemically pure So. The refractive index of the media was calculated using an Abbemat MW (Anton Paar, Austria) precision multi-wavelength digital refractometer Abbemat MW. (A) Refractive index measurement at a wavelength of 435.8 nm; (B) refractive index measurement at a wavelength of 589.3 nm; (C) refractive index measurement at a wavelength of 632.9 nm.
Figure 3
Figure 3
Study of the fluorescence of aqueous solutions of SeNPs (A), So (B), and SeSo (C). Typical 3D spectra are shown; with repeated measurements, the intensity maxima change by no more than a few percentage points. The fluorescence of the samples was studied on a FP-8300 spectrometer (JASCO Applied Sciences, Canada), and measurements were carried out with the shutter turned on in quartz cuvettes with an optical path length of 10 mm at room temperature (~22 °C). Each sample was measured three times.
Figure 4
Figure 4
Statistical analysis of liver and animal weight and their ratio. (A) Animal weight (g); (B) liver weight (g); (C) ratio of liver weight to animal weight (%) before and after treatment of animals with TAA (150 µg/g); (D) animal weight (g); (E) liver weight (g); (F) ratio of liver weight to animal weight (%) after intraperitoneal injections of SeNPs, So, and SeSo at concentrations of 1 and 5 µg/g and self-healing animals (SH) in which liver cell regeneration was tested after TAA injections without any therapy. The numbers indicate mean ± SD. Statistical analysis was performed using the unpaired nonparametric t-test with the Mann–Whitney test. Ranks were compared. Reliability comparisons were completed relative to the control group. N/s—data not significant (p > 0.05), * p < 0.05, ** p < 0.01. The number of animals in each group was 7.
Figure 5
Figure 5
Macroscopic analysis of various liver samples from C57BL/6J mice. (A) Photographs of mouse livers before and after injections of TAA, non-particles, and sorafenib at various concentrations, as well as in the self-healing group; (B) photographs of a section of mouse liver after TAA injections.
Figure 6
Figure 6
Microscopic analysis of histological liver samples. (A) Liver samples stained with hematoxylin and eosin: (a) morphology of the liver of the control group; (bd) liver morphology after TAA injections, where (1) is false lobules and (2) is fibrous tissue; (B) liver samples stained with picro-sirius red: (a) morphology of the liver of the control group; (bd) liver morphology after TAA injections.
Figure 7
Figure 7
Microscopic analysis of histological samples of mouse liver in different study groups. (A) Staining with hematoxylin and eosin; (B) picro-sirius red stain; (C) the relative area of collagen fibers, calculated using the ImageJ program according to the specified calculation method (https://imagej.nih.gov/ij/docs/examples/stained-sections/index.html, accessed on 15 January 2023).
Figure 8
Figure 8
Analysis of the activities of liver enzymes ALT/GPT (A) and AST/GOT (B) in the serum of the experimental animals. Enzyme activity analysis was performed using the Reitman–Frankel colorimetric method. the standard curve was plotted by using the OD value of the standard and corresponding Carmen units (0, 28, 57, 97, 150, 200 Carmen units) as the x-axis and y-axis, respectively. The standard curve was created with graph software (or EXCEL). The Carmen units of the sample were calculated according to the formula based on the OD value of sample, *** for p < 0.001, * for p < 0.05
Figure 9
Figure 9
Relative levels of mRNA expression of pro- and anti-inflammatory and pro- and anti-fibrotic genes obtained by real-time PCR. (A) After TAA injections in relation to control; (B) effect of self-healing in relation to control; (C) effect of self-healing in relation to TAA; (D) after injections of SeNPs (1 and 5 µg/g) relative to control; (E) after injections of SeNPs (1 and 5 µg/g) relative to TAA; (F) after injections of So (1 and 5 µg/g) relative to control; (G) after injections of So (1 and 5 µg/g) relative to TAA; (H) after injections of SeSo (1 and 5 µg/g) relative to control; (I) after injections of SeSo (1 and 5 µg/g) relative to TAA. Mean values ± standard errors (SEs) were determined by analyzing data from at least three independent experiments and are indicated by error bars; n/s—data not significant; (p > 0.05), * p <0.05, ** p < 0.01, *** p < 0.001.
Figure 9
Figure 9
Relative levels of mRNA expression of pro- and anti-inflammatory and pro- and anti-fibrotic genes obtained by real-time PCR. (A) After TAA injections in relation to control; (B) effect of self-healing in relation to control; (C) effect of self-healing in relation to TAA; (D) after injections of SeNPs (1 and 5 µg/g) relative to control; (E) after injections of SeNPs (1 and 5 µg/g) relative to TAA; (F) after injections of So (1 and 5 µg/g) relative to control; (G) after injections of So (1 and 5 µg/g) relative to TAA; (H) after injections of SeSo (1 and 5 µg/g) relative to control; (I) after injections of SeSo (1 and 5 µg/g) relative to TAA. Mean values ± standard errors (SEs) were determined by analyzing data from at least three independent experiments and are indicated by error bars; n/s—data not significant; (p > 0.05), * p <0.05, ** p < 0.01, *** p < 0.001.
Figure 10
Figure 10
Relative levels of protein quantification in the liver. (A) Results of immunoblotting; (B) quantification of the studied proteins in the samples obtained using ImageJ software, presented as mean ± standard deviation of three independent experiments. GAPDH was used as a control for normalization; n/s—data not significant; (p > 0.05), ** p < 0.01, *** p < 0.001.
Figure 11
Figure 11
Schematic representation of how the levels of mRNA expression of the profibrotic and proinflammatory genes changed in the livers of all groups of animals relative to healthy animals. Here, green indicates genes whose mRNA expression levels are close to normal levels, red indicates genes whose mRNA expression levels are higher than normal, and blue indicates genes whose mRNA expression levels are lower than normal.
Figure 12
Figure 12
Schematic representation of the processes hypothesized to occur in the liver following TAA, SeNPs, So, and SeSo injections. Exposure of liver cells to TAA leads to an acute inflammatory response accompanied by the formation of the inflammasome, activation of caspase-1, and subsequent activation of IL-1β. These processes occur both in various immune cells and in hepatocytes, which, along with the growth of other pro-inflammatory cytokines, can lead to pyroptosis or cell necrosis. IL-1β, released into the extracellular environment, can contact receptors on the surface of liver stellate cells, activating them. This, in turn, is accompanied by excessive deposition of extracellular matrix and the growth of α-SMA, Col1a1, Col1a2, and EGF, which leads to liver fibrosis. Despite the well-observed trend towards a decrease in pro-fibrotic genes, after injections of So and in the livers of self-healing animals, high levels of expression of CASP-1 and IL-1β still remained, which increases the risks of maintaining cell pyroptosis, which was not observed after similar injections of selenium-containing nanoparticles.
Figure 12
Figure 12
Schematic representation of the processes hypothesized to occur in the liver following TAA, SeNPs, So, and SeSo injections. Exposure of liver cells to TAA leads to an acute inflammatory response accompanied by the formation of the inflammasome, activation of caspase-1, and subsequent activation of IL-1β. These processes occur both in various immune cells and in hepatocytes, which, along with the growth of other pro-inflammatory cytokines, can lead to pyroptosis or cell necrosis. IL-1β, released into the extracellular environment, can contact receptors on the surface of liver stellate cells, activating them. This, in turn, is accompanied by excessive deposition of extracellular matrix and the growth of α-SMA, Col1a1, Col1a2, and EGF, which leads to liver fibrosis. Despite the well-observed trend towards a decrease in pro-fibrotic genes, after injections of So and in the livers of self-healing animals, high levels of expression of CASP-1 and IL-1β still remained, which increases the risks of maintaining cell pyroptosis, which was not observed after similar injections of selenium-containing nanoparticles.
Figure 13
Figure 13
Relative levels of mRNA expression of ER-stress markers obtained by real-time PCR. (A) After TAA injections in relation to control; (B) after injections of SeNPs (1 and 5 µg/g) relative to control; (C) after injections of SeNPs (1 and 5 µg/g) relative to TAA; (D) after injections of So (1 and 5 µg/g) relative to control; (E) after injections of So (1 and 5 µg/g) relative to TAA; (F) after injections of SeSo (1 and 5 µg/g) relative to control; (G) after injections of SeSo (1 and 5 µg/g) relative to TAA. Mean values ± standard errors (SEs) were determined by analyzing data from at least three independent experiments and are indicated by error bars; n/s—data not significant; (p > 0.05), * p < 0.05, ** p < 0.01, *** p < 0.001.
Figure 13
Figure 13
Relative levels of mRNA expression of ER-stress markers obtained by real-time PCR. (A) After TAA injections in relation to control; (B) after injections of SeNPs (1 and 5 µg/g) relative to control; (C) after injections of SeNPs (1 and 5 µg/g) relative to TAA; (D) after injections of So (1 and 5 µg/g) relative to control; (E) after injections of So (1 and 5 µg/g) relative to TAA; (F) after injections of SeSo (1 and 5 µg/g) relative to control; (G) after injections of SeSo (1 and 5 µg/g) relative to TAA. Mean values ± standard errors (SEs) were determined by analyzing data from at least three independent experiments and are indicated by error bars; n/s—data not significant; (p > 0.05), * p < 0.05, ** p < 0.01, *** p < 0.001.
Figure 14
Figure 14
Relative levels of protein quantification in the liver. (A) Results of immunoblotting; (B) quantification of the studied proteins in the samples obtained using ImageJ software presented as the mean ± standard deviation of three independent experiments. GAPDH was used as a control for normalization; n/s—data not significant; (p > 0.05), *** p < 0.001.
Figure 15
Figure 15
Schematic representation of how the levels of mRNA expression of the studied genes changed in the livers of all groups of animals relative to healthy animals. Here, green indicates genes whose mRNA expression levels are close to normal levels, red indicates genes whose mRNA expression levels are higher than normal, and blue indicates genes whose mRNA expression levels are lower than normal.
Figure 16
Figure 16
Schematic representation of the activation of UPR signaling pathways during ER-stress, caused by TAA injections, in liver cells. TAA causes activation of IRE1α and PERK UPR pathways through increased expression of JNK1 and NRF-2, which are targets of the IRE1α and PERK kinases. Increased expression of PUMA and p53 leads to increased expression and translocation to mitochondria of the pro-apoptotic proteins BAK and BAX, which ultimately leads to apoptosome formation and activation of caspase-9 and caspase-3. In turn, active caspase-12 also activates effector caspase-3 through activation of caspase-9, which forms the apoptosome. Thus, under conditions of prolonged ER-stress caused by long-term action of TAA, pro-apoptotic signaling pathways are activated. After So injections, liver cells still retain high levels of some pro-apoptotic genes: CASP-12, CASP-3, and JNK1, which may indicate a high risk of apoptosis in liver cells. After injections with SeNPs or SeSo nanoparticles, the adaptive UPR pathway is activated through the PERK signaling pathway. Thus, SeNPs and SeSo are able to neutralize the effects of ER-stress and lead to a high increase in the expression of mRNA of a number of pro-apoptotic genes caused by TAA injections.

Similar articles

Cited by

References

    1. Iredale J.P. Models of liver fibrosis: Exploring the dynamic nature of inflammation and repair in a solid organ. J. Clin. Investig. 2007;117:539–548. doi: 10.1172/JCI30542. - DOI - PMC - PubMed
    1. Kisseleva T., Brenner D.A. Mechanisms of fibrogenesis. Exp. Biol. Med. 2008;233:109–122. doi: 10.3181/0707-MR-190. - DOI - PubMed
    1. Ekihiro S., Brenner D.A. Recent advancement of molecular mechanisms of liver fibrosis. J. Hepato Biliary Pancreat. Sci. 2015;22:512–518. - PMC - PubMed
    1. Brenner D.A. Reversibility of liver fibrosis. Gastroenterol. Hepatol. 2013;9:737–739. - PMC - PubMed
    1. Aydın M.M., Akçalı K.C. Liver fibrosis. Turk. J. Gastroenterol. 2018;29:14–21. doi: 10.5152/tjg.2018.17330. - DOI - PMC - PubMed

Publication types

MeSH terms