. 2023 Nov 29;12(23):2732.
doi: 10.3390/cells12232732.

In Doxorubicin-Adapted Hodgkin Lymphoma Cells, Acquiring Multidrug Resistance and Improved Immunosuppressive Abilities, Doxorubicin Activity Was Enhanced by Chloroquine and GW4869

Affiliations

In Doxorubicin-Adapted Hodgkin Lymphoma Cells, Acquiring Multidrug Resistance and Improved Immunosuppressive Abilities, Doxorubicin Activity Was Enhanced by Chloroquine and GW4869

Naike Casagrande et al. Cells. .

Abstract

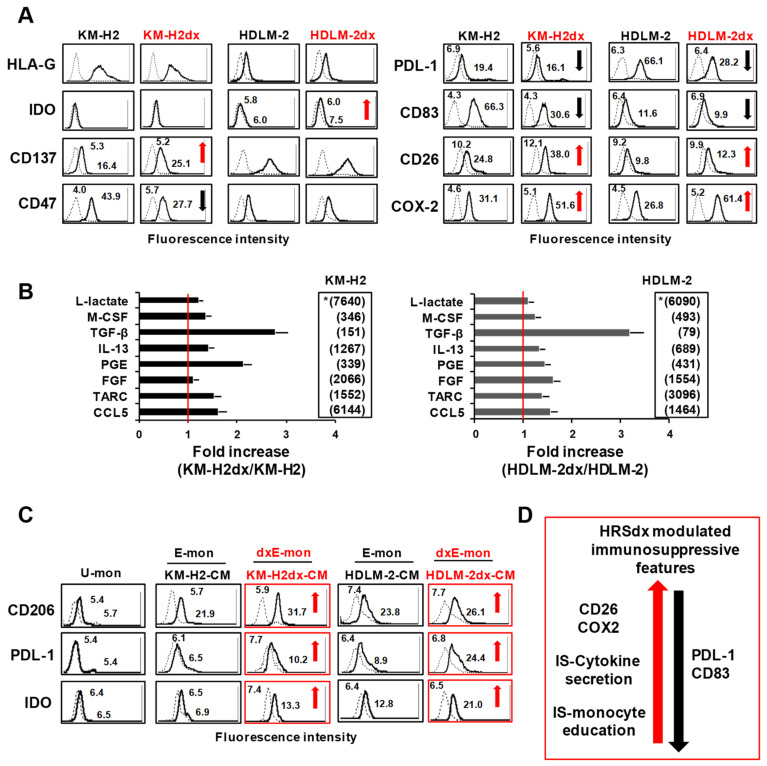
Classical Hodgkin lymphoma (cHL) is a highly curable disease (70-80%), even though long-term toxicities, drug resistance, and predicting clinical responses to therapy are major challenges in cHL treatment. To solve these problems, we characterized two cHL cell lines with acquired resistance to doxorubicin, KM-H2dx and HDLM-2dx (HRSdx), generated from KM-H2 and HDLM-2 cells, respectively. HRSdx cells developed cross-resistance to vinblastine, bendamustin, cisplatin, dacarbazine, gemcitabine, brentuximab vedotin (BV), and γ-radiation. Both HDLM-2 and HDLM-2dx cells had intrinsic resistance to BV but not to the drug MMAE. HDLM-2dx acquired cross-resistance to caelyx. HRSdx cells had in common decreased CD71, CD80, CD54, cyt-ROS, HLA-DR, DDR1, and CD44; increased Bcl-2, CD58, COX2, CD26, CCR5, and invasive capability; increased CCL5, TARC, PGE2, and TGF-β; and the capability of hijacking monocytes. In HRSdx cells less sensitive to DNA damage and oxidative stress, the efflux drug transporters MDR1 and MRP1 were not up-regulated, and doxorubicin accumulated in the cytoplasm rather than in the nucleus. Both the autophagy inhibitor chloroquine and extracellular vesicle (EV) release inhibitor GW4869 enhanced doxorubicin activity and counteracted doxorubicin resistance. In conclusion, this study identifies common modulated antigens in HRSdx cells, the associated cross-resistance patterns, and new potential therapeutic options to enhance doxorubicin activity and overcome resistance.

Keywords: Hodgkin lymphoma; cross-resistance; doxorubicin; drug resistance; immunosuppression.


Conflict of interest statement

The author declare no conflict of interest.

Figures

Figure 1
Figure 1
Characteristics of HRS and HRSdx cells. (A) Phase-contrast photo-micrographs of HRS and HRSdx cells. (B) Morphological images of HRS (upper panels) and HRSdx cells (red, lower panels) obtained after May–Grünwald–Giemsa staining (MGG). (Magnification, ×20; scale bar, 10 µm.) (C) Growth curves of HRS and HRSdx cells. The number of viable cells was evaluated via trypan blue dye exclusion assays. The calculated doubling times (DTs, in days) for each cell line were reported in the figure. (D) Clonogenic growth. Cells were seeded in medium containing 0.8% methylcellulose. After 14 days, aggregates with ≥40 cells were scored as colonies. Values (total number of colonies) are the mean ± SD of eight replicates of three independent experiments. (E) HRS and HRSdx cells were lysed, and NF-kB p65 transcription factor activity was analyzed in nuclear extracts using the Transcription Factor Kit (p65). Results are represented as the percent of control (activity HRSdx respect to HRS parental cells) and are the mean ± SD of three independent experiments. Chemotaxis assays in Boyden chambers. (F) Migration of HRS and HRSdx cells through fibronectin-coated (20 µg/mL) chambers towards 20% complete medium. Data are the percentages of cells that migrated from the serum-free upper chamber to the lower complete medium chamber. (G) Invasion. Migration of HRS and HRSdx cells through Matrigel-coated (50 ug/mL) chambers towards 20% complete medium. Data are the percentages of cells that migrated from the Matrigel-coated upper chamber to the lower complete medium chamber. (H) Western blot analysis for ROCK, RhoA, and vinculin in HRS and HRSdx cells. Images were acquired using a ChemiDoc XRS system (Bio-Rad). (I) Flow cytometry expression of CCR5 and CXCR4 in HRS and HRSdx cells. Red arrows indicate up-regulated antigens. Mean fluorescence intensities are reported in the boxes. * p < 0.05 HRSdx vs. HRS cells.
Figure 2
Figure 2
Phenotypes of HRS and HRSdx cells. Flow cytometry assay of molecules expressed by HRS and HRSdx cells. Representative flow cytometry histograms showing the expression of (A) survival factors and antiapoptotic molecules, (B) markers of the putative cancer stem cells, and (C) molecules involved in the interactions with collagen and stromal cells (D) or with white blood cells (lymphocytes, monocytes, eosinophils, and mast cells). Mean fluorescence intensities are reported in the boxes. Red arrows indicate up-regulated antigens and black arrows down-modulated antigens in doxorubicin resistant HRSdx cells with respect to parental HRS cells. (E) Venn diagrams showing the molecules modulated in both HRSdx cells and those specifically * up-regulated (red) or * down-regulated (blue) in KM-H2dx and HDLM-2dx.
Figure 3
Figure 3
Tumor cell expression and secretion of immunosuppressive molecules and monocyte immunosuppressive education by tumor cell conditioned medium (CM). (A) Flow cytometry assay of immunosuppressive molecules expressed by HRS and HRSdx cells. Red arrows indicate up-regulated antigens and black arrows down-modulated antigens in HRSdx cells with respect to HRS cells. (B) Cytokines secreted by HRS and HRSdx cells cultured for 72 h in complete medium. Their concentrations were evaluated by an ELISA assay and reported as pg × 106 cells, excluding L-lactate (*, ng/106 cells). Values for KM-H2 and HDLM-2 are shown in the respective insert. Bar charts report the fold-increase in the concentration of each chemokine secreted by HRSdx cells with respect to HRS cells. (C) Monocytic THP-1 cells were cultured with HRS-CM and HRSdx-CM, and then, CD206, PDL-1, and IDO expression was evaluated via flow cytometry. Mean fluorescence intensities are reported in the boxes. Red arrows indicate antigens up-regulated by HRSdx-CM with respect to HRS-CM. (D) Immunosuppression (IS). Schematic representation of common HRSdx modifications in cells leading to immunosuppression (antigens, cytokines, monocytes, tumor education). The red arrow indicates up-regulated antigens and the black arrow down-modulated antigens (HRSdx respect to HRS cells).
Figure 4
Figure 4
Cross-resistance pattern and γ-radiation activity in HRS and HRSdx cells. (A) The resistance factor (RF) value is the ratio of the HRSdx IC50 (KM-H2dx and HDLM-2dx) over the HRS IC50 (KM-H2 and HDLM-2). RFs are reported in ascending order. RF < 1 indicates cross-sensitivity (CS), and RF ≥1 indicates cross-resistance (CR). An RF ranging from 1 to 2 indicates low CR, an RF from 2 to 5 indicates moderate CR, and an RF ≥ 5 indicates high CR. (BD) Tumor cells were treated with γ-radiation (0–12 Gy). Then, cell viability, clonogenic growth, and cell cycle distribution were evaluated. (B) Cells were double-stained with Annexin-V-FITC and 7AAD and analyzed via flow cytometry. Bar charts show the percentage of viable cells (Annexin-V and 7AAD negative cells). (C) Clonogenic growth assay. Untreated and γ-radiation-treated cells were seeded in medium containing 0.8% methylcellulose and cultured for 14 days; aggregates with ≥40 cells were scored as colonies. Values (total number of colonies) are the mean ± SD of eight replicates. (D) Bar charts show the percentage of cells in each cell cycle phase, evaluated after propidium iodide staining and flow cytometry analysis. (E) Representative cytofluorimetric histograms of the cell cycle progression after γ-radiation treatment. Results are the mean ± SD of three independent experiments. * p < 0.05 HRSdx vs. parental HRS cells.
Figure 5
Figure 5
Expression of drug transporters, uptake, distribution, and DNA damage via doxorubicin in HRS and HRSdx cells. (A) Relative mRNA expression of MDR1/ABCB1 and MRP1/ABCC1 in HRS and HRSdx cells using GAPDH gene expression as internal control. (B) Western blot for MDR1, MRP1, and α-tubulin expression. (C) Flow cytometry-based doxorubicin accumulation assay. HRS and HRSdx cells were incubated with doxorubicin (0–200 ng/mL) for 2 h. Then, the percentage of red fluorescence-positive cells was evaluated via flow cytometry. (D) Cells were incubated with doxorubicin (DOX, 1 µg/mL). After 2 h, doxorubicin internalization and distribution were evaluated via confocal microscopy. (E) HRS and HRSdx cells were incubated for 24 h with doxorubicin (KM-H2 IC90 = 100 ng/mL and HDLM-2 IC90 = 175 ng/mL). Then, γ-H2AX expression was evaluated via flow cytometry. (F) KM-H2dx and HDLM-2dx cells were incubated for 24 h with doxorubicin (KM-H2dx IC90 = 300 ng/mL and HDLM-2dx IC90 = 450 ng/mL). γ-H2AX expression was evaluated via flow cytometry. Results are the mean ± SD of three independent experiments. * p < 0.05 HRSdx vs. parental HRS cells.
Figure 6
Figure 6
Sensitivity of HRS and HRSdx cells to oxidative stress. HRS and HRSdx cells were treated with H2O2 (0–0.5 mM). (A) After 1 h, cell viability was evaluated with a trypan blue dye exclusion assay. (B) Alternatively, cells were double-stained with Annexin-V-FITC and 7AAD and analyzed via flow cytometry. Bar charts show the percentage of viable cells (Annexin-V- and 7AAD-negative cells). (C) HRS and HRSdx cells were treated for 24 h with H2O2 (0.25 mM). After 24 h, cell viability was evaluated with a trypan blue dye exclusion assay. (D) TrxR enzymatic activity was evaluated using a TrxR assay kit and expressed as U/mg of protein. Results are the mean ± SD of three independent experiments. * p < 0.05 HRSdx vs. parental HRS cells.
Figure 7
Figure 7
Chloroquine and GW4869 enhance cell death induced by doxorubicin. HRS and HRSdx cells were cultured with doxorubicin (DOX) in the presence or not in the presence of (A) a non-toxic concentration of chloroquine (CQ) (2.5 µM) or (B) GW4869 (2 µM). After 72 h, cell viability was evaluated via a trypan blue dye exclusion assay. Results are the mean ± SD of three independent experiments. * p < 0.05 DOX vs. DOX plus CQ or DOX plus GW4869. Arrows indicate the IC50 of doxorubicin, in the presence or not in the presence of CQ or GW4869. The difference in the IC50 is shown by the horizontal black double-headed arrow.

Similar articles

Cited by

References

    1. Weniger M.A., Küppers R. Molecular Biology of Hodgkin Lymphoma. Leukemia. 2021;35:968–981. doi: 10.1038/s41375-021-01204-6. - DOI - PMC - PubMed
    1. Arlt A., von Bonin F., Rehberg T., Perez-Rubio P., Engelmann J.C., Limm K., Reinke S., Dullin C., Sun X., Specht R., et al. High CD206 Levels in Hodgkin Lymphoma-Educated Macrophages Are Linked to Matrix-Remodeling and Lymphoma Dissemination. Mol. Oncol. 2020;14:571–589. doi: 10.1002/1878-0261.12616. - DOI - PMC - PubMed
    1. Aldinucci D., Celegato M., Casagrande N. Microenvironmental Interactions in Classical Hodgkin Lymphoma and Their Role in Promoting Tumor Growth, Immune Escape and Drug Resistance. Cancer Lett. 2016;380:243–252. doi: 10.1016/j.canlet.2015.10.007. - DOI - PubMed
    1. Aldinucci D., Borghese C., Casagrande N. Formation of the Immunosuppressive Microenvironment of Classic Hodgkin Lymphoma and Therapeutic Approaches to Counter It. Int. J. Mol. Sci. 2019;20:2416. doi: 10.3390/ijms20102416. - DOI - PMC - PubMed
    1. Dörsam B., Bösl T., Reiners K.S., Barnert S., Schubert R., Shatnyeva O., Zigrino P., Engert A., Hansen H.P., von Strandmann E.P. Hodgkin Lymphoma-Derived Extracellular Vesicles Change the Secretome of Fibroblasts Toward a CAF Phenotype. Front. Immunol. 2018;9:1358. doi: 10.3389/fimmu.2018.01358. - DOI - PMC - PubMed

Publication types

MeSH terms