. 2023 Nov 30;12(23):2747.
doi: 10.3390/cells12232747.

Spatial Transcriptomics Reveals Signatures of Histopathological Changes in Muscular Sarcoidosis

Affiliations

Spatial Transcriptomics Reveals Signatures of Histopathological Changes in Muscular Sarcoidosis

Hippolyte Lequain et al. Cells. .

Abstract

Sarcoidosis is a multisystemic disease characterized by non-caseating granuloma infiltrating various organs. The form with symptomatic muscular involvement is called muscular sarcoidosis. The impact of immune cells composing the granuloma on the skeletal muscle is misunderstood. Here, we investigated the granuloma-skeletal muscle interactions through spatial transcriptomics on two patients affected by muscular sarcoidosis. Five major transcriptomic clusters corresponding to perigranuloma, granuloma, and three successive muscle tissue areas (proximal, intermediate, and distal) around the granuloma were identified. Analyses revealed upregulated pathways in the granuloma corresponding to the activation of T-lymphocytes and monocytes/macrophages cytokines, the upregulation of extracellular matrix signatures, and the induction of the TGF-β signaling in the perigranuloma. A comparison between the proximal and distal muscles to the granuloma revealed an inverse correlation between the distance to the granuloma and the upregulation of cellular response to interferon-γ/α, TNF-α, IL-1,4,6, fibroblast proliferation, epithelial to mesenchymal cell transition, and the downregulation of muscle gene expression. These data shed light on the intercommunications between granulomas and the muscle tissue and provide pathophysiological mechanisms by showing that granuloma immune cells have a direct impact on proximal muscle tissue by promoting its progressive replacement by fibrosis via the expression of pro-inflammatory and profibrosing signatures. These data could possibly explain the evolution towards a state of disability for some patients.

Keywords: Visium; fibrosis; granuloma; muscular sarcoidosis; skeletal muscle; spatial transcriptomic.


Conflict of interest statement

The authors declare no conflict of interest.

Figures

Figure 1
Figure 1
Radiological features and biopsies of two patients with muscular sarcoidosis. (AF) A whole-body 18F-fluoro-deoxyglucose (FDG) positron emission tomography (PET) scan (PET-scan) showed a diffuse muscular hypermetabolism, predominantly involving the lower limbs and a mediastinum lymph node. Patient #1 (A,B) and patient #2 (CF). (G,H) Hematoxylin–phloxine–saffron (HPS) staining of quadriceps muscle biopsies from patient #1 (G) and patient #2 (H). Asterisks and arrows indicate massive (>1 mm) and smaller (≤500 μm) granuloma, respectively. Scale bars: 500 μm.
Figure 2
Figure 2
Granuloma characterization: immunohistochemistry characterization. Immunohistochemistry experiments were carried out on both biopsies (Patient #1: (top) and Patient #2: (bottom)) using antibodies directed against CD68, CD163, and CD3, or CD8 as markers of the monocyte/macrophage and lymphocyte lineages, respectively. Scale bar for all panels is 500 μm.
Figure 3
Figure 3
Sampling and workflow for the spatial transcriptomics approach. Tissue block sections from formalin-fixed paraffin embedding (FFPE) tissues of patients affected by muscular sarcoidosis containing granulomas (A) were placed on the capture area of a Visium spatial gene expression slide (10x genomics) (B) functionalized with 5000 spots, themselves containing millions of spatially assigned barcoded trapper oligonucleotides, ensuring that transcripts can be mapped to their original histological location (C). After FFPE tissue decrosslinking, specific pairs of probes were hybridized to tissue sections containing mRNA targets and ligated together. Ligated probes were released after tissue section permeabilization and mRNA digestion, and captured by the spatially assigned barcoded trapper oligonucleotides attached to the slide. An extension of the ligated probes, through reverse transcription, second strand synthesis, and amplification, was carried out to finalize the spatial assignment (D) and resulting DNA spatially barcoded probes were then eluted and used for DNA library preparation for Illumina high deep sequencing (E). Read sequencings were then processed and spatially resolved using the Seurat 4 algorithm. The data were then overlaid onto the acquired image of the tissue sections (F).
Figure 4
Figure 4
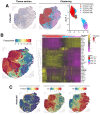
Spatial data analysis of muscular sarcoidosis—patient #1 biopsy. (A) Hematoxylin and eosin staining and projection of spot RNA clusters on the Visium slide as well as on UMAP. Visium array spots are color-coded based on cluster assignment of the integrated dataset. The perigranuloma tissue PGT cluster (brown); the granuloma structures GS cluster (red); the proximal muscle PM cluster (blue); the intermediate muscle IM cluster (purple) and the distal muscle DM cluster (pink). (B) Projection of the pseudotime on the Visium slide (left panel). Heatmap highlighting some marker genes of each cluster along the pseudotime, showing the gene expression modification along the gradient between granuloma and the “healthy-like” muscle tissue (right panel). (C) Expression of PLA2G2A, LYZ, and TTN on the Visium slide.
Figure 5
Figure 5
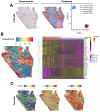
Spatial data analysis of muscular sarcoidosis—patient #2 biopsy. (A) Hematoxylin and eosin staining and projection of spot RNA clusters on the Visium slide as well as on UMAP. Visium array spots are color-coded based on the cluster assignment of the integrated dataset. Brown for the perigranuloma tissue PGT cluster; red for the granuloma structures GS cluster; blue for the proximal muscle PM cluster; purple for the intermediate muscle IM cluster; and pink for the distal muscle DM cluster. (B) Projection of the pseudotime on the Visium slide. Heatmap highlighting some marker genes of each cluster along the pseudotime, showing the gene expression modification along the gradient between the granuloma and the healthy muscle. (C) Expression of PLA2G2A, LYZ, and TTN on Visium slide.
Figure 6
Figure 6
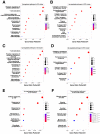
Bubble plot of GO-BP for Differentially Expressed Genes (DEG) in PGT, GS, and PM clusters. (A) Upregulated pathways identified in the granuloma structure GS cluster, Patient #1. (B) Upregulated pathways identified in the perigranuloma tissue PGT cluster, Patient #1. (C) Upregulated pathways identified in the granuloma structure GS cluster, Patient #2. (D) Upregulated pathways identified in the perigranuloma tissue PGT cluster, Patient #2. (E) Upregulated pathways identified in the proximal muscle PM cluster compared to the distal muscle DM cluster. (F) Downregulated pathways identified in the PM cluster compared to the distal muscle DM cluster. Gene ratio rich factor is the ratio of the DEG number to the total gene number in a certain pathway. The results are presented as bubble plots generated with the R package. FGF = Fibroblast Growth Factor; GS = Granuloma Structure; PGT = Peri Granuloma Tissue; PM = Proximal Muscle; TGF = Transforming Growth Factor; and TNF = Tumor Necrosis Factor.
Figure 7
Figure 7
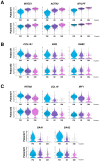
mRNA expression level of selected genes in PM, IM, and DM muscular clusters. (A) Expression level of selected muscle specific genes MYOZ1 (Myozenin 1), ACTN3 (Actinin 3), and MYLPF (Myosin light chain 11). (B) Expression level of TGF-β induced COL1A1 (Collagen 1A1), ENG2 (Endoglin), and DAB2 (Disabled homolog 2) selected target genes. (C) Expression level of TNFα and Interferon-induced IFITM3 (Interferon induced transmembrane protein 3), CCL19 (CC chemokine ligand 19), IRF1 (Interferon regulatory factor 1), SAA1, and SAA2 selected target genes. Upper panel: Patient #1 and lower panel: Patient #2. PM = Proximal muscle; IM = Intermediate Muscle; and DM = Distal Muscle.
Figure 8
Figure 8
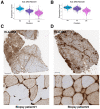
mRNA and protein expression level of HLA-DRA in PM, IM, and DM muscular clusters in both patients. (A,B) mRNA expression level of HLA-DRA in biopsy #1 (A) and patient biopsy #2 (B). (C,D) Immunohistochemistry analysis of HLA-DRA on frozen biopsies from patient #1 (C) and patient #2 (D). Lower panels correspond to higher magnification of selected regions (black rectangle in upper panels). Scale bars are 500 μm and 20 μm, respectively.
Figure 9
Figure 9
Profibrosing signature in the granuloma structure. Heatmap showing the expression of genes corresponding to signatures of resident macrophages (FOLR2, LYVE1, GAS6, FCGRT, SELENOP, FXYD2 MT1A, and LTC4S) identified in healthy muscles or LGALS3, SPP1, GPNMB, TREM2, CTS-D, -L, and -S, as previously described in profibrosing macrophages15, as well as markers of the extracellular matrix (collagens: COL1A1, COL3A1, COL1A2, COL6A1, COL6A3, and fibronectin FN1) in each cluster along the pseudotime analysis.

References

    1. Sève P., Pacheco Y., Durupt F., Jamilloux Y., Gerfaud-Valentin M., Isaac S., Boussel L., Calender A., Androdias G., Valeyre D., et al. Sarcoidosis: A Clinical Overview from Symptoms to Diagnosis. Cells. 2021;10:766. doi: 10.3390/cells10040766. - DOI - PMC - PubMed
    1. Zhang H., Costabel U., Dai H. The Role of Diverse Immune Cells in Sarcoidosis. Front. Immunol. 2021;12:788502. doi: 10.3389/fimmu.2021.788502. - DOI - PMC - PubMed
    1. Chen E.S., Moller D.R. Etiology of Sarcoidosis. Clin. Chest Med. 2008;29:365–377. doi: 10.1016/j.ccm.2008.03.011. - DOI - PubMed
    1. Pacheco Y., Lim C.X., Weichhart T., Valeyre D., Bentaher A., Calender A. Sarcoidosis and the mTOR, Rac1, and Autophagy Triad. Trends Immunol. 2020;41:286–299. doi: 10.1016/j.it.2020.01.007. - DOI - PubMed
    1. Mortaz E., Adcock I.M., Barnes P.J. Sarcoidosis: Role of non-tuberculosis mycobacteria and Mycobacterium tuberculosis. Int. J. Mycobacteriol. 2014;3:225–229. doi: 10.1016/j.ijmyco.2014.10.008. - DOI - PubMed

Publication types