

Glycation Interferes with the Expression of Sialyltransferases and Leads to Increased Polysialylation in Glioblastoma Cells
- PMID: 38067186
- PMCID: PMC10706364
- DOI: 10.3390/cells12232758
Glycation Interferes with the Expression of Sialyltransferases and Leads to Increased Polysialylation in Glioblastoma Cells
Abstract
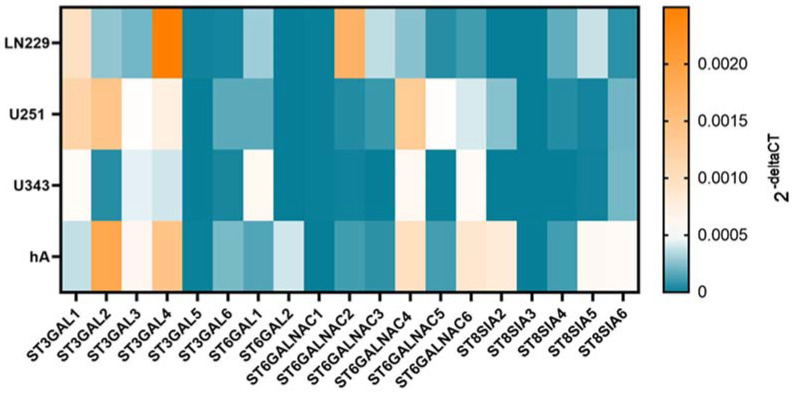
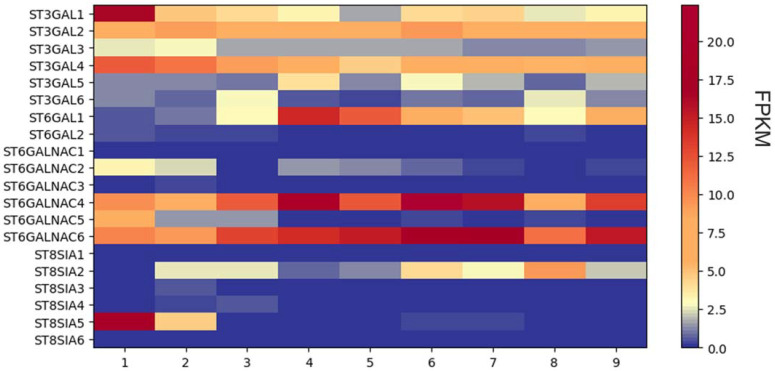
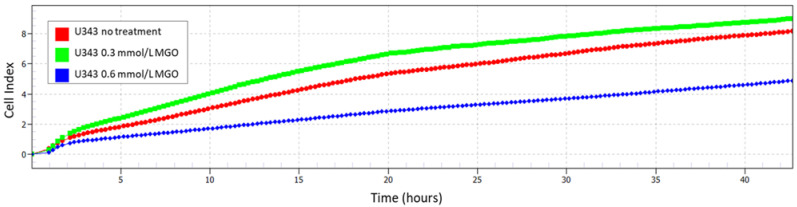
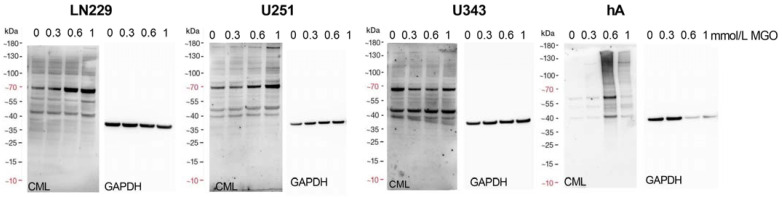
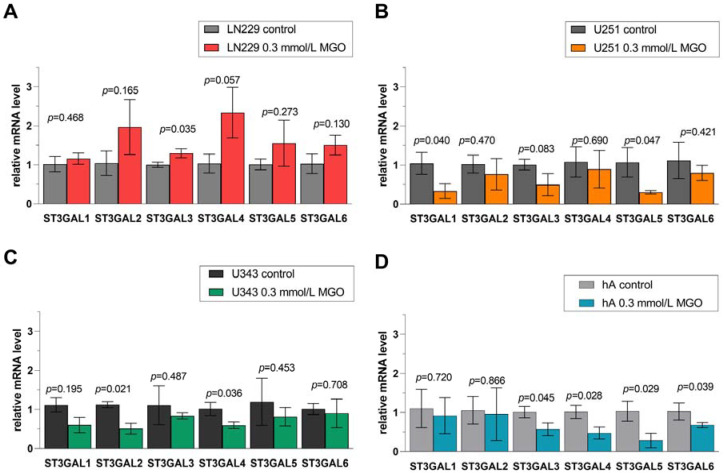
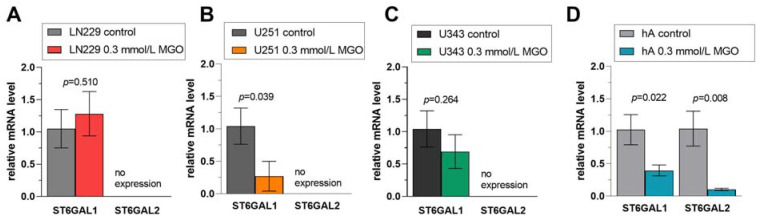
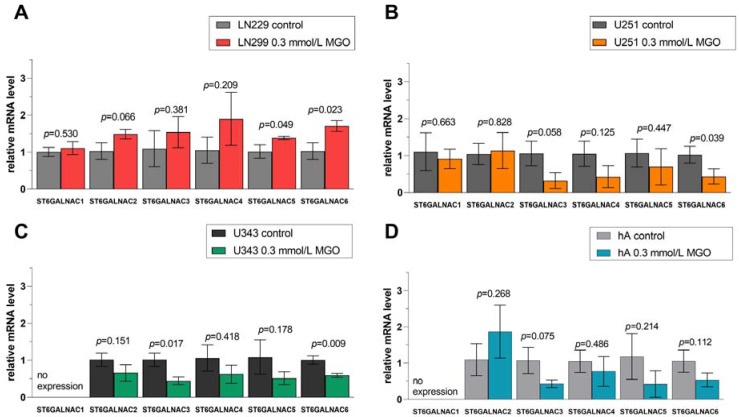
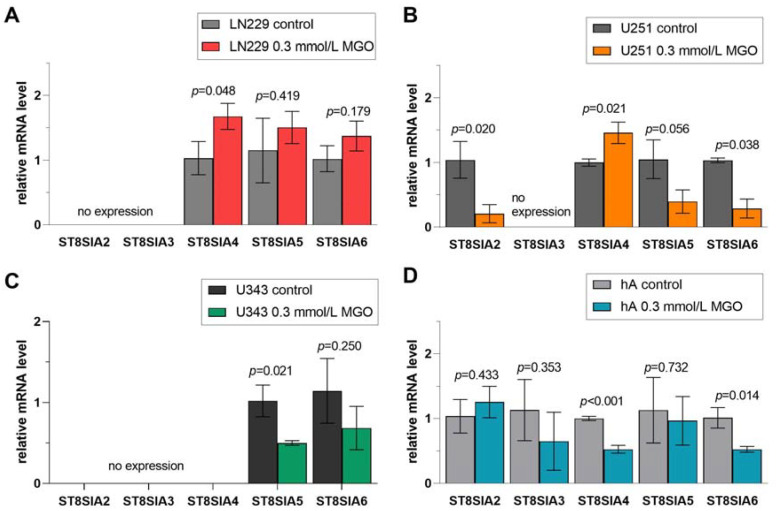
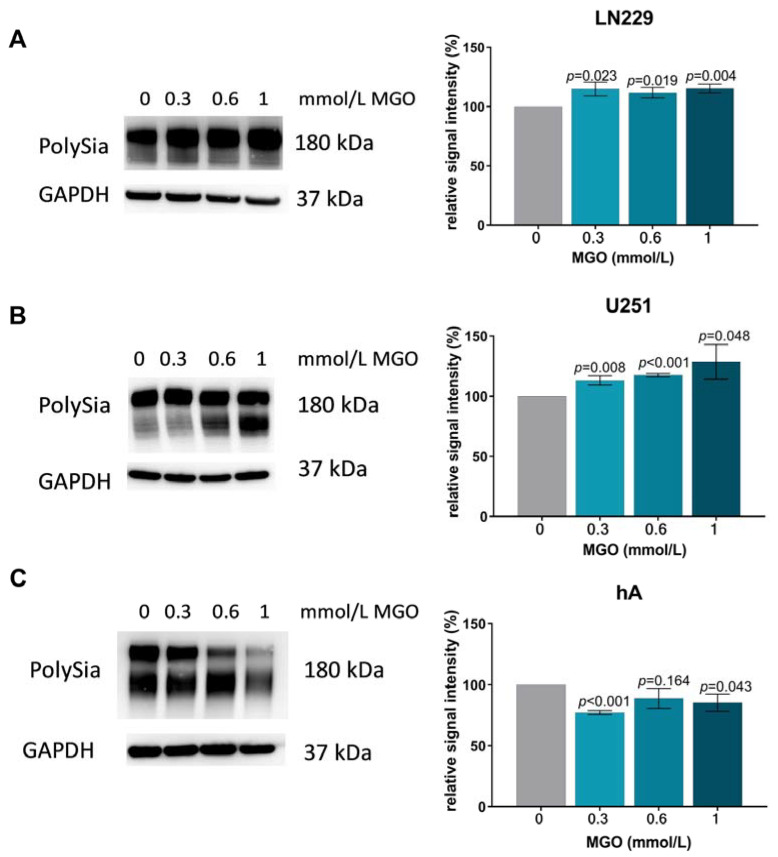
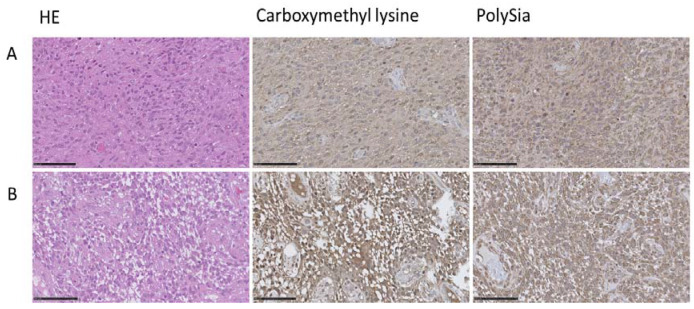
Glioblastoma (GBM) is a highly aggressive brain tumor that often utilizes aerobic glycolysis for energy production (Warburg effect), resulting in increased methylglyoxal (MGO) production. MGO, a reactive dicarbonyl compound, causes protein alterations and cellular dysfunction via glycation. In this study, we investigated the effect of glycation on sialylation, a common post-translational modification implicated in cancer. Our experiments using glioma cell lines, human astrocytes (hA), and primary glioma samples revealed different gene expressions of sialyltransferases among cells, highlighting the complexity of the system. Glycation has a differential effect on sialyltransferase expression, upregulating ST8SIA4 in the LN229 and U251 cell lines and decreasing the expression in normal hA. Subsequently, polysialylation increased in the LN229 and U251 cell lines and decreased in hA. This increase in polysialylation could lead to a more aggressive phenotype due to its involvement in cancer hallmark processes such as immune evasion, resistance to apoptosis, and enhancing invasion. Our findings provide insights into the mechanisms underlying GBM aggressiveness and suggest that targeting glycation and sialylation could be a potential therapeutic strategy.
Keywords: astrocytes; glioblastoma; glioma; glycation; methylglyoxal; polysialylation; sialyltransferases.
Conflict of interest statement
The authors declare no conflict of interest. The funders had no role in the design of this study; in the collection, analyses, or interpretation of data; in the writing of the manuscript; or in the decision to publish the results.
Figures
Similar articles
-
Glycation Leads to Increased Invasion of Glioblastoma Cells.Cells. 2023 Apr 23;12(9):1219. doi: 10.3390/cells12091219. Cells. 2023. PMID: 37174618 Free PMC article.
-
Glycation Interferes with the Expression of Sialyltransferases in Meningiomas.Cells. 2021 Nov 25;10(12):3298. doi: 10.3390/cells10123298. Cells. 2021. PMID: 34943806 Free PMC article.
-
alpha2,3-sialyltransferase mRNA and alpha2,3-linked glycoprotein sialylation are increased in malignant gliomas.Brain Res. 1997 Apr 25;755(1):175-9. doi: 10.1016/s0006-8993(97)00241-2. Brain Res. 1997. PMID: 9163557 Clinical Trial.
-
Immunometabolism and the modulation of immune responses and host defense: A role for methylglyoxal?Biochim Biophys Acta Mol Basis Dis. 2022 Aug 1;1868(8):166425. doi: 10.1016/j.bbadis.2022.166425. Epub 2022 Apr 30. Biochim Biophys Acta Mol Basis Dis. 2022. PMID: 35500827 Review.
-
Aberrant Sialylation in Cancer: Biomarker and Potential Target for Therapeutic Intervention?Cancers (Basel). 2021 Apr 22;13(9):2014. doi: 10.3390/cancers13092014. Cancers (Basel). 2021. PMID: 33921986 Free PMC article. Review.
Cited by
-
The Correlation Patterns of miRNA Expression with Targeted mRNA Transcripts in Glioma Patients with Wild-Type and Mutated Isocitrate Dehydrogenase (IDH) Genotypes.Acta Naturae. 2024 Jul-Sep;16(3):38-45. doi: 10.32607/actanaturae.27363. Acta Naturae. 2024. PMID: 39539523 Free PMC article.
-
When a negative (charge) is not a positive: sialylation and its role in cancer mechanics and progression.Front Oncol. 2024 Nov 19;14:1487306. doi: 10.3389/fonc.2024.1487306. eCollection 2024. Front Oncol. 2024. PMID: 39628991 Free PMC article. Review.
-
Effect of Different Glucose Levels and Glycation on Meningioma Cell Migration and Invasion.Int J Mol Sci. 2024 Sep 19;25(18):10075. doi: 10.3390/ijms251810075. Int J Mol Sci. 2024. PMID: 39337558 Free PMC article.
-
Polysialylation of Glioblastoma Cells Is Regulated by Autophagy Under Nutrient Deprivation.Int J Mol Sci. 2025 Aug 6;26(15):7625. doi: 10.3390/ijms26157625. Int J Mol Sci. 2025. PMID: 40806752 Free PMC article.
References
-
- Louis D.N., Perry A., Reifenberger G., Von Deimling A., Figarella D., Webster B., Hiroko K.C., Wiestler O.D., Kleihues P., Ellison D.W. The 2016 World Health Organization Classification of Tumors of the Central Nervous System: A Summary. Acta Neuropathol. 2016;131:803–820. doi: 10.1007/s00401-016-1545-1. - DOI - PubMed
-
- Louis D.N., Perry A., Wesseling P., Brat D.J., Cree I.A., Figarella-Branger D., Hawkins C., Ng H.K., Pfister S.M., Reifenberger G., et al. The 2021 WHO Classification of Tumors of the Central Nervous System: A Summary. Neuro. Oncol. 2021;23:1231–1251. doi: 10.1093/neuonc/noab106. - DOI - PMC - PubMed
Publication types
MeSH terms
Substances
Grants and funding
LinkOut - more resources
Full Text Sources
