. 2023 Dec 4;12(23):2761.
doi: 10.3390/cells12232761.

Early Age- and Sex-Dependent Regulation of Astrocyte-Mediated Glutamatergic Synapse Elimination in the Rat Prefrontal Cortex: Establishing an Organotypic Brain Slice Culture Investigating Tool

Affiliations

Early Age- and Sex-Dependent Regulation of Astrocyte-Mediated Glutamatergic Synapse Elimination in the Rat Prefrontal Cortex: Establishing an Organotypic Brain Slice Culture Investigating Tool

Eugenia Vivi et al. Cells. .

Abstract

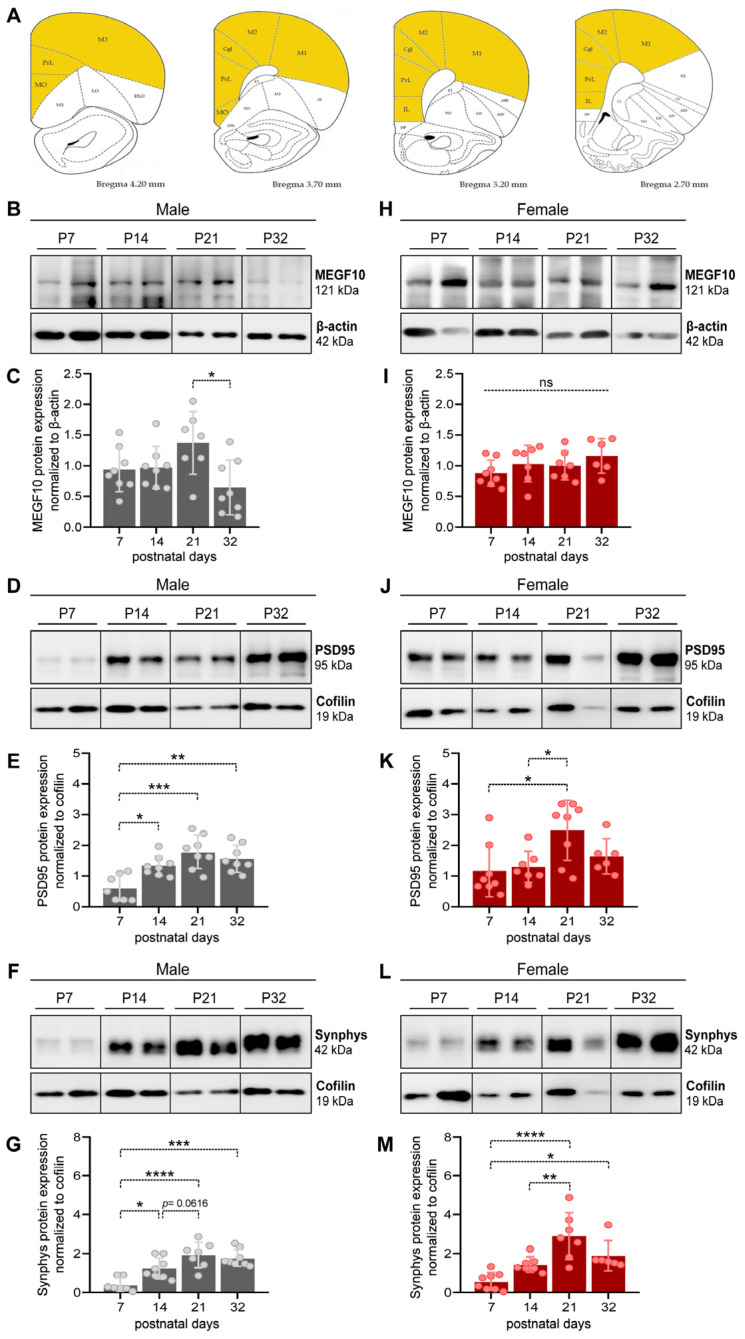
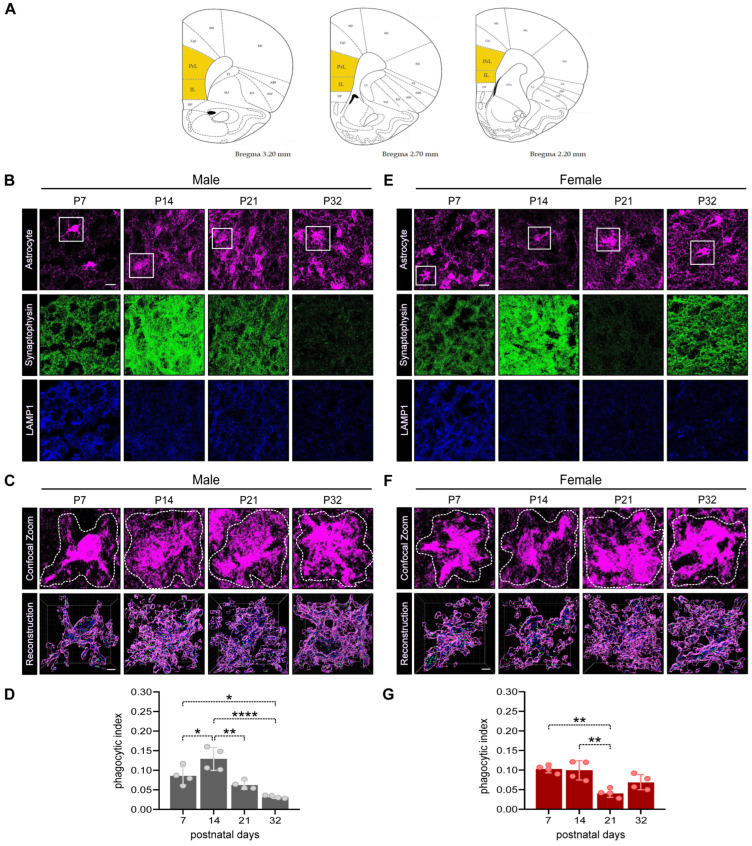
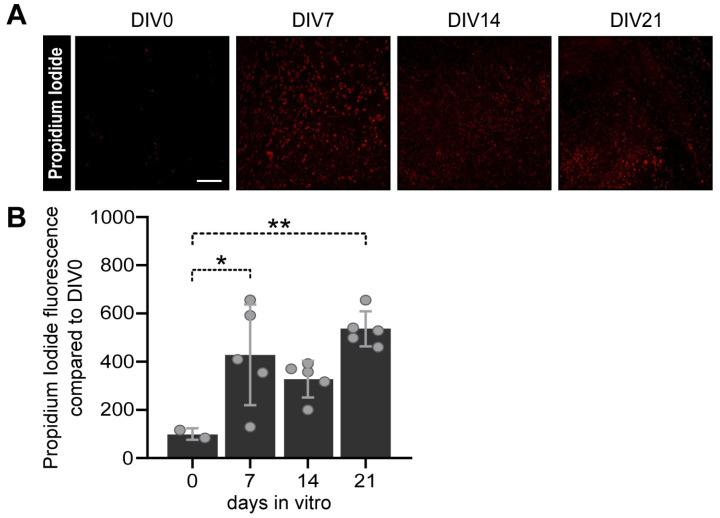
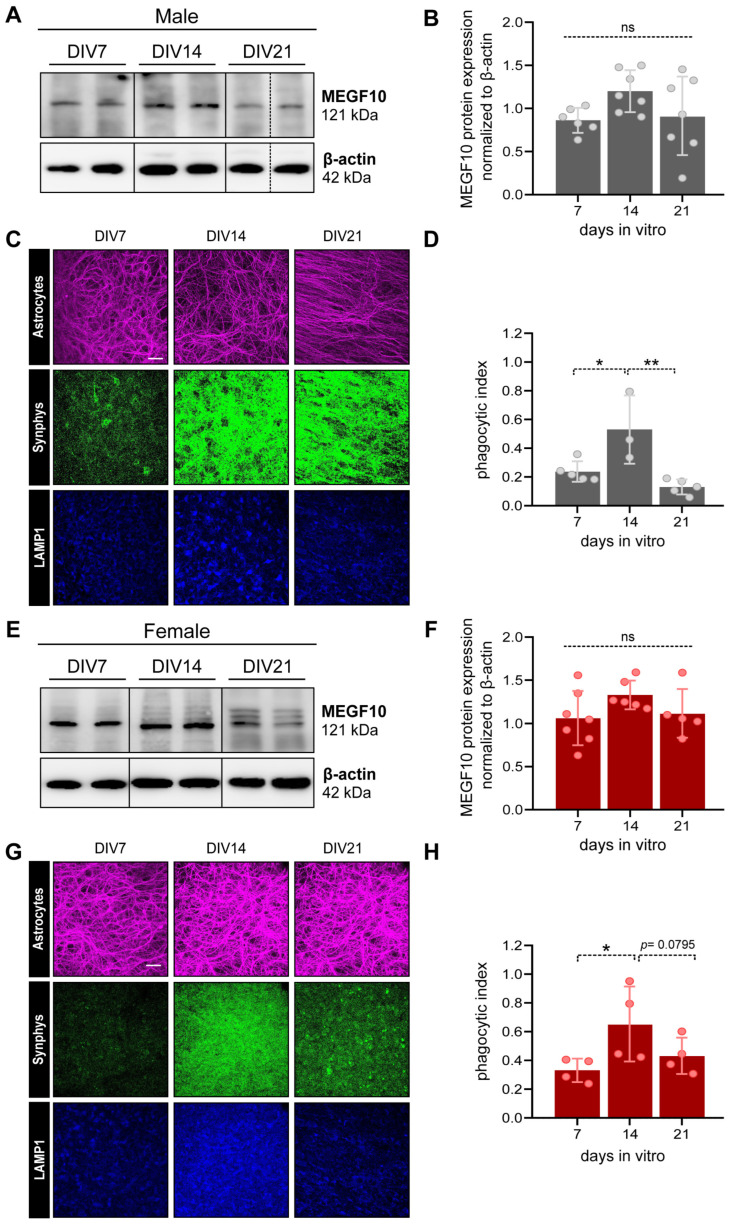
Clinical and pre-clinical studies of neuropsychiatric (NP) disorders show altered astrocyte properties and synaptic networks. These are refined during early postnatal developmental (PND) stages. Thus, investigating early brain maturational trajectories is essential to understand NP disorders. However, animal experiments are highly time-/resource-consuming, thereby calling for alternative methodological approaches. The function of MEGF10 in astrocyte-mediated synapse elimination (pruning) is crucial to refine neuronal networks during development and adulthood. To investigate the impact of MEGF10 during PND in the rat prefrontal cortex (PFC) and its putative role in brain disorders, we established and validated an organotypic brain slice culture (OBSC) system. Using Western blot, we characterized the expression of MEGF10 and the synaptic markers synaptophysin and PSD95 in the cortex of developing pups. We then combined immunofluorescent-immunohistochemistry with Imaris-supported 3D analysis to compare age- and sex-dependent astrocyte-mediated pruning within the PFC in pups and OBSCs. We thereby validated this system to investigate age-dependent astrocyte-mediated changes in pruning during PND. However, further optimizations are required to use OBSCs for revealing sex-dependent differences. In conclusion, OBSCs offer a valid alternative to study physiological astrocyte-mediated synaptic remodeling during PND and might be exploited to investigate the pathomechanisms of brain disorders with aberrant synaptic development.

Keywords: astrocyte; critical period; organotypic brain slice culture; sex differences; synaptic phagocytosis.


Conflict of interest statement

The authors declare that the research was conducted in the absence of any commercial or financial relationships that could be construed as a potential conflicts of interest. The funders had no role in the design of the study; in the collection, analyses, or interpretation of data; in the writing of the manuscript; or in the decision to publish the results.

Figures

Figure 1
Figure 1
Progressive expression of MEGF10 and synaptic markers during the cortical critical period in male and female littermates. (A) Representative graphs from the Rat Brain Atlas to show the areas of tissue dissected for Western blots. (B,D,F) For males, representative lanes were cropped from immunoblots to show changes in MEGF10 (B) PSD95 (D) and synaptophysin (F) from isolated cortices of male pups at postnatal days (P) 7, 14, 21 and 32. Full blots are shown in Supplementary Figure S1. (C,E,G) Quantitative analysis of total MEGF10 (C), PSD95 (E) and synaptophysin (G) protein expression normalized to β-actin (for MEGF10) and cofilin (for PSD95 and synaptophysin) in male pups at different developmental stages. Each dot represents one animal. Statistical analysis was performed via a one-way ANOVA and Tukey’s multiple comparison. ns, not significant; * p < 0.05; ** p < 0.01; *** p < 0.001; **** p < 0.0001. (H,J,L) For females, representative lanes were cropped from immunoblots of MEGF10 (H), PSD95 (J) and synaptophysin (L) from isolated PFC of female pups at postnatal days (P) 7, 14, 21 and 32. Full blots are shown in Supplementary Figure S1. (I,K,M) Quantitative analysis of total MEGF10 (I), PSD95 (K) and synaptophysin (M) protein expression normalized to β-actin (for MEGF10) and cofilin (for PSD95 and synaptophysin) in female pups at different developmental stages. Each dot represents one animal. Statistical analysis was performed via one-way ANOVA and Tukey’s multiple comparison. ns, not significant; * p < 0.05; ** p < 0.01; *** p < 0.001; **** p < 0.0001. All data are presented as the mean ± SD.
Figure 2
Figure 2
Astrocyte-mediated synaptic pruning during developmental stages in male and female infralimbic/prelimbic areas of the PFC. (A) Representative graphs from the Rat Brain Atlas (46) to show areas of tissue labelled for immunofluorescent immunohistochemistry and confocal imaging. (B) Representative confocal images of brain slices from male littermates labelled with GFAP/S100ß (astrocytes, magenta), synaptophysin (green) and LAMP1 (blue) at P7, 14, 21 and 32. Scale bar 10 µm. (C) Representative confocal (upper panels) and Imaris surface-rendered (lower panels) images of analyzed male astrocytes (insets from (B)). In the 3D reconstructions, only LAMP1+ and synaptophysin+ spots inside the astrocyte volume are rendered. Scale bar 2 µm. (D) Quantification of the engulfed synaptophysin spots within LAMP1 spots in astrocytes of the PFC normalized to the astrocyte volume at different postnatal developmental stages in male littermates. Each dot represents the average data of 6 analyzed astrocytes from each animal: n = 4 animals. One-way ANOVA, Tukey’s multiple comparison, * p < 0.05; ** p < 0.01; **** p < 0.0001. (E) Representative confocal images of brain slices from female littermates labelled with GFAP/S100ß (astrocytes, magenta), synaptophysin (green) and LAMP1 (blue) at P7, 14, 21 and 32. Scale bar 10 µm. (F) Representative confocal (upper panels) and Imaris surface-rendered (lower panels) images of analyzed female astrocytes (insets from (E)). In the 3D reconstructions, only LAMP1+ and synaptophysin+ spots inside the astrocyte volume are rendered. Scale bar 2 µm. (G) Quantification of the engulfed synaptophysin spots within LAMP1 spots in astrocytes of the PFC normalized to the astrocyte volume at different postnatal developmental stages of female littermates. Each dot represents the average data of six analyzed astrocytes from each animal: n = 4 animals. One-way ANOVA, Tukey’s multiple comparison, ** p < 0.01. All data are presented as the mean ± SD.
Figure 3
Figure 3
Assessment of cell viability in organotypic brain slice culture (OBSCs). (A) Representative confocal images of selective cell death (red) in the prelimbic/limbic area of OBSCs at different timepoints: days in vitro (DIV) 0, 7, 14 and 21. Scale bar 200 µm. (B) Quantification of cell death assessed via propidium iodide (PI) total fluorescence intensity normalized to DIV0. Each dot represents a single animal. Statistical analysis was performed via a one-way ANOVA and Tukey’s multiple comparison, * p < 0.05; ** p < 0.01. Data are presented as the mean ± SD.
Figure 4
Figure 4
MEGF10 expression in the cortex and astrocyte phagocytic capacity in infralimbic/prelimbic areas of the PFC of male and female OBSCs. (A) Representative lanes cropped from immunoblots show MEGF10 protein expression in the cortex isolated from male-derived OBSCs at DIV7, 14 and 21. Full blots are shown in Supplementary Figure S1. (B) Quantitative analysis of total MEGF10 protein expression normalized to β-actin in male-derived OBSCs at different timepoints. Each dot represents one animal, n = 6–7 animals. Statistical analysis was performed via one-way ANOVA repeated measures, with Tukey’s multiple comparison, ns, not significant. (C) Representative confocal images of OBSCs labelled with GFAP (astrocytes, magenta), synaptophysin (green) and LAMP1 (blue) at DIV7, 14 and 21 in male-derived OBSCs. Scale bar 25 µm. (D) Quantification of co-localized voxels positive for LAMP1, synaptophysin and GFAP. The phagocytic index is expressed as the ratio of “synphys+/LAMP1+/GFAP+” to “synphys+/LAMP1+” colocalized voxels. Each dot represents the average data of five pictures from one animal, n = 3–5 animals. Statistical analysis was performed via one-way ANOVA repeated measures (mixed effects) and Tukey’s multiple comparison, * p < 0.05; ** p < 0.01. All data are presented as the mean ± SD. (E) Representative lanes cropped from immunoblots show MEGF10 protein expression in the cortex isolated from female-derived OBSCs at DIV7, 14 and 21. Full blots are shown in Supplementary Figure S1. (F) Quantitative analysis of total MEGF10 protein expression normalized to β-actin in female-derived OBSCs at different timepoints. Each dot represents one animal, n = 5–7 animals. Statistical analysis was performed via one-way ANOVA repeated measures and Tukey’s multiple comparison, ns, not significant. (G) Representative confocal images of OBSCs labelled with GFAP (astrocytes, magenta), synaptophysin (green) and LAMP1 (blue) at DIV7, 14 and 21 in female-derived OBSCs. Scale bar 25 µm. (H) Quantification of co-localized voxels positive for LAMP1, synaptophysin and GFAP. The phagocytic index is expressed as the ratio of “synphys+/LAMP1+/GFAP+” to “synphys+/LAMP1+” colocalized voxels. Each dot represents the average data of five pictures from each animal, n = 4 animals. Statistical analysis was performed via one-way ANOVA repeated measures and Tukey’s multiple comparison, * p < 0.05; trend, p = 0.0795. All data are presented as the mean ± SD.

Similar articles

Cited by

References

    1. Magistretti P.J., Allaman I. Lactate in the Brain: From Metabolic End-Product to Signalling Molecule. Nat. Rev. Neurosci. 2018;19:235–249. doi: 10.1038/nrn.2018.19. - DOI - PubMed
    1. Hashimoto Y., Greene C., Munnich A., Campbell M. The CLDN5 Gene at the Blood-Brain Barrier in Health and Disease. Fluids Barriers CNS. 2023;20:22. doi: 10.1186/s12987-023-00424-5. - DOI - PMC - PubMed
    1. Bosworth A.P., Allen N.J. The Diverse Actions of Astrocytes during Synaptic Development. Curr. Opin. Neurobiol. 2017;47:38–43. doi: 10.1016/j.conb.2017.08.017. - DOI - PubMed
    1. Verkhratsky A., Untiet V., Rose C.R. Ionic Signalling in Astroglia beyond Calcium. J. Physiol. 2020;598:1655–1670. doi: 10.1113/JP277478. - DOI - PubMed
    1. Stogsdill J.A., Eroglu C. The Interplay between Neurons and Glia in Synapse Development and Plasticity. Curr. Opin. Neurobiol. 2017;42:1–8. doi: 10.1016/j.conb.2016.09.016. - DOI - PMC - PubMed

Publication types