. 2023 Dec 4;12(23):2767.
doi: 10.3390/cells12232767.

Contemporaneous Perioperative Inflammatory and Angiogenic Cytokine Profiles of Surgical Breast, Colorectal, and Prostate Cancer Patients: Clinical Implications

Affiliations

Contemporaneous Perioperative Inflammatory and Angiogenic Cytokine Profiles of Surgical Breast, Colorectal, and Prostate Cancer Patients: Clinical Implications

Leili Baghaie et al. Cells. .

Abstract

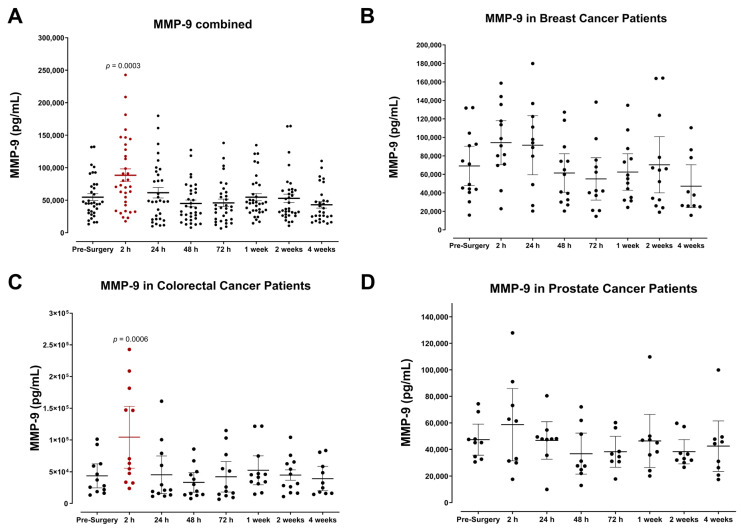
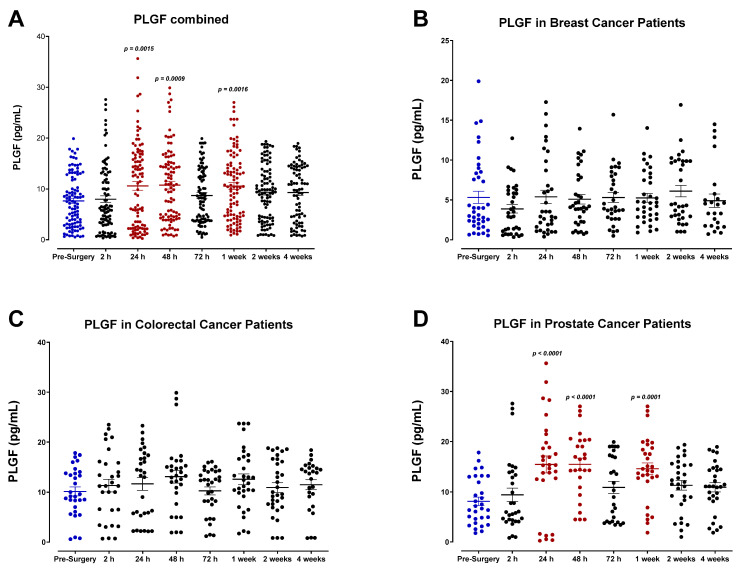
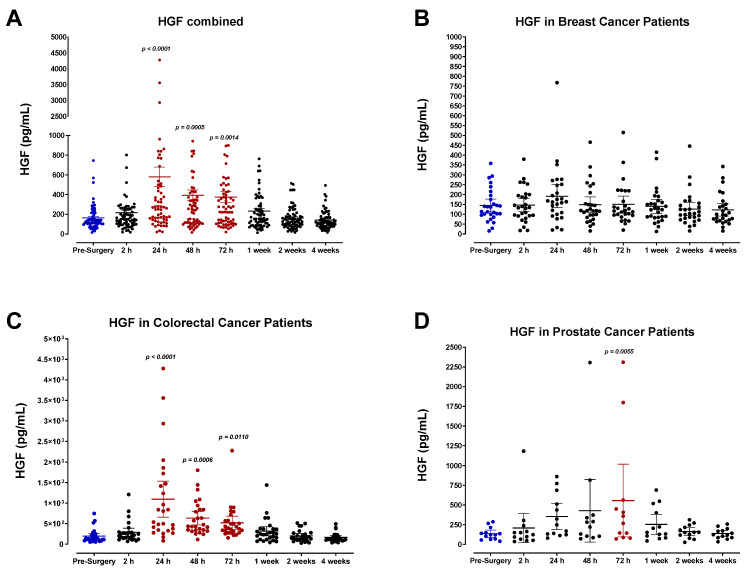
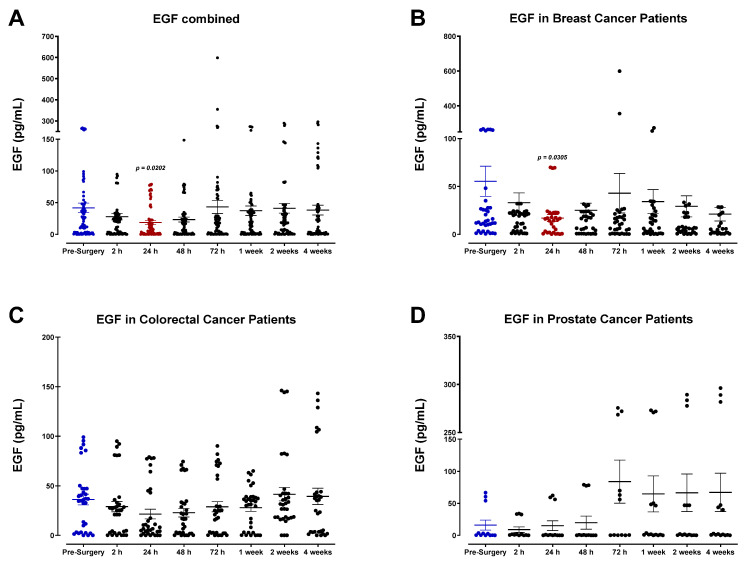
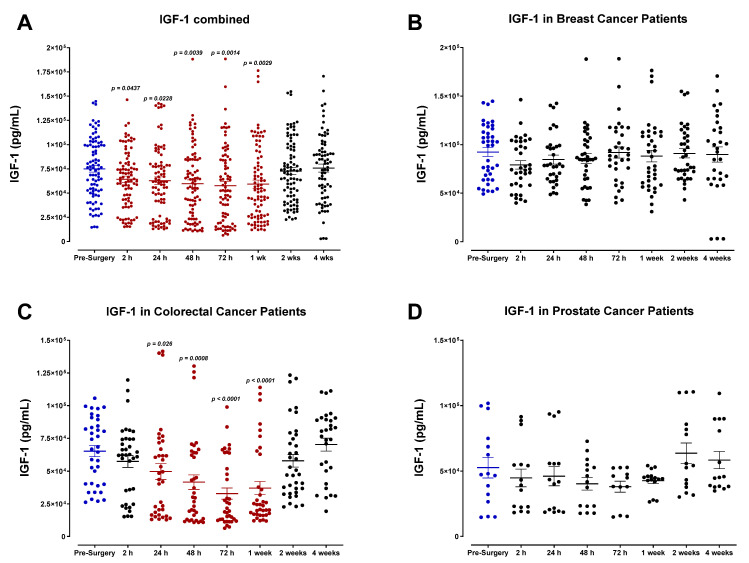
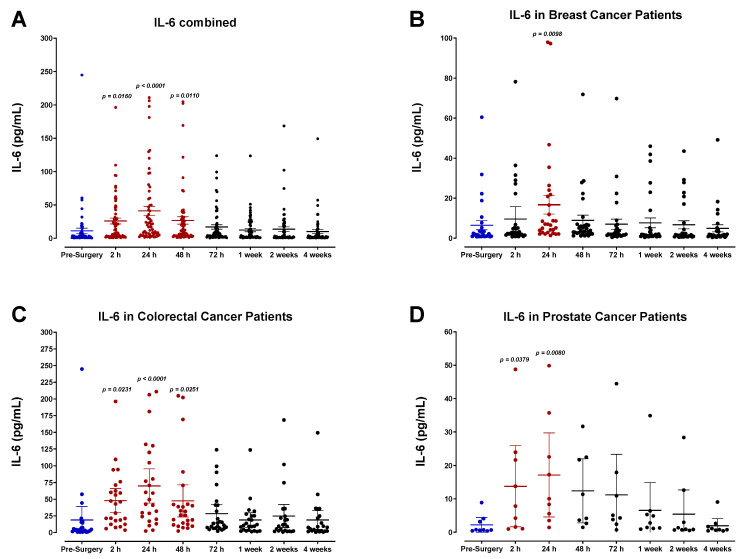
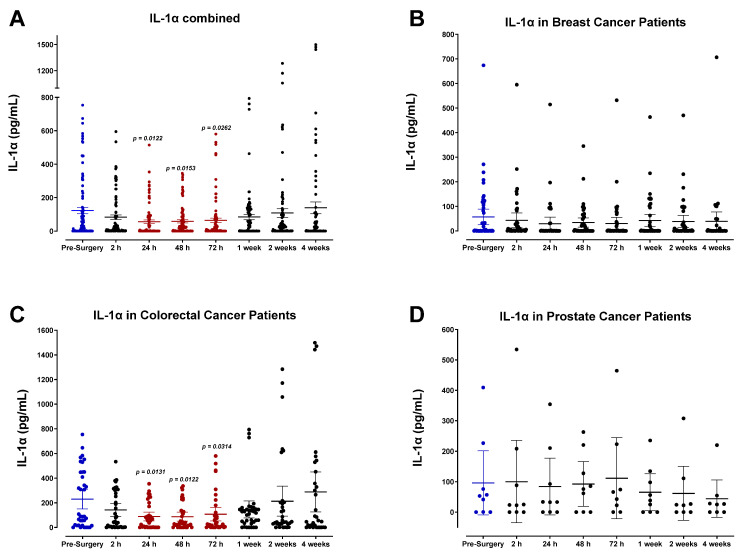
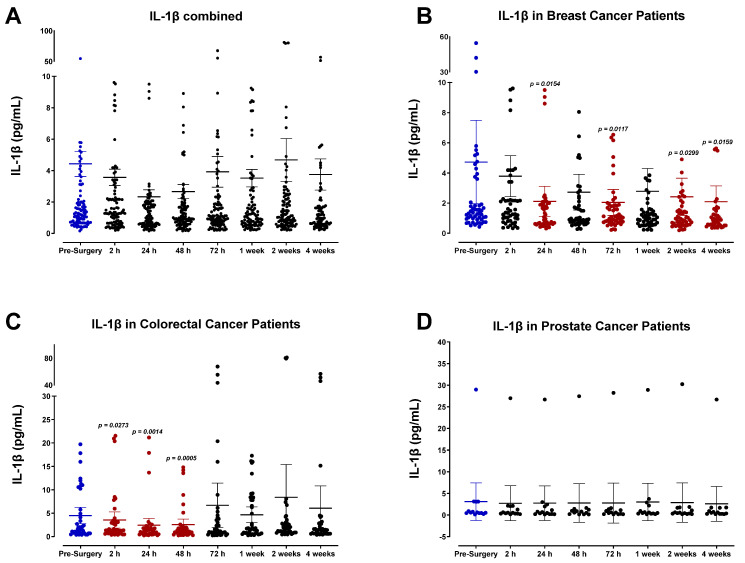
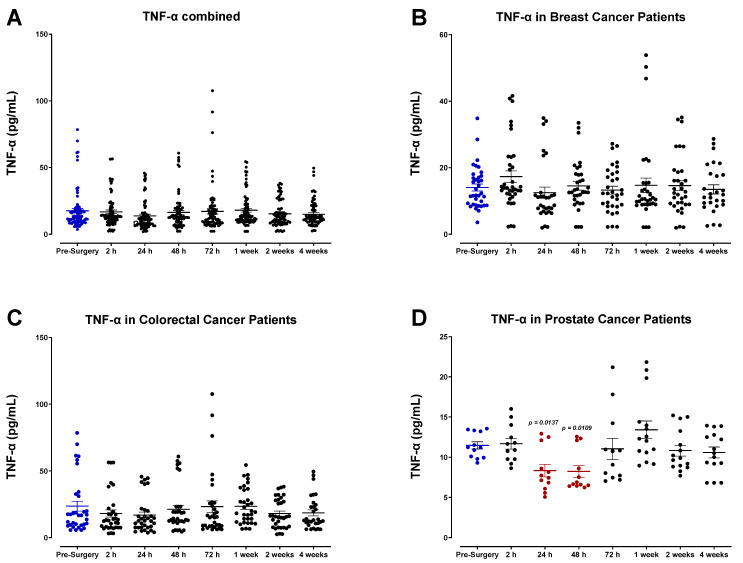
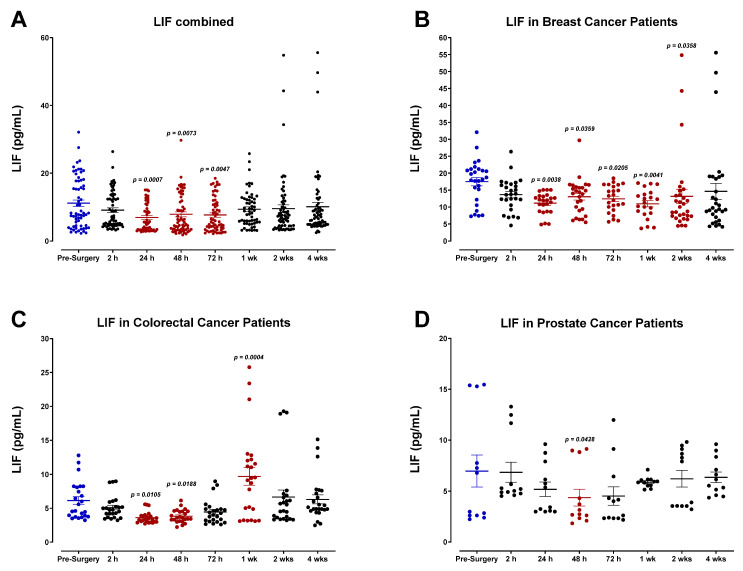
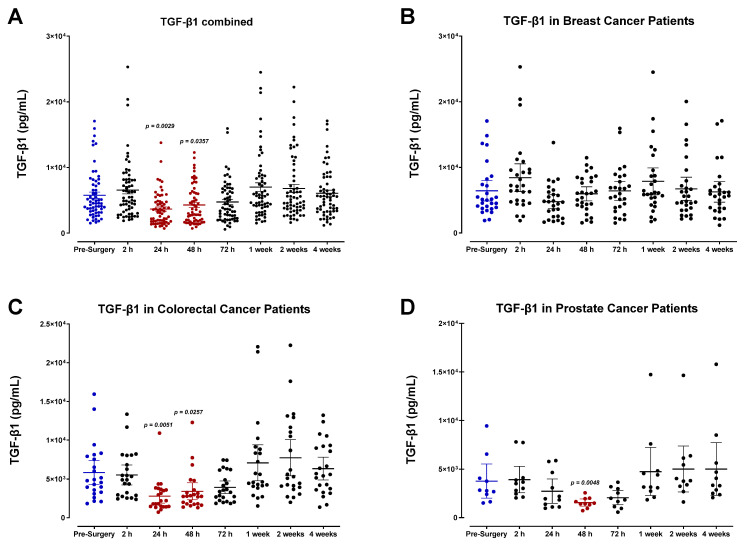
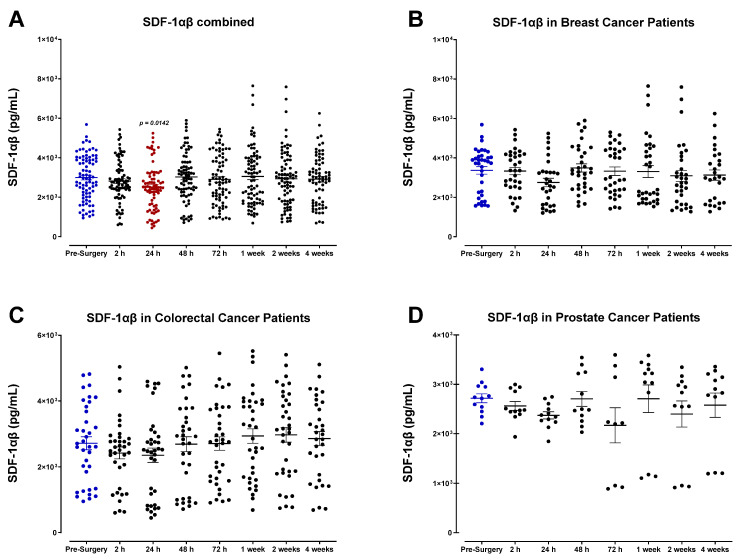
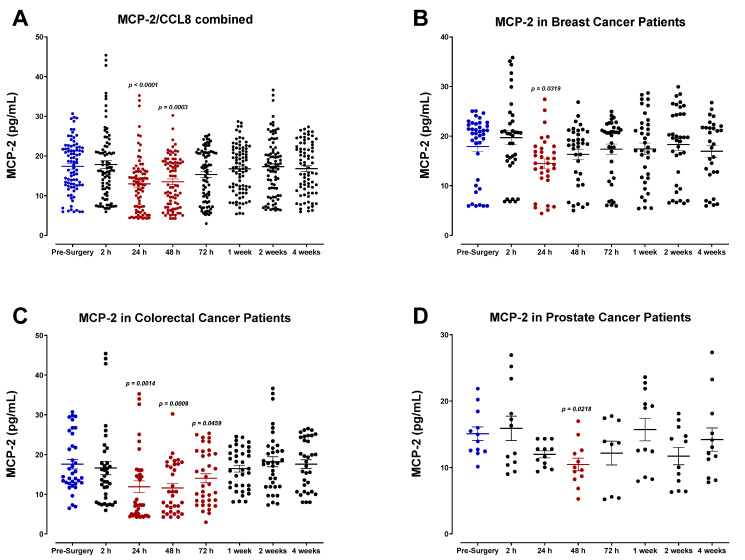
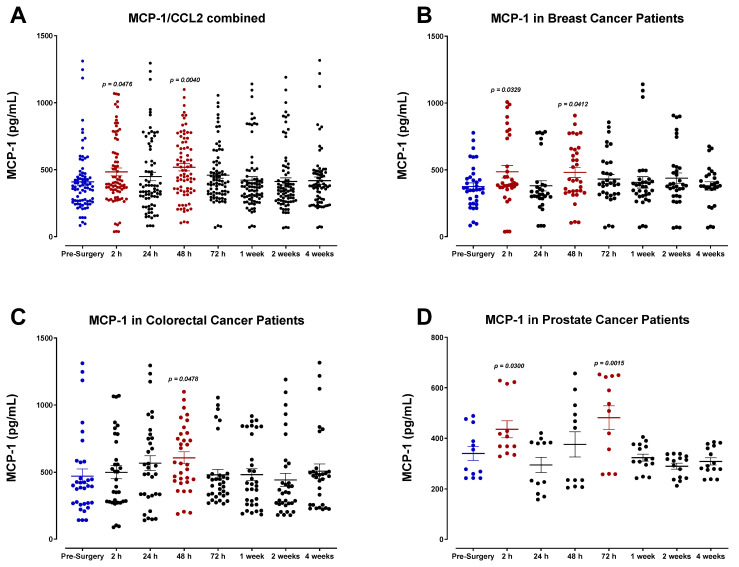
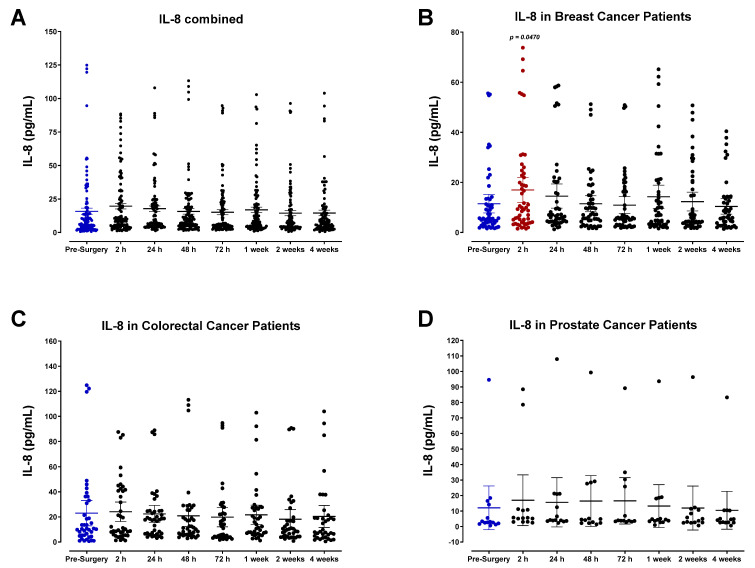
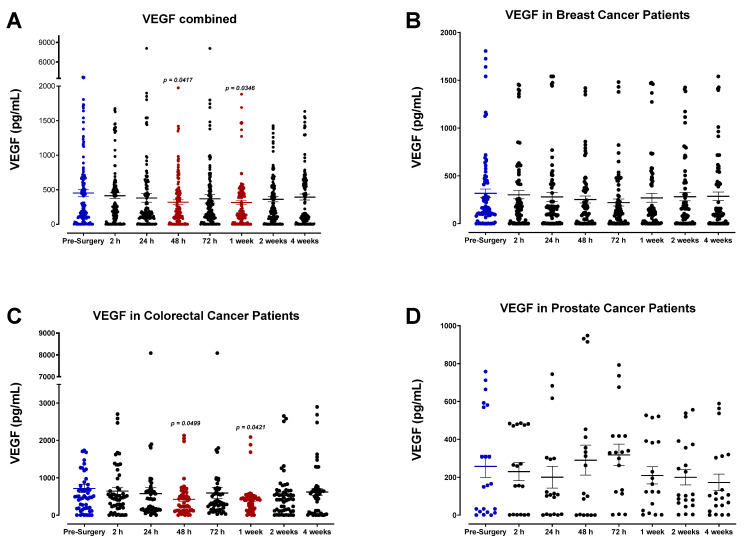
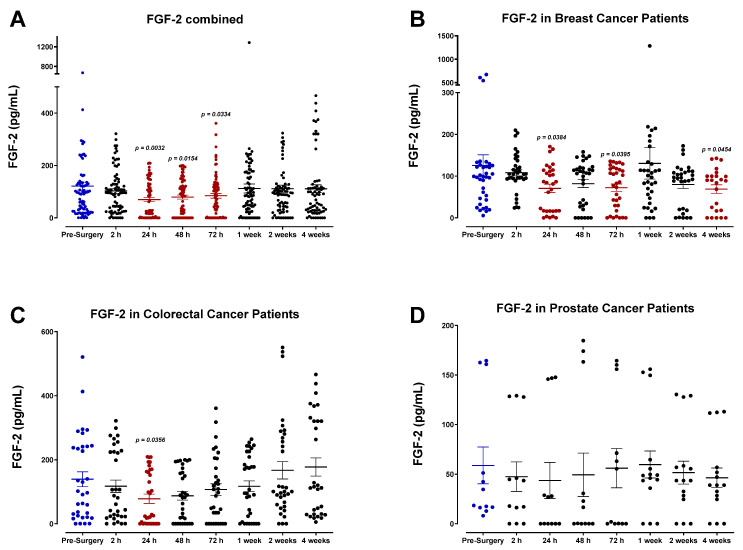
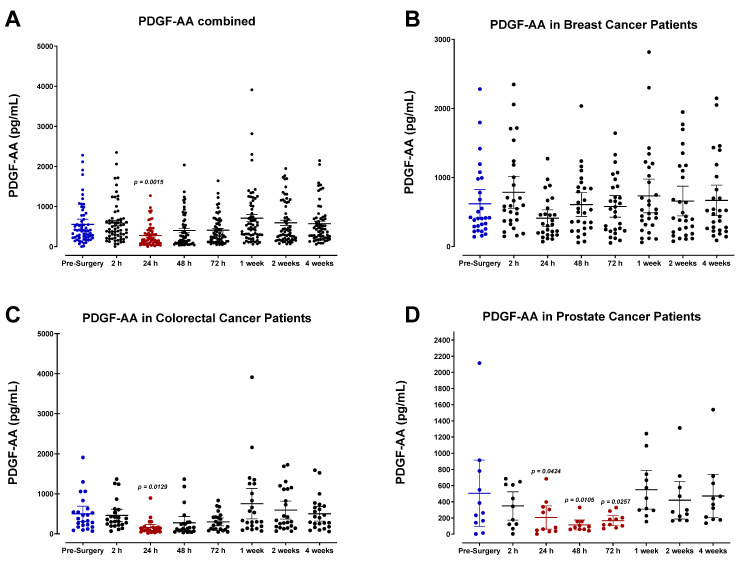
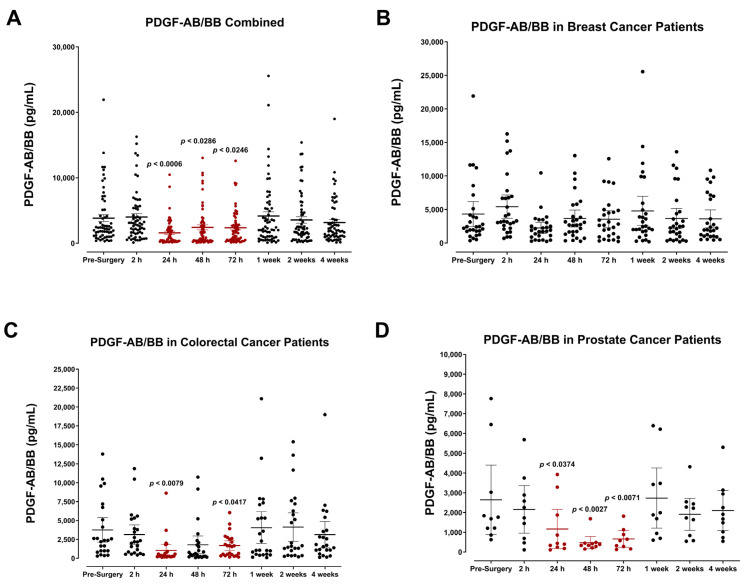
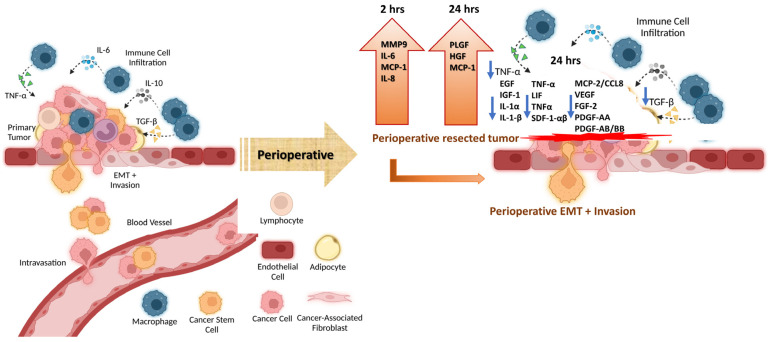
Surgery-induced tumor growth acceleration and synchronous metastatic growth promotion have been observed for decades. Surgery-induced wound healing, orchestrated through growth factors, chemokines, and cytokines, can negatively impact patients harboring residual or metastatic disease. We provide detailed clinical evidence of this process in surgical breast, prostate, and colorectal cancer patients. Plasma samples were analyzed from 68 cancer patients who had not received treatment before surgery or adjuvant therapy until at least four weeks post-surgery. The levels of plasma cytokines, chemokines, and growth factors were simultaneously quantified and profiled using multiplexed immunoassays for eight time points sampled per patient. The immunologic processes are induced immediately after surgery in patients, characterized by a drastic short-term shift in the expression levels of pro-inflammatory and angiogenic molecules and cytokines. A rapid and significant spike in circulating plasma levels of hepatocyte growth factor (HGF), interleukin-6 (IL-6), placental growth factor (PLGF), and matrix metalloproteinase-9 (MMP-9) after surgery was noted. The rise in these molecules was concomitant with a significant drop in transforming growth factor-β1 (TGF-β1), platelet-derived growth factor (PDGF-AB/BB), insulin-like growth factor-1 (IGF-1), and monocyte chemoattractant protein-2 (MCP-2). If not earlier, each plasma analyte was normalized to baseline levels within 1-2 weeks after surgery, suggesting that surgical intervention alone was responsible for these effects. The effects of surgical tumor removal on disrupting the pro-inflammatory and angiogenic plasma profiles of cancer patients provide evidence for potentiating malignant progression. Our findings indicate a narrow therapeutic window of opportunity after surgery to prevent disease recurrence.

Keywords: chemokines; colorectal cancer patients; cytokines; growth factors; pro-inflammatory and angiogenic plasma profiles of cancer patients; prostate; surgery-induced wound healing; surgical breast.


Conflict of interest statement

William W. Harless owns shares in ENCYT and has commercial interest and/or patents in the work under consideration. Alexander Wawer and Beth Lewis own shares in ENCYT.

Figures

Figure 1
Figure 1
Serum matrix metalloproteinase-9 (MMP-9) levels in surgical cancer patients during the perioperative period. (A) Combined patient analysis indicates a significant increase in plasma MMP-9 two hours after surgery compared to pre-surgery levels (p = 0.0003, n = 35). MMP-9 levels quickly returned to baseline within 24–48 h after surgery. Although not significant, there also appears to be a postoperative increase in MMP-9 plasma levels in (B) breast (n = 14) and (D) prostate cancer patients (n = 9). (C) Colorectal patients exhibited a significant increase in plasma MMP-9 two hours after surgery compared to pre-surgery levels (p = 0.0006, n = 12). All patient plasma samples were assayed in duplicate, and results were analyzed and compared using one-way analysis of variance (ANOVA) at 95% confidence using Fisher’s LSD test.
Figure 2
Figure 2
Plasma placental growth factor (PLGF) levels in surgical cancer patients during the perioperative period. (A) Combined patient analysis (n = 36) indicates a significant increase in plasma PLGF 24 h (p = 0.0015), 48 h (p = 0.009), and 1 week (p = 0.0016) after surgery in comparison to pre-surgery levels. (B) Breast cancer patients (n = 14) demonstrated attenuated overall PLGF levels, while colorectal cancer patients (n = 12) (C) showed no discernable trend compared to pre-surgery. In contrast, (D) prostate cancer patients exhibited a significant increase in PLGF levels at 24 h, 48 h, and 1 week (p < 0.0001, n = 10) after surgery in comparison to pre-surgery levels. All patient plasma samples were assayed in duplicate, and results were analyzed and compared using one-way analysis of variance (ANOVA) at 95% confidence using Fisher’s LSD test.
Figure 3
Figure 3
Plasma hepatocyte growth factor (HGF) levels in surgical cancer patients during the perioperative period. (A) Combined patient analysis indicates a significant increase in plasma HGF levels 24 h after surgery compared to pre-surgery levels (p < 0.0001, n = 68). HGF levels remained significantly elevated 48 h (p = 0.0005) and 72 h (p = 0.0014) after surgery. HGF levels returned to baseline approximately one week after surgery. (B) Breast cancer patients (n = 28) showed a non-significant increase in plasma HGF levels, while (C) colorectal cancer patients (n = 27) exhibited higher levels of plasma HGF after 24 h (p < 0.0001). The trend was sustained until 72 h post-surgery (p = 0.0006, 48 h; p = 0.0110, 72 h). (D) Prostate cancer patients (n = 13) demonstrated a delayed trend with an increase at 72 h (p = 0.0055) before returning to baseline. All patient plasma samples were assayed in duplicate, and results were analyzed and compared using one-way analysis of variance (ANOVA) at 95% confidence using Fisher’s LSD test.
Figure 4
Figure 4
Plasma epidermal growth factor (EGF) levels in surgical cancer patients during the perioperative period. (A) Combined patient analysis (n = 29) and (B) breast cancer patient (n = 13) data indicate a noteworthy but non-significant decrease in plasma EGF levels approximately 24 h after surgery (p = 0.0202 and 0.0305, respectively). EGF levels appeared to return to baseline approximately 72 h after surgery. (C) Colorectal (n = 11) and (D) prostate cancer patients (n = 5) had no significant increases compared to pre-surgery levels. All patient plasma samples were assayed in duplicate, and results were analyzed and compared using one-way analysis of variance (ANOVA) at 95% confidence using Fisher’s LSD test.
Figure 5
Figure 5
Plasma insulin-like growth factor-I (IGF-1) levels in surgical cancer patients during the perioperative period. (A) Combined patient analysis indicates a significant decrease in plasma IGF-1 as early as 2 h after surgery compared to pre-surgery levels (n = 30, p = 0.0437). IGF-1 levels were maintained and returned to baseline 2–4 weeks after surgery. Despite an apparent postoperative decrease, there was no significant trend in plasma levels of IGF-1 noted in (B) breast cancer patients (n = 13) or (D) prostate cancer patients (n = 5). Among each cancer type, (C) colorectal cancer patients demonstrated the most significant postoperative decrease in plasma IGF-1, particularly 72 h after surgery (n = 12, p < 0.0001). All patient plasma samples were assayed in duplicate, and results were analyzed and compared using one-way analysis of variance (ANOVA) at 95% confidence using Fisher’s LSD test.
Figure 6
Figure 6
Plasma levels of IL-6 in surgical cancer patients during the perioperative period. (A) Combined patient analysis indicates a significant increase in plasma IL-6 approximately 2 h after surgery, reaching its peak at 24 h compared to pre-surgery levels (p < 0.000, n = 66). After this time, IL-6 levels steadily returned to baseline within 72 h after surgery. (C) Colorectal cancer patients (p < 0.0001, n = 25) demonstrated significantly higher overall IL-6 plasma levels in comparison to (B) breast (p = 0.0098, n = 31) and (D) prostate cancer patients (p = 0.008, n = 10). All patient plasma samples were assayed in duplicate, and results were analyzed and compared using one-way analysis of variance (ANOVA) at 95% confidence using Fisher’s LSD test.
Figure 7
Figure 7
Plasma levels of IL-1α in surgical cancer patients during the perioperative period. (A) Combined patient analysis indicates a trending significant decrease in plasma IL-1α approximately 24–72 h after surgery in comparison to pre-surgery levels (p < 0.0262, n = 53). After this time, IL-1α levels steadily returned to baseline within four weeks after surgery. (C) Colorectal cancer patients (n = 22) demonstrated the most significant postoperative decrease in plasma IL-1α, particularly 24 h (p = 0.0131) and 48 h (p = 0.0122) after surgery. Despite an apparent postoperative decrease in the combined plasma analysis, there was no significant trend in plasma levels of IL-1α noted in (B) breast cancer patients (n = 28) or (D) prostate cancer patients (n = 3). All patient plasma samples were assayed in duplicate, and results were analyzed and compared using one-way analysis of variance (ANOVA) at 95% confidence using Fisher’s LSD test.
Figure 8
Figure 8
Plasma levels of IL-1β in surgical cancer patients during the perioperative period. (A) Combined patient analysis indicates a trending but non-significant decrease in plasma IL-1β approximately 24–48 h after surgery in comparison to pre-surgery levels (n = 65). After this time, IL-1β levels returned to baseline approximately two weeks after surgery. Overall, plasma analysis of IL-1β levels demonstrated variation among individual patients and cancer types. (B) Breast cancer patients (n = 30) had fluctuation, with a significant decrease at 24 h (p = 0.0154), then increased back to baseline before decreasing again at 72 h (p = 0.0117), 2 weeks (p = 0.0299), and 4 weeks (p = 0.0159). IL-1β plasma levels in (C) colorectal cancer patients (n = 25) decreased as early as 2 h and then returned to baseline after 72 h, with the most significant decrease seen at 24 h (p = 0.0014). No difference was seen in (D) prostate cancer patients (n = 10). All patient plasma samples were assayed in duplicate, and results were analyzed and compared using one-way analysis of variance (ANOVA) at 95% confidence using Fisher’s LSD test.
Figure 9
Figure 9
Plasma tumor necrosis factor (TNF-α) levels in surgical cancer patients during the perioperative period. (A) Combined patient analysis indicates high variation among each timepoint analyzed. There is also a trending but non-significant decrease in plasma TNF-α approximately 24 h after surgery compared to pre-surgery levels (n = 29). (B) Despite an apparent postoperative decrease in the combined plasma analysis, there was no significant trend in plasma levels of TNF-α noted in breast (n = 13) or (C) colorectal cancer patients (n = 11). However, there was a significant postoperative decrease in plasma TNF-α observed in (D) prostate cancer patients (p < 0.0137, n = 5) approximately 24–48 h after surgery before returning to baseline levels. All patient plasma samples were assayed in duplicate, and results were analyzed and compared using one-way analysis of variance (ANOVA) at 95% confidence using Fisher’s LSD test.
Figure 10
Figure 10
Plasma levels of leukemia inhibitory factor (LIF) in surgical cancer patients during the perioperative period. (A) Combined patient analysis indicates a significant decrease in plasma LIF approximately 24 h after surgery compared to pre-surgery levels (p = 0.0007, n = 19). After this time, LIF levels steadily returned to baseline within one week after surgery. (B) Breast cancer patients demonstrated significantly higher overall LIF plasma levels in comparison to (C) colorectal (p = 0.0105, n = 7) and (D) prostate cancer patients (p = 0.0428, n = 3). Interestingly, LIF levels in colorectal cancer patients increase above baseline at approximately one week post-surgery before decreasing again. All three cancer types return to baseline levels around two weeks post-surgery. All patient plasma samples were assayed in duplicate, and results were analyzed and compared using one-way analysis of variance (ANOVA) at 95% confidence using Fisher’s LSD test.
Figure 11
Figure 11
Plasma transforming growth factor (TGF-β1) levels in surgical cancer patients during the perioperative period. (A) Combined patient analysis indicates a significant decrease in plasma TGF-β1 measured 24 and 48 h after surgery (p < 0.0357, n = 29). TGF-β1 levels quickly returned to baseline within one week after surgery. (B) In breast cancer patients (n = 13), there was no significant difference in plasma TGF-β1 measured between pre- and post-surgery. In contrast, (C) colorectal cancer patients (n = 12) had a significant decrease at 24 h (p = 0.0051) and 48 h (p = 0.0257) compared to pre-surgery levels. Similarly, (D) in prostate cancer patients (n = 4), there was a significant decrease in plasma TGF-β1 levels measured after 48 h (p = 0.0048). All patient plasma samples were assayed in duplicate, and results were analyzed and compared using one-way analysis of variance (ANOVA) at 95% confidence using Fisher’s LSD test.
Figure 12
Figure 12
Plasma levels of stromal cell-derived factor (SDF-1) α/β in surgical cancer patients during the perioperative period. (A) Combined patient analysis indicates a slightly significant drop in plasma SDF-1α/β approximately 24 h after surgery compared to pre-surgery levels (p = 0.0142, n = 29). SDF-1α/β levels quickly returned to baseline within 48 h after surgery. There was no significant difference in SDF-1α/β plasma levels observed during the perioperative period in individual cancer types: (B) breast (n = 13), (C) colorectal (n = 12), and (D) prostate cancer patients (n = 4). All patient plasma samples were assayed in duplicate, and results were analyzed and compared using one-way analysis of variance (ANOVA) at 95% confidence using Fisher’s LSD test.
Figure 13
Figure 13
Plasma monocyte chemoattractant protein (MCP-2) levels in surgical cancer patients during the perioperative period. (A) Combined patient analysis indicates a significant decrease in plasma MCP-2 24 h (p < 0.0001) and 48 h (p = 0.0003) after surgery in comparison to pre-surgery levels (n = 29). MCP-2 levels quickly returned to baseline within 1–2 weeks after surgery. (B) Breast cancer patients (n = 13) also demonstrated a decrease in MCP-2 levels 24 h after surgery (p = 0.0319) prior to returning to baseline, whereas (C) colorectal cancer patients (n = 12) exhibited a maintained drop from 24–72 h (p < 0.0459). (D) Prostate cancer patients (n = 4) had fluctuating levels when compared to pre-surgery levels; however, they were only significant at 48 h (p = 0.0218). All patient plasma samples were assayed in duplicate, and results were analyzed and compared using one-way analysis of variance (ANOVA) at 95% confidence using Fisher’s LSD test.
Figure 14
Figure 14
Plasma monocyte chemoattractant protein MCP-1 levels in surgical cancer patients during the perioperative period. (A) Combined patient analysis indicates increases in plasma MCP-1 levels at 2 h (p = 0.0476) and 48 h (p = 0.0040) post-surgery (n = 29). A similar trend is seen in (B) breast cancer patients (p < 0.0412, n = 13), while (D) prostate cancer patients (n = 5) had increases at 2 h (p = 0.0300) and 72 h (p = 0.0015). (C) Colorectal cancer patients (n = 11) had a slight increase in plasma at 24 h; however, it was only significant at 48 h (p = 0.0478). All patient plasma samples were assayed in duplicate, and results were analyzed and compared using one-way analysis of variance (ANOVA) at 95% confidence using Fisher’s LSD test.
Figure 15
Figure 15
Plasma levels of IL-8 (CXCL8) in surgical cancer patients during the perioperative period. (A) Combined patient analysis indicates no discernable trend in plasma IL-8 levels during the perioperative period, and high variation is apparent among individual patients and cancer types (n = 65). (B) There is a significant increase in breast cancer patients at 2 h (p = 0.0470, n = 30) before returning to baseline levels after 48 h. There is no significant difference in IL-8 plasma levels observed during the perioperative period in (C) colorectal (n = 25) or (D) prostate cancer patients (n = 10). All patient plasma samples were assayed in duplicate, and results were analyzed and compared using one-way analysis of variance (ANOVA) at 95% confidence using Fisher’s LSD test.
Figure 16
Figure 16
Plasma levels of vascular endothelial growth factor (VEGF) in surgical cancer patients during the perioperative period. (A) Combined patient analysis indicates a decreasing trend in postoperative plasma VEGF levels at 48 h (p = 0.0417) and 1 week (p = 0.0346) post-surgery (n = 56). Similarly, (C) colorectal cancer patients (n = 20) had significant decreases at 48 h (p = 0.0499) and 1 week (p = 0.0421). Despite a decreasing trend in postoperative plasma levels of VEGF, there is no significant difference in plasma levels observed during the perioperative period in (B) breast (n = 27) and (D) prostate cancer patients (n = 9). All patient plasma samples were assayed in duplicate, and results were analyzed and compared using one-way analysis of variance (ANOVA) at 95% confidence using Fisher’s LSD test.
Figure 17
Figure 17
Plasma fibroblast growth factor (FGF-2) levels in surgical cancer patients during the perioperative period. (A) Combined patient analysis indicates a decreasing trend in plasma FGF-2 levels approximately 24 h after surgery (p = 0.0032), quickly returning to baseline 1-week post-surgery (n = 29). (B) Breast cancer patients (n = 13) had fluctuations in FGF-2 levels, with significant drops noted at 24 h (p = 0.0384), 72 h (p = 0.0395), and 4 weeks (p = 0.0454) post-surgery. (C) Colorectal cancer patients (n = 11) had a decrease at 24 h (p = 0.0356) before returning to baseline after 72 h. (D) prostate cancer patients (n = 5) had no significant changes in FGF-2 levels in the perioperative operative period. All patient plasma samples were assayed in duplicate, and results were analyzed and compared using one-way analysis of variance (ANOVA) at 95% confidence using Fisher’s LSD test.
Figure 18
Figure 18
Plasma platelet-derived growth factor (PDGF-AA) levels in surgical cancer patients during the perioperative period. (A) Combined patient analysis indicates a significant decrease in plasma PDGF-AA measured approximately 24 h after surgery (p = 0.0015, n = 62) compared to pre-surgery levels. PDGF-AA levels quickly returned to baseline within one week after surgery. Despite a decreasing trend in postoperative plasma levels of PDGF-AA, no significant difference in plasma levels was observed during the perioperative period in (B) breast cancer patients (n = 28). (C) Colorectal cancer patients (n = 23) also had a decrease at 24 h (p = 0.0129) before returning to baseline levels, while (D) prostate cancer patients (n = 11) maintained decreased levels from 24 to 72 h (p < 0.0424) post-surgery. All patient plasma samples were assayed in duplicate, and results were analyzed and compared using one-way analysis of variance (ANOVA) at 95% confidence using Fisher’s LSD test.
Figure 19
Figure 19
Plasma platelet-derived growth factor (PDGF-AB/BB) levels in surgical cancer patients during the perioperative period. (A) Combined patient analysis indicates a significant decrease in plasma PDGF-AB/BB measured approximately 24 h (p = 0.0006, n = 62), 48 h (p = 0.0286), and 72 h (p = 0.0246) after surgery. PDGF-AB/BB levels quickly returned to baseline within one week. Despite a decreasing trend in postoperative plasma levels of PDGF-BB, no significant difference in plasma levels was observed during the perioperative period in (B) breast cancer patients (n = 28). (C) Colorectal cancer patients (n = 23) had decreases noted in only the 24 h (p = 0.0079) and 72 h (p = 0.0417) post-surgery periods. (D) Prostate cancer patients (n = 11) similarly had significantly decreased levels of PDGF-AB/BB from 24 to 72 h post-surgery (p < 0.0374) before returning to preoperative levels. All patient plasma samples were assayed in duplicate, and results were analyzed and compared using one-way analysis of variance (ANOVA) at 95% confidence using Fisher’s LSD test.
Figure 20
Figure 20
The paradox of pro-inflammatory and angiogenetic cytokines in host response against perioperative surgical breast, colorectal, and prostate cancer patients, demonstrating the complex fluctuation of cytokine profiling. Citation: Taken in part from Cancers 2022, 14, 2178 [146].

Similar articles

Cited by

References

    1. Demicheli R., Retsky M.W., Hrushesky W.J., Baum M., Gukas I.D. The effects of surgery on tumor growth: A century of investigations. Ann. Oncol. 2008;19:1821–1828. doi: 10.1093/annonc/mdn386. - DOI - PubMed
    1. Ceelen W., Pattyn P., Mareel M. Surgery, wound healing, and metastasis: Recent insights and clinical implications. Crit. Rev. Oncol./Hematol. 2014;89:16–26. doi: 10.1016/j.critrevonc.2013.07.008. - DOI - PubMed
    1. Yamashita J.I., Kurusu Y., Fujino N., Saisyoji T., Ogawa M. Detection of circulating tumor cells in patients with non-small cell lung cancer undergoing lobectomy by video-assisted thoracic surgery: A potential hazard for intraoperative hematogenous tumor cell dissemination. J. Thorac. Cardiovasc. Surg. 2000;119:899–905. doi: 10.1016/S0022-5223(00)70084-5. - DOI - PubMed
    1. Ge M.J., Shi D., Wu Q.C., Wang M., Li L.B. Observation of circulating tumour cells in patients with non-small cell lung cancer by real-time fluorescent quantitative reverse transcriptase-polymerase chain reaction in peroperative period. J. Cancer Res. Clin. Oncol. 2006;132:248–256. doi: 10.1007/s00432-005-0059-3. - DOI - PubMed
    1. Yamaguchi K., Takagi Y., Aoki S., Futamura M., Saji S. Significant detection of circulating cancer cells in the blood by reverse transcriptase-polymerase chain reaction during colorectal cancer resection. Ann. Surg. 2000;232:58–65. doi: 10.1097/00000658-200007000-00009. - DOI - PMC - PubMed

Publication types