. 2023 Nov 21;15(23):5508.
doi: 10.3390/cancers15235508.

The MYC-Regulated RNA-Binding Proteins hnRNPC and LARP1 Are Drivers of Multiple Myeloma Cell Growth and Disease Progression and Negatively Predict Patient Survival

Affiliations

The MYC-Regulated RNA-Binding Proteins hnRNPC and LARP1 Are Drivers of Multiple Myeloma Cell Growth and Disease Progression and Negatively Predict Patient Survival

Marcel Seibert et al. Cancers (Basel). .

Abstract

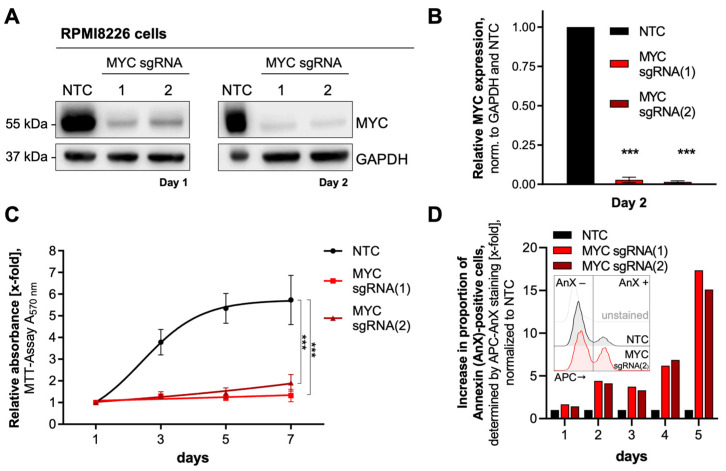
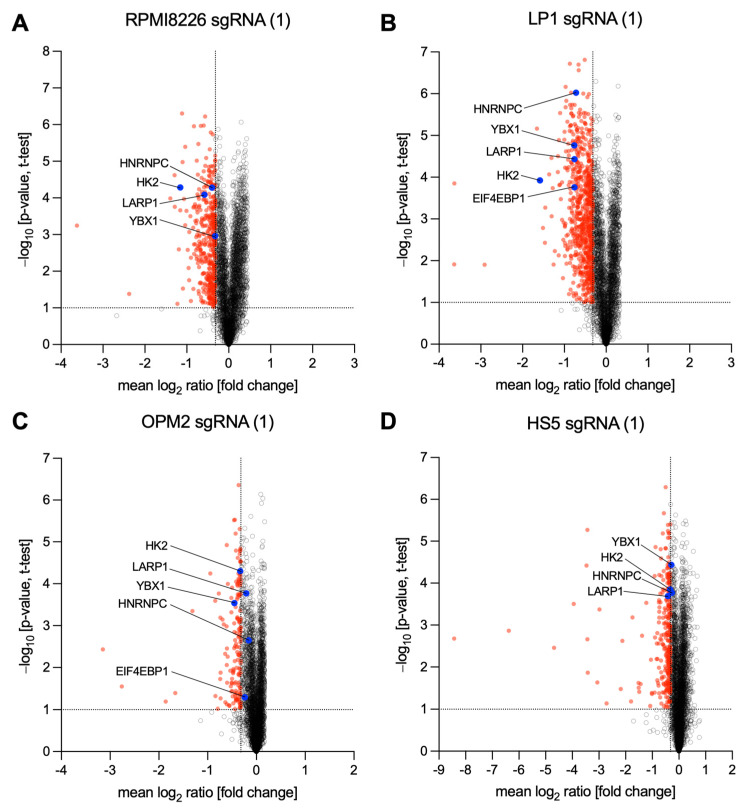
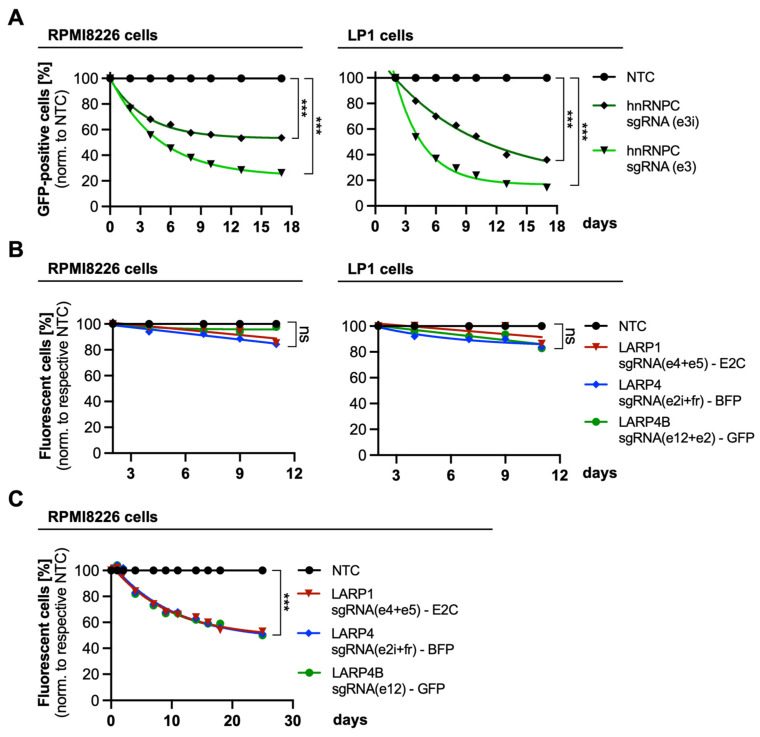
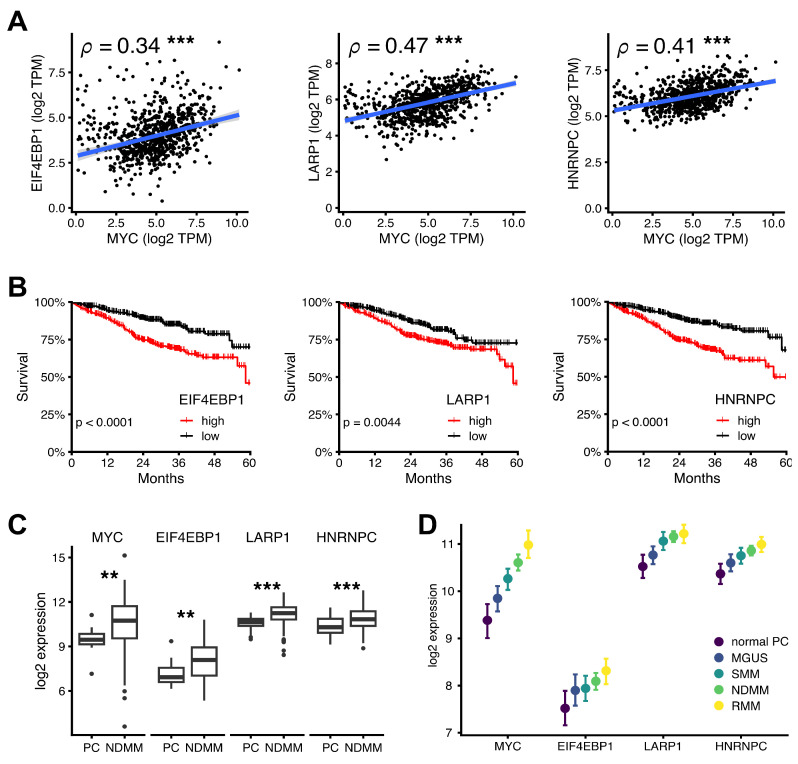
Multiple myeloma (MM) is a malignant plasma cell disorder in which the MYC oncogene is frequently dysregulated. Due to its central role, MYC has been proposed as a drug target; however, the development of a clinically applicable molecule modulating MYC activity remains an unmet challenge. Consequently, an alternative is the development of therapeutic options targeting proteins located downstream of MYC. Therefore, we aimed to identify undescribed MYC-target proteins in MM cells using Stable Isotope Labeling with Amino Acids in Cell Culture (SILAC) and mass spectrometry. We revealed a cluster of proteins associated with the regulation of translation initiation. Herein, the RNA-binding proteins Heterogeneous Nuclear Ribonucleoprotein C (hnRNPC) and La Ribonucleoprotein 1 (LARP1) were predominantly downregulated upon MYC depletion. CRISPR-mediated knockout of either hnRNPC or LARP1 in conjunction with redundant LARP family proteins resulted in a proliferative disadvantage for MM cells. Moreover, high expression levels of these proteins correlate with high MYC expression and with poor survival and disease progression in MM patients. In conclusion, our study provides valuable insights into MYC's role in translation initiation by identifying hnRNPC and LARP1 as proliferation drivers of MM cells and as both predictive factors for survival and disease progression in MM patients.

Keywords: La Ribonucleoprotein 1 (LARP1); MYC target pathways; RNA-binding proteins (RBPs); heterogeneous nuclear ribonucleoprotein C (hnRNPC); multiple myeloma; translation.


Conflict of interest statement

The authors declare no conflict of interest.

Figures

Figure 1
Figure 1
Characterization of MYC knockout RPMI8226 cells. (A) Western blots were probed with anti-MYC antibodies to detect MYC expression one day (left panel) and two days (right panel) after transduction with MYC-targeting sgRNAs. NTC RPMI8226 cells served as controls. An anti-GAPDH antibody was used for loading control. (B) Quantification of MYC expression on day two is shown in A, right panel. Normalized values are the mean ± SD of three replicates. Statistical significance was determined by one-way ANOVA with Bonferroni’s Multiple Comparison Test; p < 0.0001 (***). (C) Time-dependent cell viability/metabolic activity, measured by the MTT assay, after MYC knockout. The data are normalized to day 1 and presented as the mean ± SD of five technical replicates. Statistical significance was determined by a one-way ANOVA of the rate constant of an exponential fit excluding the plateau phase at day 7 with Bonferroni’s Multiple Comparison Test, p < 0.0001 (***). (D) Determination of apoptosis in MYC knockout cells after transduction at indicated timepoints. Multiples of apoptotic cells were measured by AnnexinV (AnX)-APC fluorescence (depicted in the square as an example). The values of each time point were normalized to the respective NTC. Abbreviations: GAPDH, Glyceraldehyde 3-phosphate dehydrogenase; kDa, kilo Dalton; NTC, non-target control.
Figure 2
Figure 2
Volcano plots showing fold changes of protein expression upon MYC depletion. (AD) Log2 [fold change] values and the respective p-values (–log10 p-value, t-test, four technical replicates) of quantified proteins two days after transduction by MYC targeting sgRNA(1) in cell lines RPMI8226, LP1, OPM2, and HS5 cells as indicated. Red-marked proteins were significantly downregulated. The thresholds for significant regulations (log2 [fold change]) were set according to the publication of known MYC target proteins (described in [27]). Outlier analysis was performed using the Benjamini–Hochberg method with a false discovery rate (FDR) < 0.05. Further analyzed MYC target proteins are labeled in blue.
Figure 3
Figure 3
Combined Venn diagram representing total numbers of downregulated proteins by both MYC targeting sgRNA(1) and (2) of four used cell lines. The threshold for protein regulations was set to log2 [FC] < −0.32 (0.80-fold, compared to NTC). Statistical significance for protein regulations was determined by t-tests (sgRNA targeting MYC vs. NTC; –log [p-value] > 1.0). Protein regulation in HS5 cells only (dotted line) was excluded from the protein group being regulated in MM-derived cell lines. Intersections were calculated by the web-based Venn diagram tool (https://bioinformatics.psb.ugent.be/webtools/Venn/, accessed on 15 June 2022).
Figure 4
Figure 4
Validation of potentially MYC target proteins in MM-derived cell lines. (A) Representative Western blots of downregulated target proteins (4EBP1 and LARP1) involved in translational control in RPMI8226 (upper panel) and LP1 cells (lower panel) on day 5 after transduction with MYC targeting sgRNA(2). β-Tubulin served as loading control. (B) Quantification of Western blot analyses. Normalized values are the mean ± SD of two (RPMI8226) and three replicates (LP1). Statistical significance was determined by a two-way ANOVA with Bonferroni’s Multiple Comparison Test; p < 0.001 (***), p < 0.01 (**). Abbreviation: 4EBP1, 4E Binding Protein; NTC, non-target control; kDa, kilo Dalton; LARP1, La-Ribonucleoprotein 1.
Figure 5
Figure 5
Downregulation of hnRNPC upon MYC depletion. (A) Manhattan plot showing molecular function (MF) enrichment analysis of downregulated proteins in MM-derived cell lines (left panel) and HS5 control cells (right panel). The x-axis represents MF terms from GeneOntology (GO), where terms of the same GO subtree are located closer to each other. The y-axis shows the adjusted enrichment p-values on a negative log10 scale. The circle sizes are by the corresponding MF term size. Enrichment analysis was performed using g:Profiler (version e106_eg53_p16_65fcd97) [21] with the Benjamini–Hochberg FDR multiple testing correction method applying a significance threshold of 0.05. Significantly enriched MFs were numbered ((1) RNA-binding, (2) nucleic acid-binding, (3) structural constituent of the ribosome, (4) organic cyclic compound binding, (5) heterocyclic compound binding, and (6) catalytic activity, acting on a nucleic acid). (B) Identified downregulated RNA-binding proteins (RBPs, numbered (1) in (A) on day two upon MYC depletion (sgRNA(2)), exemplary shown for LP1 cells. Ribosomal proteins, mRNA processing, and translation factors each comprise over 8% of RBPs (red dotted line). (C) Western blot analysis of Heterogeneous Ribonucleoprotein Particle C (hnRNPC) expression in MYC-depleted LP1 (upper) and RPMI8226 cells (lower panel) on day five upon MYC depletion (sgRNA(2)). β-Tubulin served as loading control. (D) Quantification of decreased hnRNPC expression shown in C. Normalized values are the mean ± SD of two replicates. Statistical significance was determined by a two-way ANOVA with Bonferroni’s Multiple Comparison Test; p < 0.001 (***), p < 0.01 (**); ns, non-significant.
Figure 6
Figure 6
The competitive proliferation of MYC target-depleted MM cell lines. (A) Competitive proliferation of hnRNPC-depleted RPMI8226 (left panel) and LP1 cells (right panel). Measured are percentages of GFP-fluorescent knockout cells on the first day and day 17 of the proliferation assays. (B) Competitive proliferation analysis of RPMI8226 (left panel) and LP1 cells (right panel) upon individual LARP protein knockouts using a combination of two sgRNA targeting one LARP gene. (C) Competitive growth analysis of RPMI8226 cells upon triple LARP protein knockout (LARP1, LARP4, and LARP4B). All three LARP proteins were knocked out simultaneously (‘triple KO’), using sgRNA as indicated, but percentages of individual fluorescence signals (E2Crimson (E2C), BFP, or GFP, as indicated) were measured separately. Values were normalized to the respective NTC (triple NTC). Statistical significance was determined by the extra sum-of-squares F test to evaluate differences in one-phase decay curve fitting; p < 0.0001 (***); ns, non-significant.
Figure 7
Figure 7
MYC and MYC target mRNA expression and stratification of overall survival in multiple myeloma patients. (A) Correlation of gene expression of MYC with EIF4EBP1 (4EBP1), LARP1, and hnRNPC expression (TPM, transcripts per million) in CD138+ bone marrow samples from MMRF CoMMpass study patients at first visit (n = 762). Measurements from individual patients (black dots) and robust linear regression lines (blue) are shown. The association between MYC and its target is quantified by the Spearman rank coefficient ρ (***, p-value < 0.001, calculated using algorithm AS 89). (B) Overall survival of MMRF CoMMpass study patients stratified by above- (“high”, n = 381) and below-median (“low”, n = 381) mRNA expression of EIF4EBP1, LARP1, and hnRNPC. Low- and high-expression groups were compared to the p -value by the log-rank test. (C) Gene expression of MYC and MYC targets in plasma cells (PC) from healthy donors (n = 15) and from newly diagnosed multiple myeloma (NDMM) patients (n = 75). p-value by the Wilcox signed rank test; p < 0.001 (***), p < 0.01 (**). (D) Parameter estimates and 95% probability intervals for log2 expression per gene and disease stage (normal PC, monoclonal gammopathy of unknown significance (MGUS, n = 21), smoldering multiple myeloma (SMM, n = 23), newly diagnosed multiple myeloma (NDMM, n = 24), and relapsed multiple myeloma (RMM, n = 28) by ordinal regression analysis.

Similar articles

Cited by

References

    1. Kyle R.A., Rajkumar S.V. Multiple myeloma. N. Engl. J. Med. 2004;351:1860–1873. doi: 10.1056/NEJMra041875. - DOI - PubMed
    1. Anderson K.C. Progress and Paradigms in Multiple Myeloma. Clin. Cancer Res. 2016;22:5419–5427. doi: 10.1158/1078-0432.CCR-16-0625. - DOI - PMC - PubMed
    1. Hansen D.K., Sidana S., Peres L.C., Colin Leitzinger C., Shune L., Shrewsbury A., Gonzalez R., Sborov D.W., Wagner C., Dima D., et al. Idecabtagene Vicleucel for Relapsed/Refractory Multiple Myeloma: Real-World Experience from the Myeloma CAR T Consortium. J. Clin. Oncol. 2023;41:2087–2097. doi: 10.1200/JCO.22.01365. - DOI - PMC - PubMed
    1. Chng W.J., Huang G.F., Chung T.H., Ng S.B., Gonzalez-Paz N., Troska-Price T., Mulligan G., Chesi M., Bergsagel P.L., Fonseca R. Clinical and biological implications of MYC activation: A common difference between MGUS and newly diagnosed multiple myeloma. Leukemia. 2011;25:1026–1035. doi: 10.1038/leu.2011.53. - DOI - PMC - PubMed
    1. Sabò A., Kress T.R., Pelizzola M., De Pretis S., Gorski M.M., Tesi A., Morelli M.J., Bora P., Doni M., Verrecchia A., et al. Selective transcriptional regulation by Myc in cellular growth control and lymphomagenesis. Nature. 2014;511:488–492. doi: 10.1038/nature13537. - DOI - PMC - PubMed

Grants and funding

LinkOut - more resources