. 2023 Nov 22;15(23):5510.
doi: 10.3390/cancers15235510.

PARP1 Characterization as a Potential Biomarker for BCR::ABL1 p190+ Acute Lymphoblastic Leukemia

Affiliations

PARP1 Characterization as a Potential Biomarker for BCR::ABL1 p190+ Acute Lymphoblastic Leukemia

Caio Bezerra Machado et al. Cancers (Basel). .

Abstract

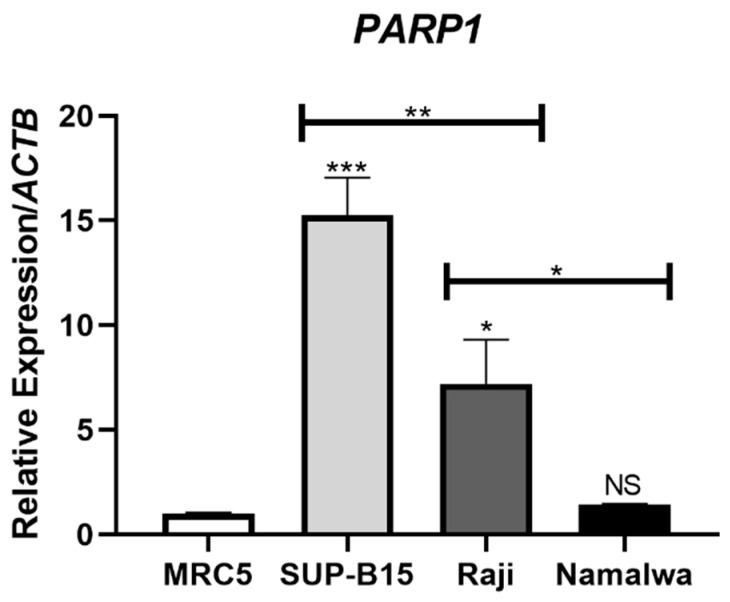
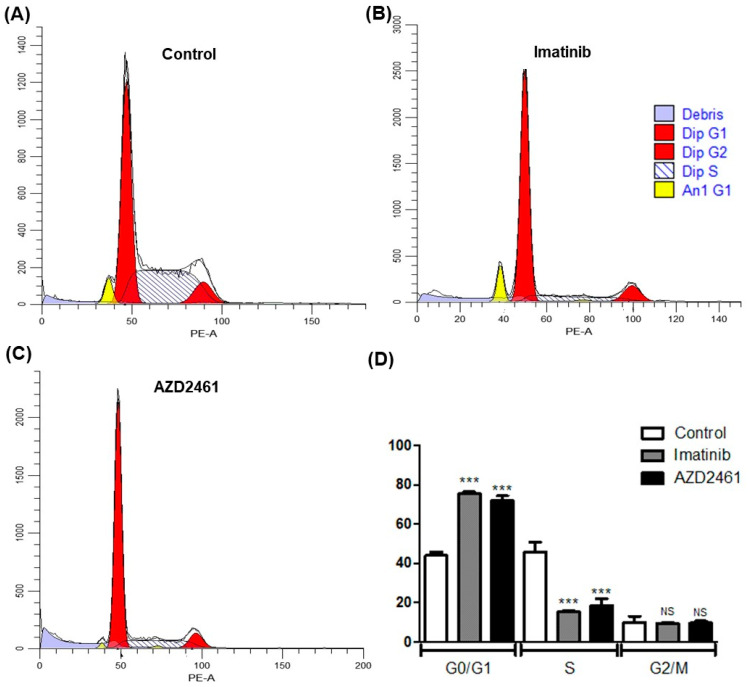
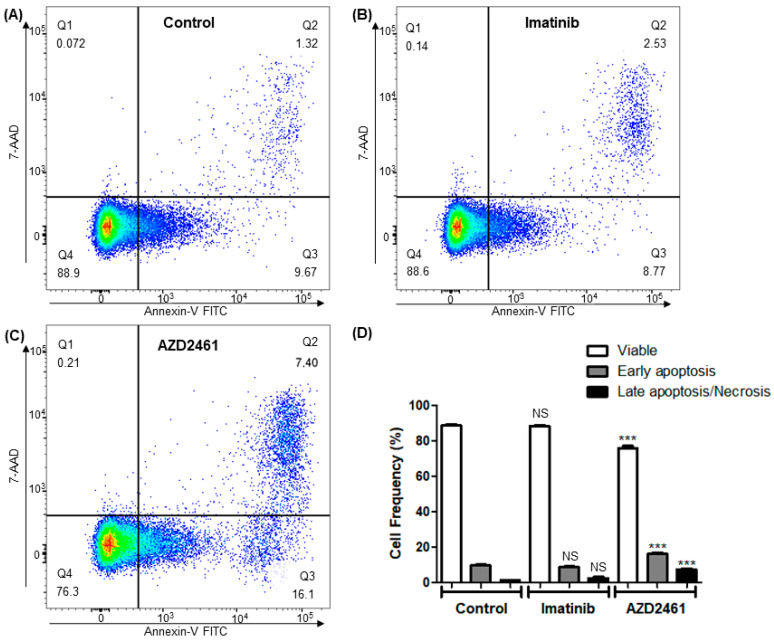
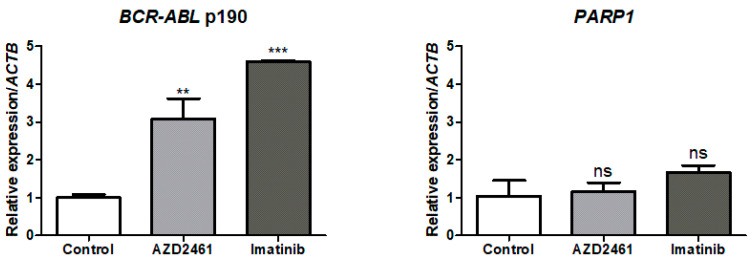
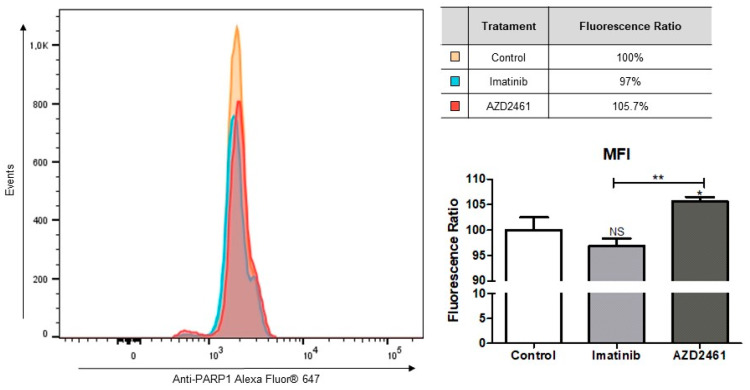
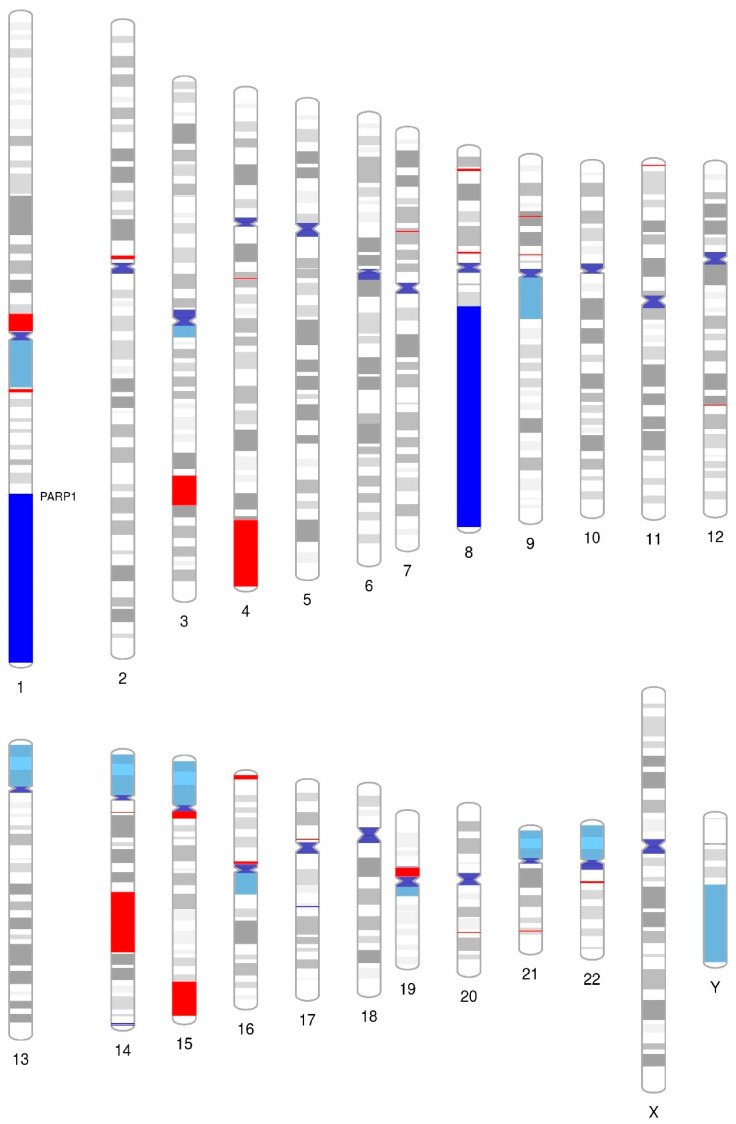
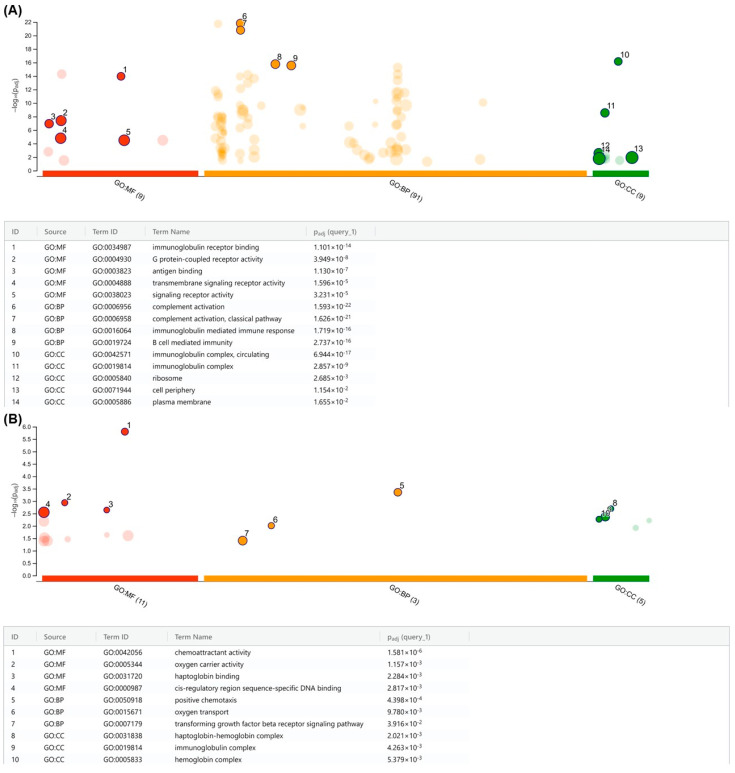
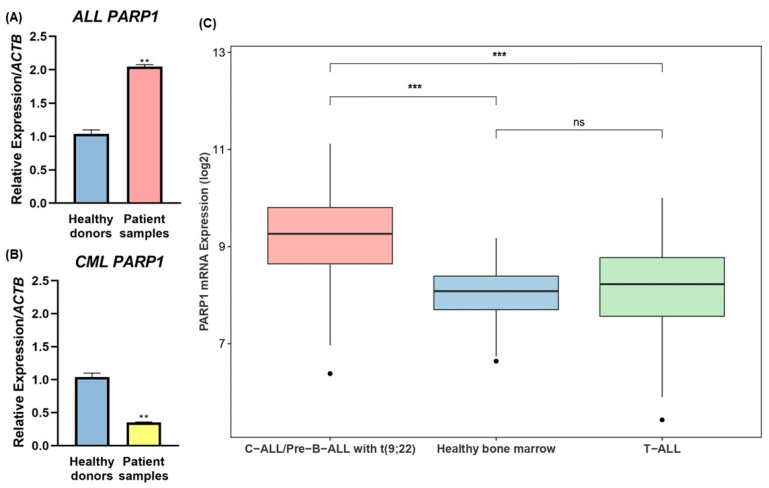
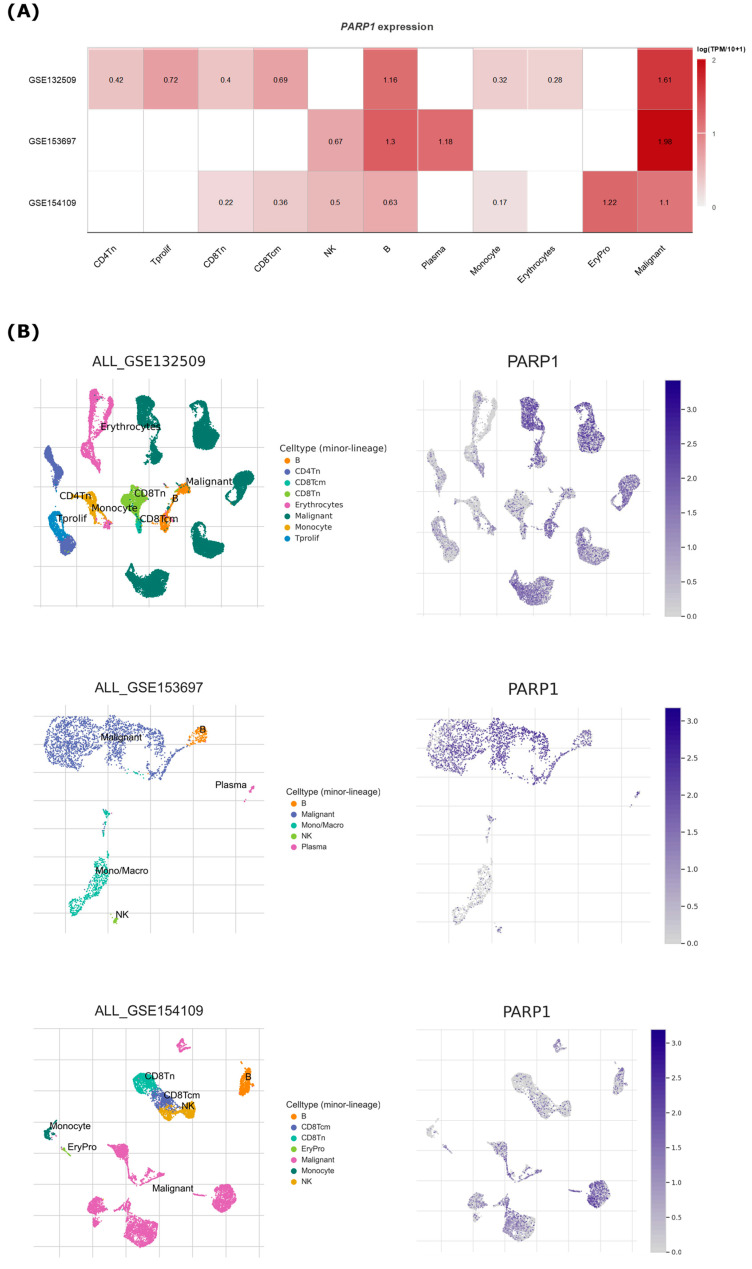
Detection of t(9;22), and consequent BCR::ABL1 fusion, is still a marker of worse prognosis for acute lymphoblastic leukemia (ALL), with resistance to tyrosine-kinase inhibitor therapy being a major obstacle in the clinical practice for this subset of patients. In this study, we investigated the effectiveness of targeting poly-ADP-ribose polymerase (PARP) in a model of BCR::ABL1 p190+ ALL, the most common isoform to afflict ALL patients, and demonstrated the use of experimental PARP inhibitor (PARPi), AZD2461, as a therapeutic option with cytotoxic capabilities similar to that of imatinib, the current gold standard in medical care. We characterized cytostatic profiles, induced cell death, and biomarker expression modulation utilizing cell models, also providing a comprehensive genome-wide analysis through an aCGH of the model used, and further validated PARP1 differential expression in samples of ALL p190+ patients from local healthcare institutions, as well as in larger cohorts of online and readily available datasets. Overall, we demonstrate the effectiveness of PARPi in the treatment of BCR::ABL1 p190+ ALL cell models and that PARP1 is differentially expressed in patient samples. We hope our findings help expand the characterization of molecular profiles in ALL settings and guide future investigations into novel biomarker detection and pharmacological choices in clinical practice.

Keywords: acute lymphoblastic leukemia; drug repositioning; molecular targeted therapy; poly(ADP-ribose) polymerase inhibitors.


Conflict of interest statement

The authors declare no conflict of interest.

Figures

Figure 1
Figure 1
Overexpression of PARP1 in the SUP-B15 cell line compared with other lymphoblastic cell models. PARP1 expression was normalized through the endogenous control ACTB and the non-neoplastic cell line MRC5 was used as the calibrator. Statistical differences were analyzed through ANOVA followed by Bonferroni’s multiple comparisons. NS: Not significant; * p < 0.05; ** p < 0.01, *** p < 0.0001.
Figure 2
Figure 2
Cell cycle arrest profile in the SUP-B15 cell line after treatment with either AZD2461 or imatinib. Cells were treated with sub-inhibitory concentrations of 1.5 µM of either AZD2461 or imatinib in a 24-h incubation period and the graphs represent the means from three distinct experiments. Cell cycle arrest profile was compared among the treated experiments and the non-treated control through ANOVA followed by Bonferroni’s multiple comparisons. Fluorescence emission was detected after sample processing with DNA intercalating agent, propidium iodide (PI), and is represented in the X-axis, while the Y-axis displays the number of events analyzed. (A) Control experiment treated with equivalent volume of DMSO. (B) Imatinib treated experiment. (C) AZD2461 treated experiment. (D) Percentage of cells in each phase of the cell cycle after the treatment and statistical comparison with the non-treated control. Dip: Pseudodiploid population; An1: Hypodiploid population; NS: Not significant; *** p < 0.0001.
Figure 3
Figure 3
Early apoptosis induction in the SUP-B15 cell line after treatment with AZD2461 or imatinib. Cells were treated with sub-inhibitory concentrations of 1.5 µM of either AZD2461 or imatinib in a 24-h incubation period and the graphs represent the means from three distinct experiments. Events are displayed as pseudocolor plots, with warmer tones representing increased number of events. Cell cycle arrest profile was compared among the treated experiments and the non-treated control through ANOVA followed by Bonferroni’s multiple comparisons. (A) Control experiment treated with equivalent volume of DMSO. (B) Imatinib treated experiment. (C) AZD2461 treated experiment. (D) Population frequencies and significance of variations. NS: Not significant; *** p < 0.0001.
Figure 4
Figure 4
Expression levels of the biomarker BCR::ABL1 p190 and the PARP1 transcript in the SUP-B15 cell line after treatment with AZD2461 or imatinib. Cells were treated with sub-inhibitory concentrations of 1.5 µM of either AZD2461 or imatinib in a 24-h incubation period and the graphs represent the means from three distinct experiments. BCR::ABL1 p190 and PARP1 expression were normalized through the endogenous control ACTB. Expression levels were measured in the SUP-B15 cell line comparing the non-treated control experiment and the experiments after the proposed treatments. Statistical differences were analyzed through ANOVA followed by Bonferroni’s multiple comparisons. ns: Not significant; ** p < 0.01, *** p < 0.0001.
Figure 5
Figure 5
Treatment with AZD2461 reveals cell populations with increased PARP1 protein. Cells were treated with sub-inhibitory concentrations of 1.5 µM of either AZD2461 or imatinib in a 24-h incubation period and the graphs represent the means from three distinct experiments. PARP1 levels were measured through the mean fluorescence intensity (MFI) of the fluorochrome Alexa Fluor® 647 and compared between the treated experiments and the non-treated control through ANOVA followed by Bonferroni’s multiple comparisons. MFI ratios are represented as percentages relative to 100% of fluorescence of the non-treated control. NS: Not significant; * p < 0.05; ** p < 0.01.
Figure 6
Figure 6
Chromosome’s ideogram showing CNAs identified in the SUP-B15 cell line. Dark blue indicates gains, red represents losses, and light blue represents condensed heterochromatin.
Figure 7
Figure 7
Functional gene ontology (GO) annotation of CNAs from the SUP-B15 cell line. Key significant terms enriched in gene (A) gains and (B) losses are annotated in the table below. The x-axis displays the functional terms and the y-axis shows −log10 of the FDR-adjusted p-value from the enrichment test. (GO: MF) molecular function, (GO: BP) biological process, (GO: CC) cellular component. GO size represents the number of total genes in each specific ontology.
Figure 8
Figure 8
PARP1 expression in BCR::ABL1 p190+ patient samples. (A) Pooled analysis of the average fold change of PARP1 expression in ALL p190+ patient samples. (B) Pooled analysis of the average fold change of PARP1 expression in CML p190+ patient samples. (C) PARP1 expression in cohorts of ALL patients from the GSE13159 dataset. Healthy blood donors were used as comparative controls. Statistical differences were analyzed through the Student’s T-test or the Wilcoxon test. ALL: Acute lymphoblastic leukemia; C-ALL: Childhood Acute Lymphoblastic Leukemia; CML: Chronic myeloid leukemia; ns: Not significant; ** p < 0.01; *** p < 0.0001.
Figure 9
Figure 9
Single-cell analysis of PARP1 expression in c-ALL datasets. (A) Heatmap of PARP1 expression among cell subtypes in each dataset. (B) Single-cell view of cell populations detected and overlapping PARP1 expression in each dataset.

Similar articles

Cited by

References

    1. Luca D.C. Update on Lymphoblastic Leukemia/Lymphoma. Clin. Lab. Med. 2021;41:405–416. doi: 10.1016/j.cll.2021.04.003. - DOI - PubMed
    1. El Fakih R., Jabbour E., Ravandi F., Hassanein M., Anjum F., Ahmed S., Kantarjian H. Current Paradigms in the Management of Philadelphia Chromosome Positive Acute Lymphoblastic Leukemia in Adults. Am. J. Hematol. 2018;93:286–295. doi: 10.1002/ajh.24926. - DOI - PubMed
    1. Hantschel O. Structure, Regulation, Signaling, and Targeting of Abl Kinases in Cancer. Genes Cancer. 2012;3:436. doi: 10.1177/1947601912458584. - DOI - PMC - PubMed
    1. Waller C. Recent Results in Cancer Research. Volume 212. Springer; Cham, Switzerland: 2018. Imatinib Mesylate; pp. 1–27. - DOI - PubMed
    1. Adnan-Awad S., Kim D., Hohtari H., Javarappa K.K., Brandstoetter T., Mayer I., Potdar S., Heckman C.A., Kytölä S., Porkka K., et al. Characterization of P190-Bcr-Abl Chronic Myeloid Leukemia Reveals Specific Signaling Pathways and Therapeutic Targets. Leukemia. 2021;35:1964. doi: 10.1038/s41375-020-01082-4. - DOI - PMC - PubMed