. 2023 Nov 23;15(23):5553.
doi: 10.3390/cancers15235553.

Influence of C60 Nanofilm on the Expression of Selected Markers of Mesenchymal-Epithelial Transition in Hepatocellular Carcinoma

Affiliations

Influence of C60 Nanofilm on the Expression of Selected Markers of Mesenchymal-Epithelial Transition in Hepatocellular Carcinoma

Malwina Sosnowska et al. Cancers (Basel). .

Abstract

The epithelial-mesenchymal transition (EMT) is a process in which epithelial cells acquire the ability to actively migrate via a change to the mesenchymal phenotype. This mechanism occurs in an environment rich in cytokines and reactive oxygen species but poor in nutrients. The aim of this study was to demonstrate that the use of a fullerene C60 nanofilm can inhibit liver cancer cell invasion by restoring their non-aggressive, epithelial phenotype. We employed epithelial and mesenchymal HepG2 and SNU-449 liver cancer cells and non-cancerous mesenchymal HFF2 cells in this work. We used enzyme-linked immunosorbent assays (ELISAs) to determine the content of glutathione and transforming growth factor (TGF) in cells. We measured the total antioxidant capacity with a commercially available kit. We assessed cell invasion based on changes in morphology, the scratch test and the Boyden chamber invasion. In addition, we measured the effect of C60 nanofilm on restoring the epithelial phenotype at the protein level with protein membranes, Western blotting and mass spectrometry. C60 nanofilm downregulated TGF and increased glutathione expression in SNU-449 cells. When grown on C60 nanofilm, invasive cells showed enhanced intercellular connectivity; reduced three-dimensional invasion; and reduced the expression of key invasion markers, namely MMP-1, MMP-9, TIMP-1, TIMP-2 and TIMP-4. Mass spectrometry showed that among the 96 altered proteins in HepG2 cells grown on C60 nanofilm, 41 proteins are involved in EMT and EMT-modulating processes such as autophagy, inflammation and oxidative stress. The C60 nanofilm inhibited autophagy, showed antioxidant and anti-inflammatory properties, increased glucose transport and regulated the β-catenin/keratin/Smad4/snail+slug and MMP signalling pathways. In conclusion, the C60 nanofilm induces a hybrid mesenchymal-epithelial phenotype and could be used in the prevention of postoperative recurrences.

Keywords: autophagy; fullerene; inflammation; invasion; liver cancer; oxidative stress; phenotype transition.


Conflict of interest statement

The authors declare no conflict of interest.

Figures

Figure 1
Figure 1
(A,B) Characterisation of fullerene nanoparticles and nanofilm using transmission electron microscopy ((A), scale bar: 100 nm; (B), scale bar: 200 nm), (C) a Zetasizer and (D,E) atomic force microscopy. Comparison of the surface roughness of (D) an uncoated polystyrene plate and (E) a fullerene-coated polystyrene plate.
Figure 2
Figure 2
Mitochondrial dehydrogenase activity of HepG2, SNU-449, and HFF2 cells after growth on uncoated and C60-coated plates at a concentration of 50, 100, and 1000 mg/L using the MTT assay. Data are presented in the form of box-whisker charts. The medians are shown as a middle, horizontal line, and the percentiles (2.5th, 25th, 50th, 75th, and 97.5th) as vertical lines. The whiskers indicate the minimum and maximum values. Statistical significance is indicated by asterisks: * p  <  0.05 and *** p  <  0.001.
Figure 3
Figure 3
(A) The level of transforming growth factor β1 (TGF-β1), (B) the total antioxidant capacity and (C) the level of glutathione in the cell lysates after incubating cells for 24 h on C60 nanofilm. Data are presented in the form of box-whisker charts. The medians are shown as a middle, horizontal line, and the percentiles (2.5th, 25th, 50th, 75th, and 97.5th) as vertical boxes/lines. The whiskers indicate the minimum and maximum values. Statistical significance is indicated by asterisks: * p  <  0.05 and ** p  <  0.01.
Figure 4
Figure 4
(A) Scheme of the two-dimensional invasion experiment. The central well contained a human umbilical vein endothelial cell, extracellular matrix proteins and C60 nanofilm. The micrographs show the morphology of (B) HepG2, (C) SNU-449 and (D) HFF2 cells with the (1) epithelial and (2) mesenchymal phenotypes cultured on an ordinary polystyrene plate (control) and a polystyrene plate coated with C60 nanofilm after incubation for 48 h (scale bar: 200 µm). In panels (BD), the lower micrographs show cell growth towards the cell-free gap (scale bar: 1 mm).
Figure 5
Figure 5
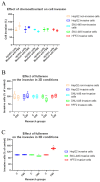
Cell invasion through a polycarbonate membrane (with 8 µm pores) coated with proteins of the Engelbreth–Holm–Swarm (EHS) mouse tumour basement membrane. (A) The effect of chemo-attractants on three-dimensional cell invasion after incubation for 24 h and staining with CyQuant GR Dye. Cell invasion is expressed relative to the two-cell-type co-culture assay. (B) The effect of C60 nanofilm on the invasive capacity of epithelial (non-invasive) and mesenchymal (invasive) cells after incubation for 24 h and staining with CyQuant GR Dye. (C) The effect of C60 nanofilm on invasion of mesenchymal cells after incubation for 72 h and lysis of cells stained with crystal violet. Data are presented in the form of box-whisker charts. The medians are shown as a middle, horizontal line, and the percentiles (2.5th, 25th, 50th, 75th, and 97.5th) as vertical boxes/lines. The whiskers indicate the minimum and maximum values. Statistical significance is indicated by asterisks: * p  <  0.05 and ** p  <  0.01.
Figure 6
Figure 6
(A) The metalloproteinase (MMP) and tissue inhibitor of metalloproteinase (TIMP) profile in lysates from cells grown on uncoated polystyrene plates and plates coated with C60 nanofilm. Unmodified protein membranes are shown in Figure S1. (B) The table shows the location of individual MMPs on the protein membrane. The positive control (pos) was biotin-conjugated IgG. Protein expression was evaluated using densitometry software for a semiquantitative comparison using ImageJ 1.54d software. The background was removed with Protein Array Analyzer for the ImageJ 1.54d software. The colour scale shows protein levels from lowest (black) to highest (white). (C) Western blot analysis of beta-catenin, vimentin, smooth muscle actin, glyceraldehyde 3-phosphate dehydrogenase (GAPDH), snail/slug, Smad4 and catalase. GAPDH and smooth muscle actin were used as a loading control.
Figure 7
Figure 7
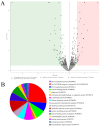
The effect of the growth of HepG2 cells on C60 nanofilm for 48 h on the change in expression of proteins based on mass spectrometry. (A) A volcano plot of 6295 identified proteins from HepG2 cells based on mass spectrometry. Significant changes in intracellular protein expression after culturing cells on C60 nanofilm compared with the control (fold change = 1.4, n = 3 per group, p ≤ 0.05) are indicated by green (downregulation) and pink (upregulation) colours. (B) The pie chart of protein classes that changed after growth on C60 nanofilm made with the Panther Classification System 18.0 software.
Figure 8
Figure 8
Principal component analysis of the general proteome of HepG2 cells. The score plot was prepared with all identified proteins. The blue circles indicate the control group (growth on uncoated plates), and the orange circles indicate the experimental group (growth on C60 nanofilm). Principal components 1 and 2 (PC1 and PC2) explain 49.0% and 24.4% of the sample variation, respectively.
Figure 9
Figure 9
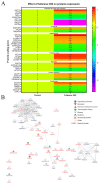
The effect of C60 nanofilm on the expression of 41 key proteins of HepG2 cells. (A) Heat map of the expression of 41 key proteins of HepG2 cells cultured for 48 h on an uncoated polystyrene plate (control) and on a C60 nanofilm-coated polystyrene plate. The proteins were identified, and their expression was quantified by mass spectrometry. Each column of the heat map represents the research group (control or fullerene C60), and each row represents the symbol of the gene that encodes the study protein. The results are presented as fold changes expressed as the log2 ratio (ratio: fullerene vs. control). (B) The protein–protein network in HepG2 cells. The key 41 proteins were selected from 96 proteins with altered expression after growth on C60 nanofilm. These 41 proteins are marked in red font and are divided into protein categories. In the network, neighbouring proteins are marked in black font. Abbreviations: KRT, keratin; SNIP1, smad nuclear-interacting protein 1; ADAMTS6, a disintegrin and metalloproteinase with thrombospondin motifs 6; WDR45B, WD repeat domain phosphoinositide-interacting protein 3; TTC5, tetratricopeptide repeat protein 5; TMEM59, transmembrane protein 59; NR2F6, nuclear receptor subfamily 2 group F member 6; MT2A, metallothionein-2; TNIP1, TNFAIP3-interacting protein 1; PLGRKT, plasminogen receptor KT; CCDC22, coiled-coil domain-containing protein 22; ANKRD28, serine/threonine-protein phosphatase 6 regulatory ankyrin repeat subunit A; APOBEC3A, DNA dC→dU-editing enzyme APOBEC-3A; ZDHHC20, palmitoyltransferase ZDHHC20; NT5E, 5’-nucleotidase; POLR3K, DNA-directed RNA polymerase III subunit RPC10; RPS6KB2, ribosomal protein S6 kinase beta-2; MT1X, metallothionein-1X; COQ8B, atypical kinase COQ8B; COX6A1, cytochrome c oxidase subunit 6A1; RHOF, rho-related GTP-binding protein RhoF; ARHGEF16, rho guanine nucleotide exchange factor 16; FAM83H, protein FAM83H; ACTG1, Actin, cytoplasmic 2; GKAP1, g kinase-anchoring protein 1; EXOC3, exocyst complex component 3; PPIP5K1, inositol hexakisphosphate and diphosphoinositol-pentakisphosphate kinase 1; DENND4C, DENN domain-containing protein 4C; NCOR2, nuclear receptor corepressor 2; DSCC1, sister chromatid cohesion protein DCC1; RAB6C, ras-related protein Rab-6C; CEP55, centrosomal protein of 55 kDa; SIX6OS1, protein SIX6OS1, ESPL1, separin.

Similar articles

References

    1. Shinde A., Hardy S.D., Kim D., Akhand S.S., Jolly M.K., Wang W.H., Anderson J.C., Khodadadi R.B., Brown W.S., George J.T., et al. Spleen tyrosine kinase–mediated autophagy is required for epithelial–mesenchymal plasticity and metastasis in breast cancer. Cancer Res. 2019;79:1831–1843. doi: 10.1158/0008-5472.CAN-18-2636. - DOI - PMC - PubMed
    1. Asleh M.A., Zaher M., Asleh J., Jadon J., Shaulov L., Yelin R., Schultheiss T.M. A morphogenetic wave in the chick embryo lateral mesoderm generates mesenchymal-epithelial transition through a 3D-rosette intermediate. Dev. Cell. 2023;58:951–966. doi: 10.1016/j.devcel.2023.03.017. - DOI - PubMed
    1. Chen W., Wu J., Shi W., Zhang G., Chen X., Ji A., Wang Z., Wu J., Jiang C. PRRX1 deficiency induces mesenchymal-epithelial transition through PITX2/miR-200–dependent SLUG/CTNNB1 regulation in hepatocellular carcinoma. Cancer Sci. 2021;112:2158–2172. doi: 10.1111/cas.14853. - DOI - PMC - PubMed
    1. Ribatti D., Tamma R., Annese T. Epithelial-mesenchymal transition in cancer: A historical overview. Transl. Oncol. 2020;13:100773. doi: 10.1016/j.tranon.2020.100773. - DOI - PMC - PubMed
    1. Cook D.P., Wrana J.L. A specialist-generalist framework for epithelial-mesenchymal plasticity in cancer. Trends Cancer. 2022;8:358–368. doi: 10.1016/j.trecan.2022.01.014. - DOI - PubMed