

Circulating sRANKL, Periostin, and Osteopontin as Biomarkers for the Assessment of Activated Osteoclastogenesis in Myeloma Related Bone Disease
- PMID: 38067265
- PMCID: PMC10705189
- DOI: 10.3390/cancers15235562
Circulating sRANKL, Periostin, and Osteopontin as Biomarkers for the Assessment of Activated Osteoclastogenesis in Myeloma Related Bone Disease
Abstract
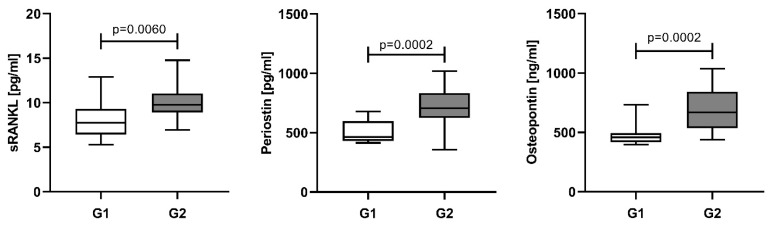
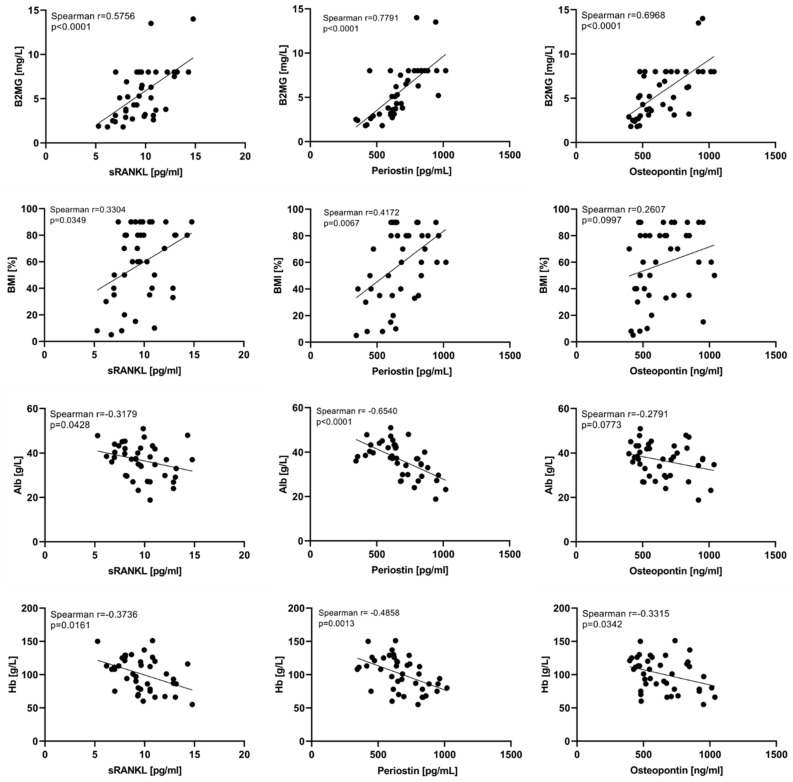
The hallmark of multiple myeloma is myeloma related bone disease. Interactions between myeloma plasma cells (MPCs), stromal cells, and the bone marrow (BM) microenvironment play a critical role in the pathogenesis of MBD. Bone remodeling is severely dysregulated with the prevalence of osteoclast activity. We aimed to assess circulating levels of sRANKL, periostin, and osteopontin as osteoclast activators in NDMM patients at diagnosis and in the course of treatment, correlations with clinical and laboratory data, and to evaluate their potential as additional biomarkers for the assessment of MBD. The current study involved 74 subjects (41 NDMM patients, 33 controls). MBD was assessed by whole-body low-dose computed tomography. sRANKL, periostin, and osteopontin were assayed by commercial ELISA kits. At diagnosis, all tested parameters were significantly higher in NDMM patients compared to the controls (p < 0.0001), correlating with disease stage, MBD grade, and BM infiltration by MPCs. During therapy, the serum levels of all tested proteins decrease, most prominently after autologous stem cell transplantation (p < 0.0001). A significant reduction was established in patients achieving complete and very-good partial response compared to all others (p < 0.05). In conclusion, sRANKL, periostin, and osteopontin reflect MBD severity and could be promising markers for MBD monitoring and the effect of myeloma treatment.
Keywords: biomarkers; myeloma bone disease; osteopontin; periostin; sRANKL.
Conflict of interest statement
The authors declare no conflict of interest. The funder had no role in the design of the study; in the collection, analyses, or interpretation of data; in the writing of the manuscript; or in the decision to publish the results.
Figures


Similar articles
-
Dynamics of Bone Disease Biomarkers Dickkopf-1 and Sclerostin in Patients with Multiple Myeloma.J Clin Med. 2023 Jul 1;12(13):4440. doi: 10.3390/jcm12134440. J Clin Med. 2023. PMID: 37445475 Free PMC article.
-
Correlation of osteoprotegerin and sRANKL concentrations in serum and bone marrow of multiple myeloma patients.Arch Immunol Ther Exp (Warsz). 2005 Sep-Oct;53(5):454-64. Arch Immunol Ther Exp (Warsz). 2005. PMID: 16314829
-
High levels of periostin correlate with increased fracture rate, diffuse MRI pattern, abnormal bone remodeling and advanced disease stage in patients with newly diagnosed symptomatic multiple myeloma.Blood Cancer J. 2016 Oct 7;6(10):e482. doi: 10.1038/bcj.2016.90. Blood Cancer J. 2016. PMID: 27716740 Free PMC article.
-
Pathogenesis and Treatment of Myeloma-Related Bone Disease.Int J Mol Sci. 2022 Mar 14;23(6):3112. doi: 10.3390/ijms23063112. Int J Mol Sci. 2022. PMID: 35328533 Free PMC article. Review.
-
Myeloma bone disease: Progress in pathogenesis.Prog Biophys Mol Biol. 2016 Nov;122(2):149-155. doi: 10.1016/j.pbiomolbio.2016.08.003. Epub 2016 Aug 3. Prog Biophys Mol Biol. 2016. PMID: 27496181 Review.
References
Grants and funding
LinkOut - more resources
Full Text Sources
Research Materials
