. 2023 Nov 25;15(23):5580.
doi: 10.3390/cancers15235580.

Epigenetically Downregulated Breast Cancer Gene 2 through Acetyltransferase Lysine Acetyltransferase 2B Increases the Sensitivity of Colorectal Cancer to Olaparib

Affiliations

Epigenetically Downregulated Breast Cancer Gene 2 through Acetyltransferase Lysine Acetyltransferase 2B Increases the Sensitivity of Colorectal Cancer to Olaparib

Siche Chen et al. Cancers (Basel). .

Abstract

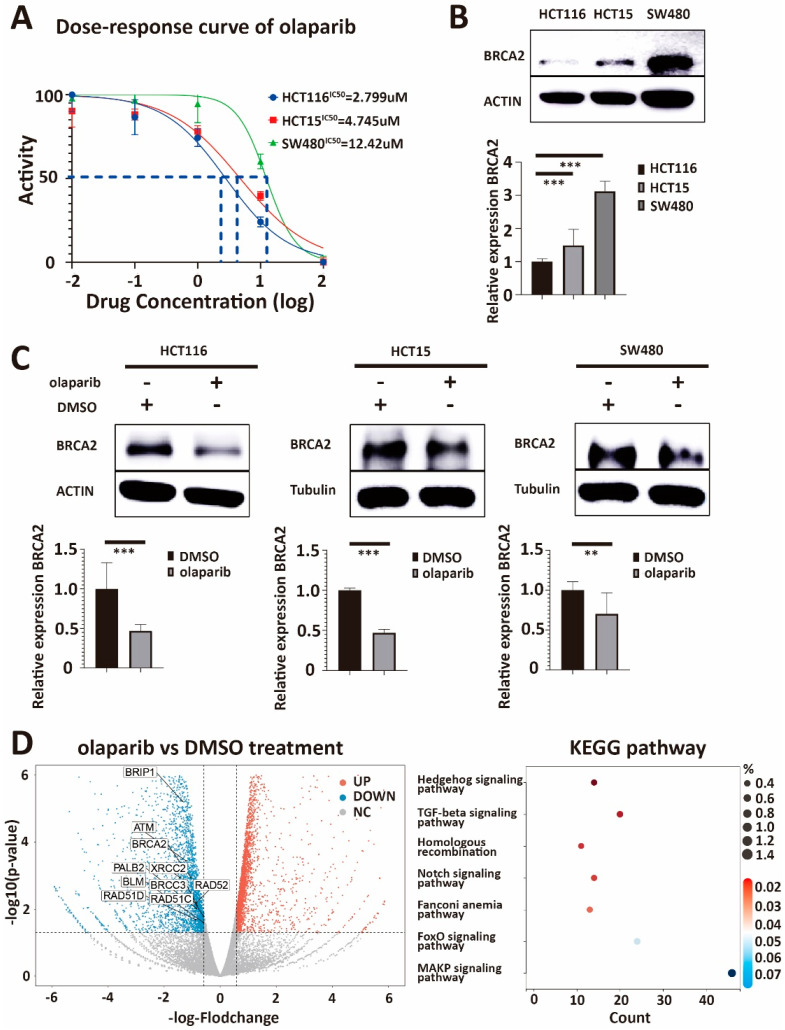
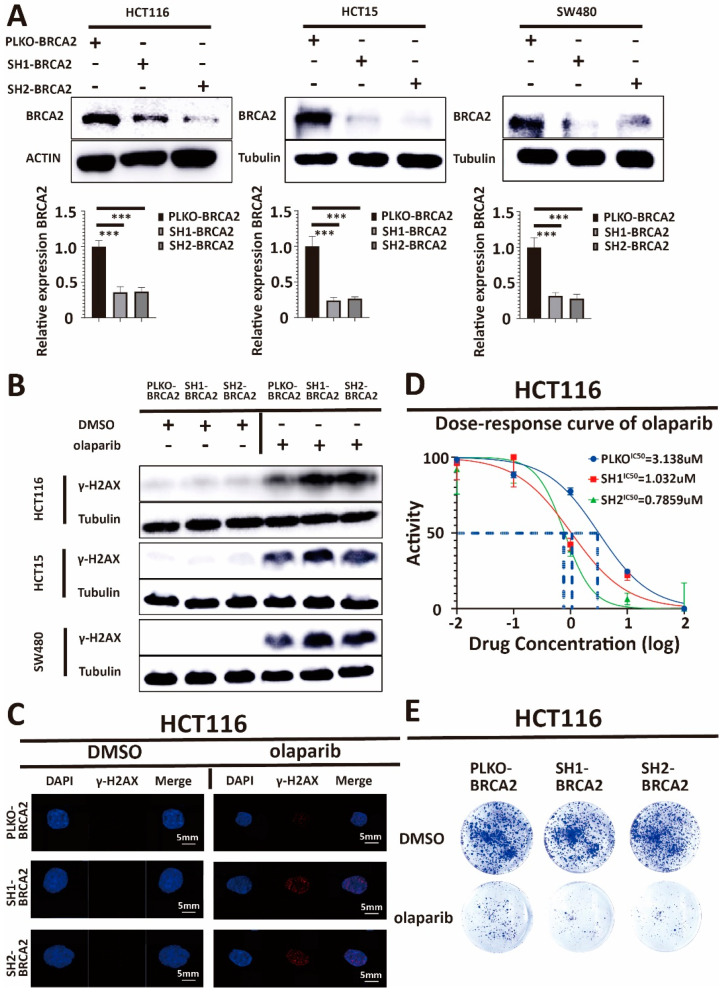
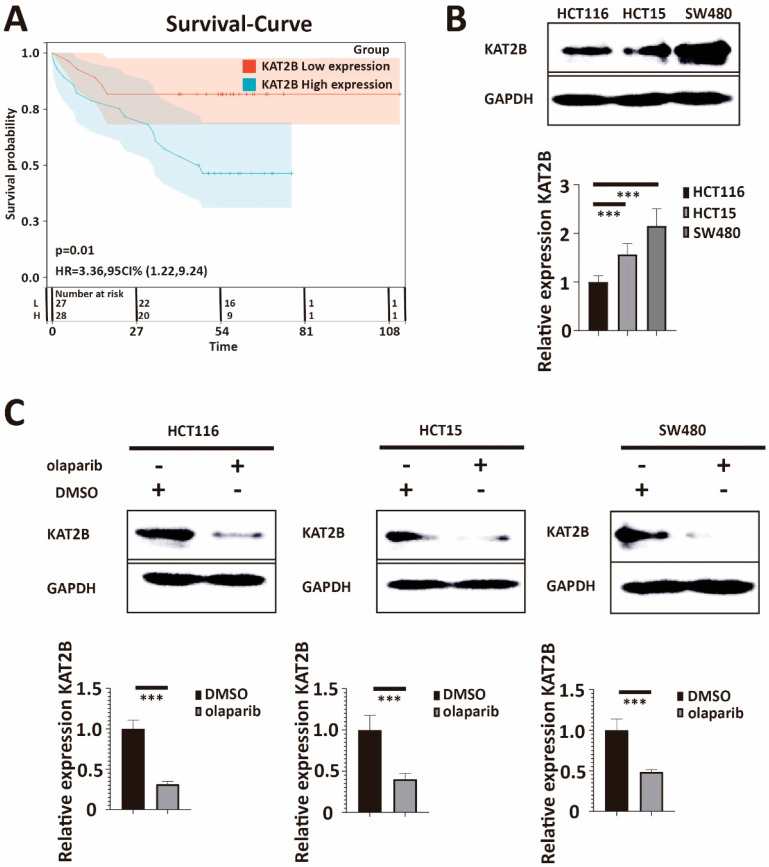
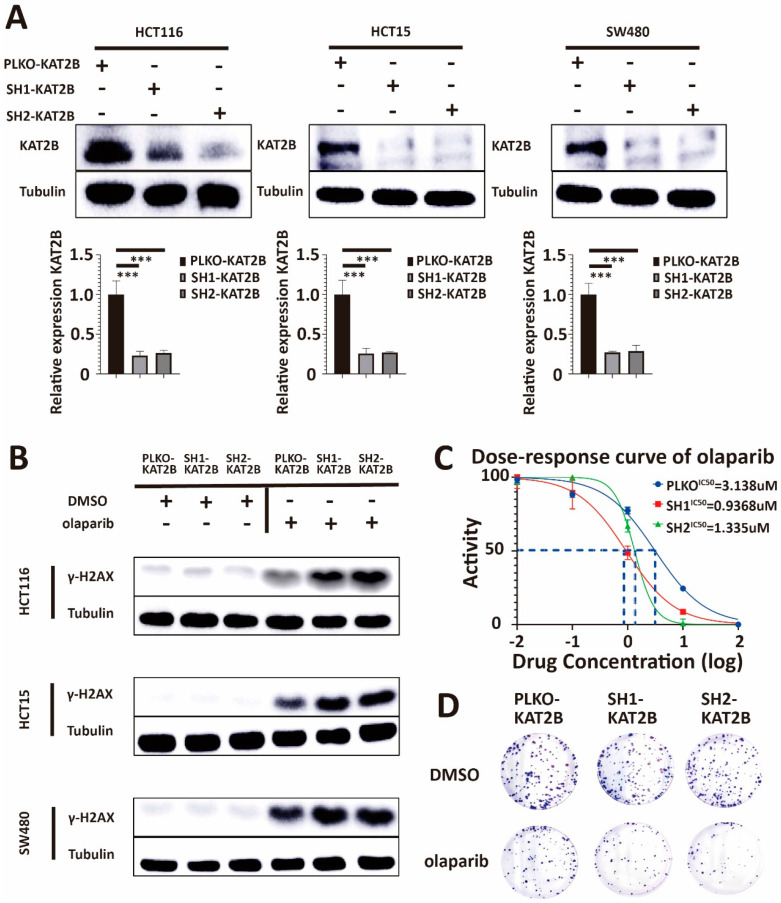
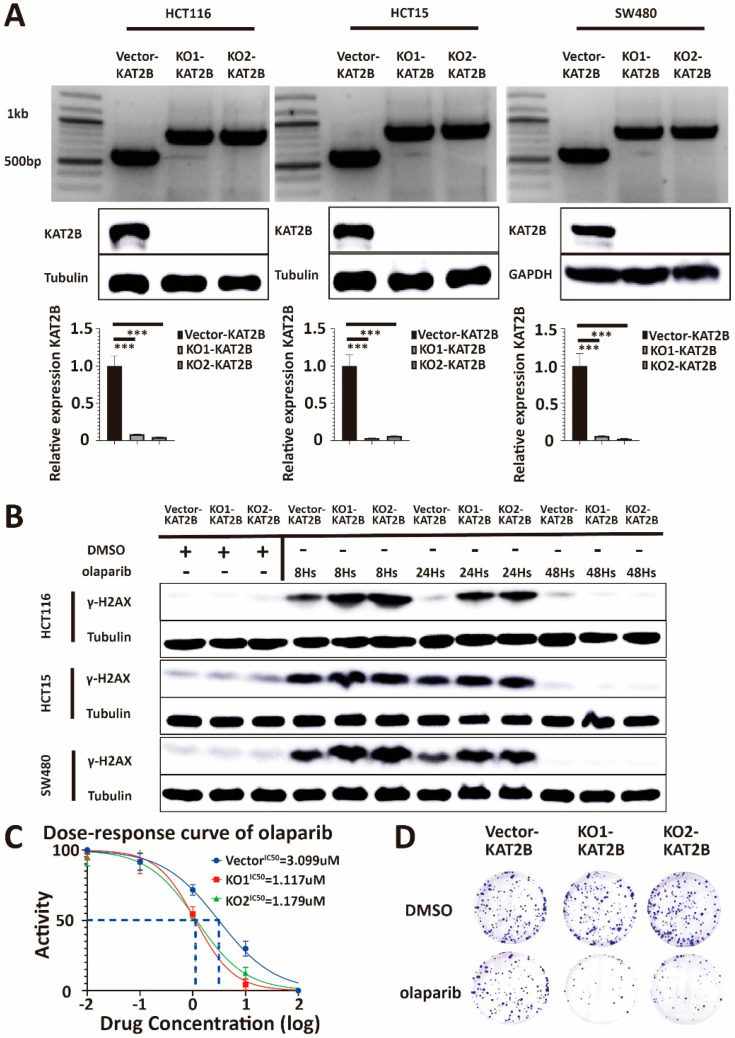
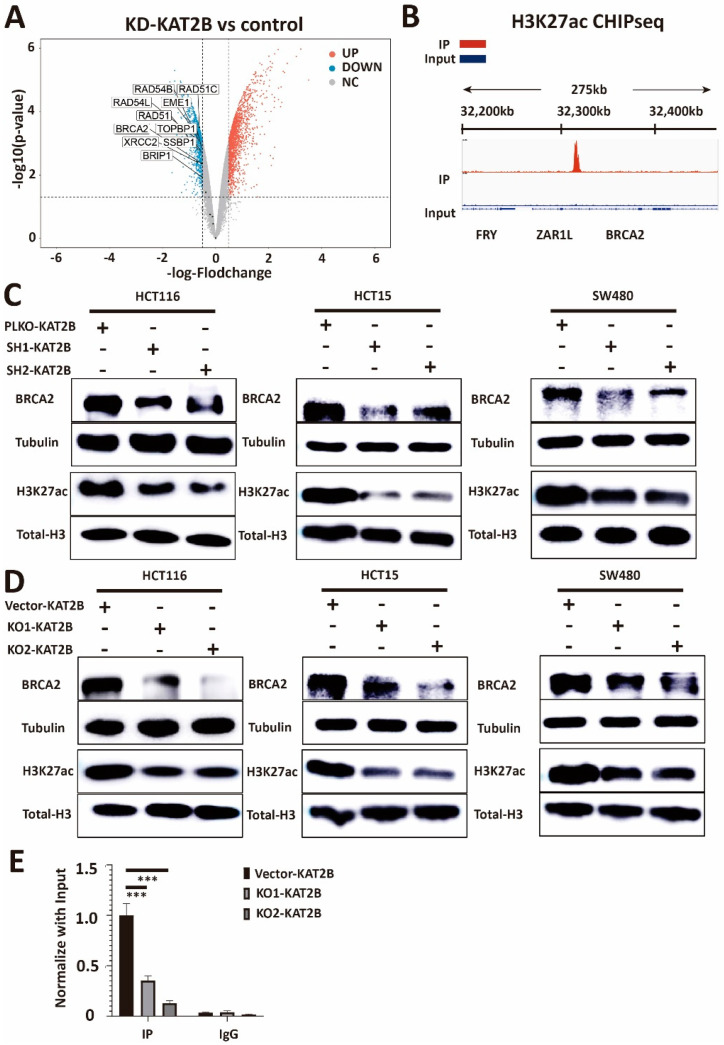
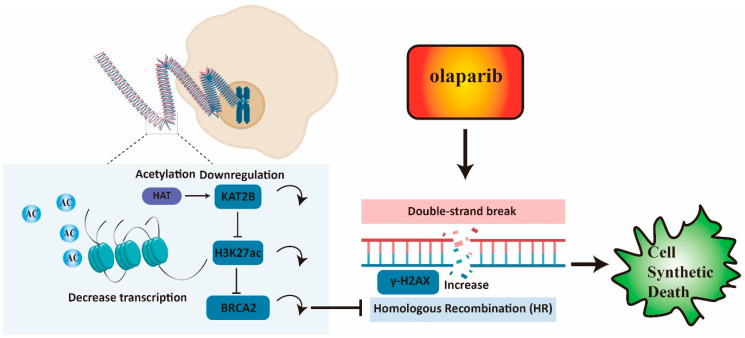
Olaparib suppresses DNA damage repair by inhibiting the poly ADP ribose polymerase (PARP), especially in cancers with BRCA1/2 mutations or the BRCA-ness phenotype. However, the first trials showed that some patients with defective DNA damage repair are still resistant to olaparib. The recovery of the wildtype BRCA is a prominent mechanism of PARP inhibitor (PARPi) resistance in BRCA-deficient tumors, but additional molecular features of olaparib resistance remain poorly understood. The objective of our study was to find molecular parameters that contribute to olaparib response or resistance in CRC. We report that histone acetyltransferase KAT2B decreases BRCA2 expression by reducing the acetylation of the 27th amino acid in histone H3 (H3K27) at the promoter of the BRCA2 gene in colorectal cancer (CRC). This increases the sensitivity of CRC cells toward olaparib treatment. The H3K27ac binding domain of BRCA2 may be required for its transcription. Low endogenous KAT2B expression, which we identify in a subset of cultured BRCA2-expressing CRC cells, leads to an accumulation of γH2AX (more DNA damage), resulting in low PARPi resistance in BRCA-expressing cells. Our results reveal KAT2B and histone acetylation as regulators of BRCA2 expression and PARPi responses in BRCA2-expressing CRC cells, providing further insights into molecular prerequisites for targeting BRCA-functional tumors.

Keywords: BRCA2; H3K27ac; KAT2B; colorectal cancer; olaparib sensitivity; γH2AX.


Conflict of interest statement

The authors declare no conflict of interest.

Figures

Figure 1
Figure 1
(A) IC50 values for olaparib in three colorectal cancer cell lines. The IC50 of HCT116, HCT15, and SW480 are 2.799 μM, 4.745 μM, and 12.42 μM, respectively. IC50 is the half-maximal inhibitory concentration. (B) Western blot and q-PCR analysis of lysates derived from HCT116, HCT15, and SW480 CRC cell lines. Western blot and q-PCR show that HCT116 has the lowest expression of BRCA2, the expression level of BRCA2 in HCT15 is intermediate, and SW480 has the relatively highest endogenous expression of BRCA2. (C) Western blot and q-PCR analysis of lysates derived from HCT116-DMSO, HCT116-olaparib, HCT15-DMSO, HCT15-olaparib, and SW480-DMSO, SW480-olaparib CRC cell lines. Both Western blot and q-PCR suggest that the expression of BRCA2 in HCT116, HCT15, and SW480 decreases significantly after olaparib treatment. (D) Volcano plot showing the log2 fold-change plotted against the log10 p-value for DMSO control and olaparib-treated cells. There is a positive correlation between the IC50 of olaparib and the expression of BRCA2 in the three cell lines. DMSO is the negative control, and β-ACTIN and β-tubulin serve as loading controls. β-actin serves as the housekeeping gene (HKG) control in q-PCR. Right graph: KEGG analysis for all the downregulated genes after olaparib treatment 24 Hs. Volcano plot and KEGG analysis also demonstrate that olaparib treatment can reduce the expression of HR-related genes, including BRCA2. Each experiment was repeated at least three times and with two technical replicates, with similar results. Data are presented as the mean ± SD and analyzed using the Student t-test. **, p < 0.01, ***, p < 0.001. The uncropped blots are shown in Figure S8.
Figure 2
Figure 2
(A) Western blot analysis of lysates derived from HCT116-PLKO-BRCA2, HCT116-Sh1-BRCA2, HCT116-Sh2-BRCA2, HCT15-PLKO-BRCA2, HCT15-Sh1-BRCA2, HCT15-Sh2-BRCA2, and SW480-PLKO-BRCA2, SW480-Sh1-BRCA2, SW480-Sh2-BRCA2 CRC cell lines. PLKO is the control. Q-PCR analysis of lysates derived from the same cell lines as in the Western blots above. Western blot and q-PCR show that the expression of BRCA2 in ShRNA-treated cells decreased significantly. β-actin serves as the HKG control in q-PCR. In conclusion, we have successfully obtained BRCA2 knockdown cell lines. (B) Western blot analysis of lysates derived from previous cell lines. Western blot and immunofluorescence demonstrate a γ-H2AX accumulation and more DNA damage in BRCA2-knockdown cells after olaparib treatment, compared with control. This indicates that BRCA2 knockdown decreases DNA damage repair after olaparib treatment. PLKO and DMSO are the controls. (C) γ-H2AX and DAPI immunofluorescence images in these cell lines. Scale bars, 5 mm. (D) Cell viability assay showing that the IC50 of olaparib decreased in HCT116, HCT15, and SW480 after BRCA2 knockdown. (E) Clonogenic survival assay demonstrating that clonogenicity is less in HCT116, HCT15, and SW480 cells with BRCA2 knockdown after treatment with the same concentration of olaparib. Taken together, data indicate that BRCA2 knockdown increases the sensitivity of cells toward olaparib treatment. Each experiment was repeated at least three times and with two technical replicates, with similar results. Data are presented as the mean ± SD and are analyzed using the Student t-test. ***, p < 0.001. The uncropped blots are shown in Figure S9.
Figure 3
Figure 3
(A) Kaplan–Meier curve and Hazard–Ratio from the GSE17537 data set. Kaplan–Meier estimates of survival and Univariate Cox proportional hazards analysis show that higher KAT2B expression is associated with a lower probability of survival. The hazard ratio of KAT2B is higher than 1. Taken together, the data indicate that a high expression of KAT2B is not only a risk factor but also that a high endogenous expression of KAT2B may reduce the survival time of colorectal cancer patients. (B) Western blot and q-PCR analysis of lysates derived from HCT116, HCT15, and SW480 cell lines. Western blot and q-PCR illustrate that the expression of KAT2B was lowest in HCT116, followed by HCT15, and highest in SW480. This parallels the IC50 for olaparib among the three cell lines. (C) Western blot and q-PCR analysis of lysates derived from HCT116-DMSO, HCT116-olaparib, HCT15-DMSO, HCT15-olaparib, SW480-DMSO, and SW480-olaparib cell lines. Western blot and q-PCR demonstrate that KAT2B expression is significantly decreased in all cells after olaparib treatment. These results imply a negative association between KAT2B expression and olaparib treatment. DMSO is the negative control. GAPDH serves as a loading control. β-actin serves as the HKG in q-PCR. Each experiment was repeated at least three times and with two technical replicates, with similar results. Data are presented as the mean ± SD and analyzed using the Student t-test. ***, p < 0.001. The uncropped blots are shown in Figure S10.
Figure 4
Figure 4
(A) Western blot analysis of lysates derived from HCT116-PLKO-KAT2B, HCT116-Sh1-KAT2B, HCT116-Sh2-KAT2B, HCT15-PLKO-KAT2B, HCT15-Sh1-KAT2B, HCT15-Sh2-KAT2B, and SW480-PLKO-KAT2B, SW480-Sh1-KAT2B, and SW480-Sh2-KAT2B CRC cell lines. The upper band in the KAT2B Western blot corresponds to the published main band closely below 100 kDa, the lower band most likely representing non-specific binding [37]. PLKO is the negative control. β-tubulin serves as a loading control. Q-PCR analysis of lysates derived from the same cell lines as given for the Western blot experiments above. Western blot and q-PCR show that, after shRNA treatment, the expression of KAT2B is decreased in HCT116, HCT15, and SW480 cells. These results indicate that we have successfully constructed KAT2B knockdown stable strains. β-actin serves as the HKG in q-PCR. (B) Western blot analysis of lysates derived from the previous cell lines. Western blot experiments showed γ-H2AX accumulation and more DNA damage in KAT2B-knockdown cells after olaparib treatment, compared with control. This indicates that KAT2B knockdown decreases DNA damage repair. (C) Cell viability assay showing that the IC50 of olaparib decreases in HCT116, HCT15, and SW480 cells after KAT2B knockdown. (D) Clonogenic survival assay demonstrating that clonogenicity was less in HCT116, HCT15, and SW480 cells with KAT2B knockdown after treatment with the same concentration of olaparib. This indicates that KAT2B knockdown increases the sensitivity of cells toward olaparib treatment. Each experiment was repeated at least three times and with two technical replicates, with similar results. Data are presented as the mean ± SD and analyzed using a Student t-test. ***, p < 0.001. The uncropped blots are shown in Figure S11.
Figure 5
Figure 5
(A) Genotyping, Western blot, and q-PCR analysis of lysates derived from HCT116-Vector-KAT2B, HCT116-KO1-KAT2B, HCT116-KO2-KAT2B, HCT15-Vector-KAT2B, HCT15--KO1-KAT2B, HCT15-KO2-KAT2B, and SW480-Vector-KAT2B, SW480-KO1-KAT2B, SW480-KO2-KAT2B cell lines. The results of genotyping show that the bands of the knockout have completely replaced the bands of the wild type. Western blot and q-PCR results show that KAT2B did not express at the protein and mRNA levels. β-actin serves as the HKG control in q-PCR. Therefore, we successfully obtained KAT2B knockout cell lines. (B) Western blot analysis of lysates derived from the previous cell lines with DMSO and olaparib treatment at different time points. Western blotting shows that the accumulation of γ-H2AX is significantly higher in HCT116, HCT15, and SW480 cells with KAT2B knockout than in controls at 8 and 24 h after olaparib treatment, respectively. Collectively, this indicates that the efficiency of DNA damage repair decreased significantly after KAT2B knockout. (C) Cell viability assay illustrating that the IC50 of olaparib decreased in HCT116, HCT15, and SW480 cells with KAT2B knockout. (D) Clonogenic survival assay demonstrating that clonogenicity was more inhibited in HCT116, HCT15, and SW480 cells with KAT2B knockout at the same concentration of olaparib. In conclusion, KAT2B knockout increases the efficiency of olaparib treatment in inhibiting cell proliferation. Vector and DMSO are the controls. β-tubulin and GAPDH serve as a loading control. Each experiment was repeated at least three times and with two technical replicates, with similar results. Data are presented as the mean ± SD and analyzed using the Student t-test. ***, p < 0.001. The uncropped blots are shown in Figure S12.
Figure 6
Figure 6
(A) Volcano plot showing log2 fold-changes plotted against the log10 p-value for control and KAT2B knockdown cells (data from GSE93694). Compared with the control, the volcano plot shows the downregulation of genes related to DNA damage repair in the KAT2B knockdown group. The analysis suggests that KAT2B knockdown reduces many DNA damage repair-related genes, including BRCA2. (B) Integrative Genomics Viewer (IGV) for IP and Input in the HCT116 line. IGV shows that the enrichment peak of H3K27ac in the IP group is significantly bound to the promoter of BRCA2 as compared with the Input group, which indicates that H3K27ac may bind to the promoter of BRCA2 to affect the transcription of BRCA2. (C,D) Western blot analysis of lysates derived from previous cell lines. Western blotting shows that both KAT2B knockdown and knockout decrease the acetylation of the lysine residue at the N-terminal position 27 of the histone H3 protein (H3K27ac) in HCT116, HCT15, and SW480 CRC cell lines. Moreover, both KAT2B knockdown and knockout also decrease BRCA2 expression in these three cell lines. This suggests that KAT2B regulates H3K27 acetylation and BRCA2 expression. (E) ChIP-qPCR analysis of lysates derived from HCT116-Vector-KAT2B, HCT116-KO1-KAT2B, and HCT116-KO2-KAT2B. ChIP-qPCR shows that KAT2B knockout significantly reduces the binding of H3K27ac within the promoter of BRCA2. Combined with our previous results, we found that both KAT2B knockdown and knockout decrease the expression of BRCA2 by reducing H3K27 acetylation. Vector is the negative control. β-tubulin and Total-Histone3 serve as a loading control. Each experiment was repeated at least three times and with two technical replicates, with similar results. Data are presented as the mean ± SD and analyzed using the Student t-test. ***, p < 0.001. The uncropped blots are shown in Figure S13.
Figure 7
Figure 7
Low expression of BRCA2 reduces homologous recombination repair and increases the accumulation of γ-H2AX. KAT2B knockdown and KAT2B knockout decrease BRCA2 expression by reducing H3K27 acetylation and a reduction of BRCA2 transcription. A low expression of KAT2B combined with olaparib could be synergistic to inhibit proliferation or even survival in cells by reducing BRCA2 expression.

Similar articles

Cited by

References

    1. Van Cutsem E., Cervantes A., Adam R., Sobrero A., Van Krieken J.H., Aderka D., Aranda Aguilar E., Bardelli A., Benson A., Bodoky G., et al. ESMO consensus guidelines for the management of patients with metastatic colorectal cancer. Ann. Oncol. Off. J. Eur. Soc. Med. Oncol. 2016;27:1386–1422. doi: 10.1093/annonc/mdw235. - DOI - PubMed
    1. Arena S., Corti G., Durinikova E., Montone M., Reilly N.M., Russo M., Lorenzato A., Arcella P., Lazzari L., Rospo G., et al. A Subset of Colorectal Cancers with Cross-Sensitivity to Olaparib and Oxaliplatin. Clin. Cancer Res. 2020;26:1372–1384. doi: 10.1158/1078-0432.CCR-19-2409. - DOI - PubMed
    1. Phelan C.M., Iqbal J., Lynch H.T., Lubinski J., Gronwald J., Moller P., Ghadirian P., Foulkes W.D., Armel S., Eisen A., et al. Incidence of colorectal cancer in BRCA1 and BRCA2 mutation carriers: Results from a follow-up study. Br. J. Cancer. 2014;110:530–534. doi: 10.1038/bjc.2013.741. - DOI - PMC - PubMed
    1. Soyano A.E., Baldeo C., Kasi P.M. BRCA Mutation and Its Association with Colorectal Cancer. Clin. Color. Cancer. 2018;17:e647–e650. doi: 10.1016/j.clcc.2018.06.006. - DOI - PubMed
    1. Ishaque N., Abba M.L., Hauser C., Patil N., Paramasivam N., Huebschmann D., Leupold J.H., Balasubramanian G.P., Kleinheinz K., Toprak U.H., et al. Whole genome sequencing puts forward hypotheses on metastasis evolution and therapy in colorectal cancer. Nat. Commun. 2018;9:4782. doi: 10.1038/s41467-018-07041-z. - DOI - PMC - PubMed