

Identifying Predictive Biomarkers for Head and Neck Squamous Cell Carcinoma Response
- PMID: 38067301
- PMCID: PMC10705351
- DOI: 10.3390/cancers15235597
Identifying Predictive Biomarkers for Head and Neck Squamous Cell Carcinoma Response
Erratum in
-
Correction: Becker et al. Identifying Predictive Biomarkers for Head and Neck Squamous Cell Carcinoma Response. Cancers 2023, 15, 5597.Cancers (Basel). 2024 Oct 21;16(20):3554. doi: 10.3390/cancers16203554. Cancers (Basel). 2024. PMID: 39456651 Free PMC article.
Abstract
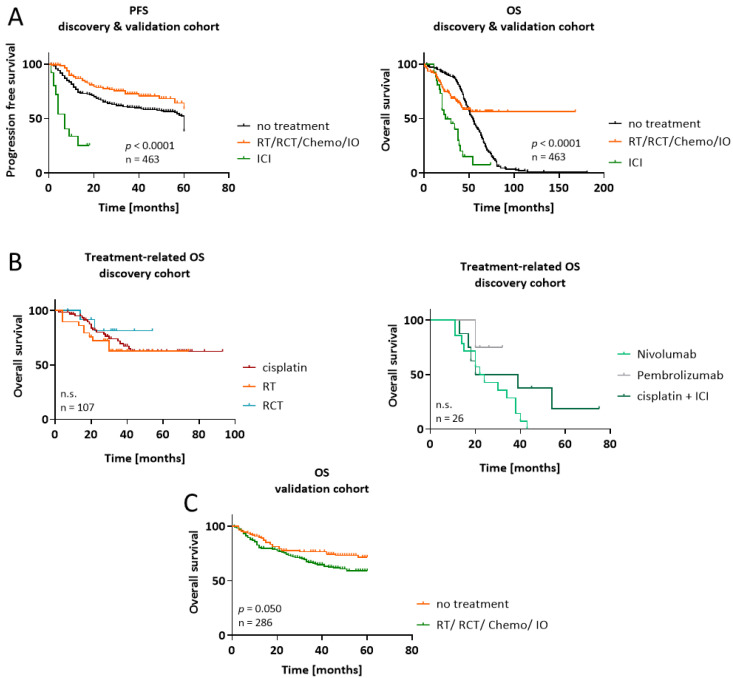
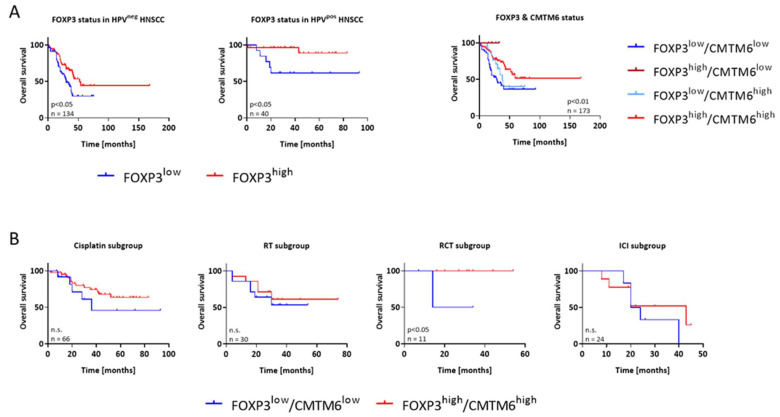
The 5-year survival rate for head and neck squamous cell carcinoma (HNSCC) is approximately 65%. In addition to radio-chemotherapy, immunotherapy is an approach in the treatment of advanced HNSCC. A better understanding of the immune context would allow personalized treatment by identifying patients who are best suited for different treatment options. In our discovery cohort, we evaluated the expression profiles of CMTM6, PD-L1, CTLA-4, and FOXP3 in 177 HNSCCs from Caucasian patients of all tumor stages and different treatment regimens, correlating marker expression in tumor and immune cells with outcomes. Patients with CMTM6high-expressing tumors had a longer overall survival regardless of treatment. This prognostic benefit of CMTM6 in HNSCC was validated in an independent cohort. Focusing on the in the discovery cohort (n = 177), a good predictive effect of CMTM6high expression was seen in patients receiving radiotherapy (p = 0.07; log rank), but not in others. CMTM6 correlated with PD-L1, CTLA-4 and FOXP3 positivity, with patients possessing CMTM6high/FOXP3high tumors showing the longest survival regardless of treatment. In chemotherapy-treated patients, PD-L1 positivity was associated with longer progression-free survival (p < 0.05). In the 27 patients who received immunotherapy, gene expression analysis revealed lower levels of CTLA-4 and FOXP3 with either partial or complete response to this treatment, while no effect was observed for CMTM6 or PD-L1. The combination of these immunomodulatory markers seems to be an interesting prognostic and predictive signature for HNSCC patients with the ability to optimize individualized treatments.
Keywords: CMTM6; HNSCC; PD-L1; cisplatin; immune-checkpoint inhibitor; radiotherapy; tumor microenvironment.
Conflict of interest statement
The authors declare no conflict of interest. The funders had no role in the design of the study; in the collection, analyses, or interpretation of data; in the writing of the manuscript; or in the decision to publish the results.
Figures


Similar articles
-
CMTM6 status predicts survival in head and neck squamous cell carcinoma and correlates with PD-L1 expression.Discov Oncol. 2024 Dec 4;15(1):745. doi: 10.1007/s12672-024-01554-4. Discov Oncol. 2024. PMID: 39630300 Free PMC article.
-
CMTM6 and PD-L1 coexpression is associated with an active immune microenvironment and a favorable prognosis in colorectal cancer.J Immunother Cancer. 2021 Feb;9(2):e001638. doi: 10.1136/jitc-2020-001638. J Immunother Cancer. 2021. PMID: 33579737 Free PMC article.
-
Quantitative Assessment of CMTM6 in the Tumor Microenvironment and Association with Response to PD-1 Pathway Blockade in Advanced-Stage Non-Small Cell Lung Cancer.J Thorac Oncol. 2019 Dec;14(12):2084-2096. doi: 10.1016/j.jtho.2019.09.014. Epub 2019 Oct 9. J Thorac Oncol. 2019. PMID: 31605795 Free PMC article.
-
The effects of checkpoint inhibition on head and neck squamous cell carcinoma: A systematic review.Oral Oncol. 2019 Mar;90:67-73. doi: 10.1016/j.oraloncology.2019.01.018. Epub 2019 Feb 5. Oral Oncol. 2019. PMID: 30846179
-
Head and neck squamous cell carcinoma: Genomics and emerging biomarkers for immunomodulatory cancer treatments.Semin Cancer Biol. 2018 Oct;52(Pt 2):228-240. doi: 10.1016/j.semcancer.2018.01.008. Epub 2018 Jan 31. Semin Cancer Biol. 2018. PMID: 29355614 Review.
Cited by
-
Immunosuppression and Outcomes in Patients with Cutaneous Squamous Cell Carcinoma of the Head and Neck.Clin Pract. 2025 Jan 17;15(1):21. doi: 10.3390/clinpract15010021. Clin Pract. 2025. PMID: 39851804 Free PMC article.
-
INTERLINK-1: A Phase III, Randomized, Placebo-Controlled Study of Monalizumab plus Cetuximab in Recurrent/Metastatic Head and Neck Squamous Cell Carcinoma.Clin Cancer Res. 2025 Jul 1;31(13):2617-2627. doi: 10.1158/1078-0432.CCR-25-0073. Clin Cancer Res. 2025. PMID: 40300079 Free PMC article. Clinical Trial.
-
Biomarker Profiles and Clinicopathological Features in Head and Neck Squamous Cell Carcinoma Patients.Medicina (Kaunas). 2024 Oct 14;60(10):1681. doi: 10.3390/medicina60101681. Medicina (Kaunas). 2024. PMID: 39459468 Free PMC article.
-
Correction: Becker et al. Identifying Predictive Biomarkers for Head and Neck Squamous Cell Carcinoma Response. Cancers 2023, 15, 5597.Cancers (Basel). 2024 Oct 21;16(20):3554. doi: 10.3390/cancers16203554. Cancers (Basel). 2024. PMID: 39456651 Free PMC article.
-
Differential Expression of CKLF-like MARVEL Transmembrane Domain-Containing Protein 6 and Programmed Cell Death Ligand 1 as Prognostic Biomarkers in Upper Tract Urothelial Carcinoma.Int J Mol Sci. 2024 Mar 20;25(6):3492. doi: 10.3390/ijms25063492. Int J Mol Sci. 2024. PMID: 38542462 Free PMC article.
References
-
- Facompre N.D., Rajagopalan P., Sahu V., Pearson A.T., Montone K.T., James C.D., Gleber-Netto F.O., Weinstein G.S., Jalaly J., Lin A., et al. Identifying Predictors of HPV-related Head and Neck Squamous Cell Carcinoma Progression and Survival through Patient-derived Models. Int. J. Cancer. 2020;147:3236–3249. doi: 10.1002/ijc.33125. - DOI - PMC - PubMed
Grants and funding
LinkOut - more resources
Full Text Sources
Research Materials
