. 2023 Nov 28;15(23):5612.
doi: 10.3390/cancers15235612.

Targeting Metabolic Vulnerabilities to Overcome Prostate Cancer Resistance: Dual Therapy with Apalutamide and Complex I Inhibition

Affiliations

Targeting Metabolic Vulnerabilities to Overcome Prostate Cancer Resistance: Dual Therapy with Apalutamide and Complex I Inhibition

Valentin Baumgartner et al. Cancers (Basel). .

Abstract

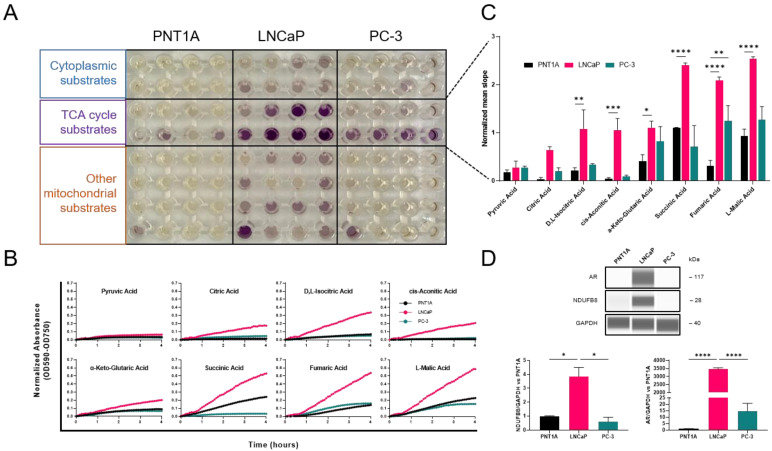
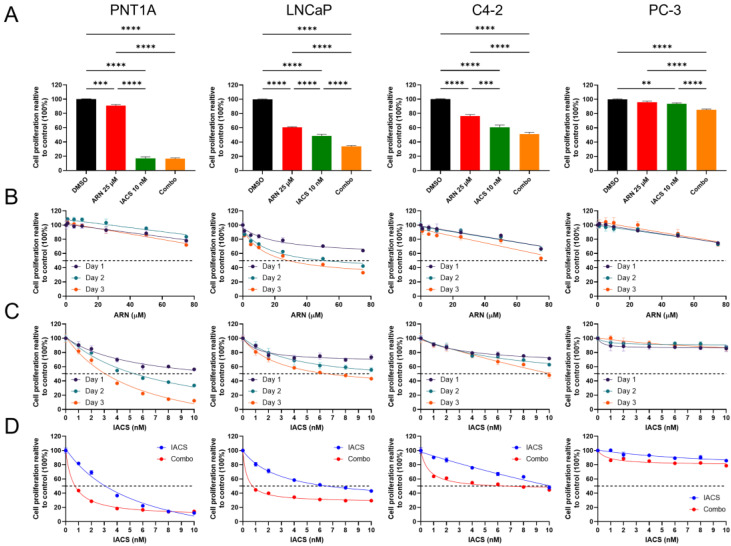
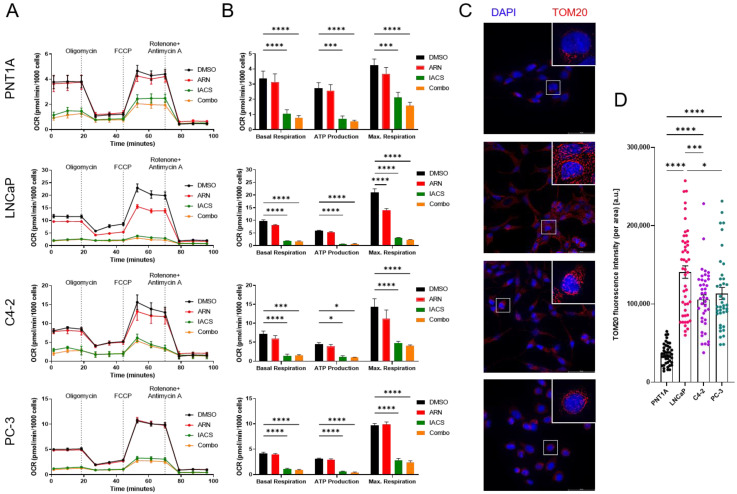
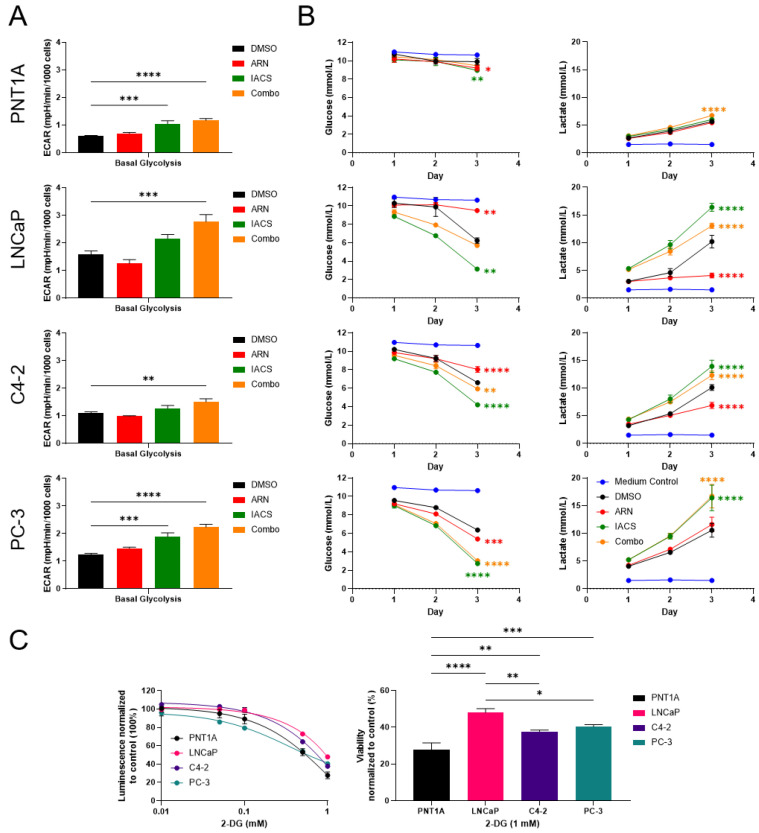
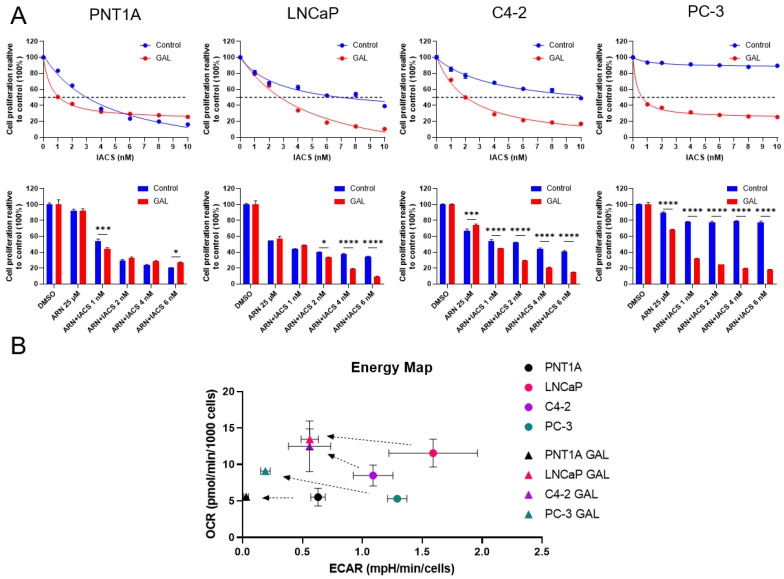
Prostate cancer (PCa) often becomes drug-treatment-resistant, posing a significant challenge to effective management. Although initial treatment with androgen deprivation therapy can control advanced PCa, subsequent resistance mechanisms allow tumor cells to continue growing, necessitating alternative approaches. This study delves into the specific metabolic dependencies of different PCa subtypes and explores the potential synergistic effects of combining androgen receptor (AR) inhibition (ARN with mitochondrial complex I inhibition (IACS)). We examined the metabolic behaviors of normal prostate epithelial cells (PNT1A), androgen-sensitive cells (LNCaP and C4-2), and androgen-independent cells (PC-3) when treated with ARN, IACS, or a combination. The results uncovered distinct mitochondrial activities across PCa subtypes, with androgen-dependent cells exhibiting heightened oxidative phosphorylation (OXPHOS). The combination of ARN and IACS significantly curbed cell proliferation in multiple PCa cell lines. Cellular bioenergetics analysis revealed that IACS reduced OXPHOS, while ARN hindered glycolysis in certain PCa cells. Additionally, galactose supplementation disrupted compensatory glycolytic mechanisms induced by metabolic reprogramming. Notably, glucose-deprived conditions heightened the sensitivity of PCa cells to mitochondrial inhibition, especially in the resistant PC-3 cells. Overall, this study illuminates the intricate interplay between AR signaling, metabolic adaptations, and treatment resistance in PCa. The findings offer valuable insights into subtype-specific metabolic profiles and propose a promising strategy to target PCa cells by exploiting their metabolic vulnerabilities.

Keywords: IACS-010759; apalutamide; metabolism; mitochondria; prostate cancer.


Conflict of interest statement

The authors declare no conflict of interest. The funders had no role in the design of the study; in the collection, analyses, or interpretation of data; in the writing of the manuscript; or in the decision to publish the results.

Figures

Figure 1
Figure 1
Mitochondrial activity in PCa. (A) Mitoplate assay. Representative image of plate layout after dye reduction (purple color formation) in PNT1A, LNCaP, and PC-3 cells. The intensity of color formation shows the utilization of a specific substrate in different energy-producing pathways. (B) Rate of dye reduction measured at OD590-OD750 and normalized to a no-substrate control for TCA cycle substrates over 4 h with 5 min measurement intervals. (C) Quantification of the mean slope after 2 h kinetic reading for different TCA cycle substrates. Values were normalized to a no-substrate control. Data from three independent experiments are presented as means ± SEM (n = 3). Significant differences relative to PNT1A are indicated by * p = 0.0289; ** p < 0.01; *** p < 0.001; **** p < 0.0001. (D) Representative virtual lanes of AR and NDUFB8 for PNT1A, LNCaP, and PC-3 (top). Quantification of relative protein expression levels normalized to GAPDH (n = 3) (bottom). The uncropped bolts are shown in Supplementary Materials.
Figure 2
Figure 2
Treatment-induced changes in tumor cell growth. (A) Cell proliferation of PCa cells upon treatment with DMSO, 25 µM of ARN, 10 nM of IACS, and combo (ARN + IACS). Data are presented as means ± SD. Three independent experiments with three technical replicates each per condition are shown (n = 9). Statistical significance is shown by asterisks; ** p < 0.01; *** p < 0.001; **** p < 0.0001. Dose–response curve of ARN (B) and IACS (C) with indicated doses for a treatment period of 1, 2, and 3 days (n = 3). (D) Comparison in cell proliferation of IACS alone versus combination treatment at IACS concentration 1–10 nM (n = 3).
Figure 3
Figure 3
Alterations in cellular respiration upon AR and complex I inhibition. (A) Normalized oxygen consumption rates for different PCa cell lines after sequential addition of mitochondrial stressors oligomycin, FCCP, and rotenone + antimycin A. Cells were treated for three days with either DMSO, 25 µM of ARN, 10 nM of IACS, and a combination. (B) The metabolic parameters basal respiration, ATP production, and maximum respiration were calculated based on the Seahorse XF Cell Mito Stress Test Report Generator. Means ± SEM values of three independent experiments with three replicates each are shown (n = 9). Statistical significance is indicated by * p < 0.05; *** p < 0.001; **** p < 0.0001. (C) PNT1A, LNCaP, C4-2, and PC-3 cells stained for anti-TOM20 (red), visualizing mitochondrial networks. Nuclei were stained with DAPI (blue). White boxed areas were enlarged in the upper right corner. Scale bar: 50 µM. (D) Quantification of TOM20 total cellular fluorescence intensity. For each cell line, n = 40–50 cells were quantified by ImageJ; * p < 0.05; *** p < 0.001; **** p < 0.0001.
Figure 4
Figure 4
PCa cells have different specific glycolytic dependencies. (A) Extracellular acidification rate upon treatment with DMSO, ARN, IACS, and combination. Changes in basal respiration are presented in bar plots as means ± SEM (n = 9). (B) Extracellular medium analysis of glucose and lactate levels over a treatment period of three days measured by a Vi-CELL MetaFlex Bioanalyzer (n = 3). (C) A representative experiment is shown (n = 3). Medium analysis was performed twice independently. A 2-DG sensitivity test in PCa cell lines shows dose–response curves upon 2-DG addition (left). Cell proliferation normalized to untreated control is shown after three days of treatment with 1 mM of 2-DG (right). Data represent means ± SD. Statistical significance is indicated by * p < 0.05; ** p < 0.01; *** p < 0.001; **** p < 0.0001.
Figure 5
Figure 5
Galactose enhances treatment effect through metabolic rewiring. (A) Comparison of relative cell proliferation dose–response curves of increasing IACS concentration between control (glucose-supplemented) and GAL (galactose-supplemented) medium preparations (n = 3) (top row). Cell proliferation upon treatment with 25 µM of ARN and combinations with increasing concentrations of IACS for control and GAL (n = 3) (bottom row). Statistical significance is indicated by * p < 0.05; *** p < 0.001; **** p < 0.0001. (B) Energy map depicting ECAR values plotted against OCR of PCa cells grown in either normal or GAL-supplemented medium (n = 9). Arrows show a left shift in all cell lines towards decreased glycolysis and a slight upward shift in LNCaP, C4-2, and PC-3 cells indicating increased reliance of OXPHOS. Dots represent cells cultured in normal medium. Triangles mark cells cultured in glucose-free, galactose-supplemented medium.

Similar articles

Cited by

References

    1. Siegel R.L., Miller K.D., Fuchs H.E., Jemal A. Cancer statistics, 2022. CA Cancer J. Clin. 2022;72:7–33. doi: 10.3322/caac.21708. - DOI - PubMed
    1. Culp M.B., Soerjomataram I., Efstathiou J.A., Bray F., Jemal A. Recent Global Patterns in Prostate Cancer Incidence and Mortality Rates. Eur. Urol. 2020;77:38–52. doi: 10.1016/j.eururo.2019.08.005. - DOI - PubMed
    1. Ward P.S., Thompson C.B. Metabolic reprogramming: A cancer hallmark even warburg did not anticipate. Cancer Cell. 2012;21:297–308. doi: 10.1016/j.ccr.2012.02.014. - DOI - PMC - PubMed
    1. Faubert B., Solmonson A., DeBerardinis R.J. Metabolic reprogramming and cancer progression. Science. 2020;368:eaaw5473. doi: 10.1126/science.aaw5473. - DOI - PMC - PubMed
    1. Massie C.E., Lynch A., Ramos-Montoya A., Boren J., Stark R., Fazli L., Warren A., Scott H., Madhu B., Sharma N., et al. The androgen receptor fuels prostate cancer by regulating central metabolism and biosynthesis. Embo J. 2011;30:2719–2733. doi: 10.1038/emboj.2011.158. - DOI - PMC - PubMed