. 2023 Nov 28;15(23):5614.
doi: 10.3390/cancers15235614.

Mutation Status and Glucose Availability Affect the Response to Mitochondria-Targeted Quercetin Derivative in Breast Cancer Cells

Affiliations

Mutation Status and Glucose Availability Affect the Response to Mitochondria-Targeted Quercetin Derivative in Breast Cancer Cells

Paweł Przybylski et al. Cancers (Basel). .

Abstract

Mitochondria, the main cellular power stations, are important modulators of redox-sensitive signaling pathways that may determine cell survival and cell death decisions. As mitochondrial function is essential for tumorigenesis and cancer progression, mitochondrial targeting has been proposed as an attractive anticancer strategy. In the present study, three mitochondria-targeted quercetin derivatives (mitQ3, 5, and 7) were synthesized and tested against six breast cancer cell lines with different mutation and receptor status, namely ER-positive MCF-7, HER2-positive SK-BR-3, and four triple-negative (TNBC) cells, i.e., MDA-MB-231, MDA-MB-468, BT-20, and Hs 578T cells. In general, the mito-quercetin response was modulated by the mutation status. In contrast to unmodified quercetin, 1 µM mitQ7 induced apoptosis in breast cancer cells. In MCF-7 cells, mitQ7-mediated apoptosis was potentiated under glucose-depleted conditions and was accompanied by elevated mitochondrial superoxide production, while AMPK activation-based energetic stress was associated with the alkalization of intracellular milieu and increased levels of NSUN4. Mito-quercetin also eliminated doxorubicin-induced senescent breast cancer cells, which was accompanied by the depolarization of mitochondrial transmembrane potential. Limited glucose availability also sensitized doxorubicin-induced senescent breast cancer cells to apoptosis. In conclusion, we show an increased cytotoxicity of mitochondria-targeted quercetin derivatives compared to unmodified quercetin against breast cancer cells with different mutation status that can be potentiated by modulating glucose availability.

Keywords: AMPK; breast cancer; doxorubicin-induced senescence; mito-quercetin; oxidative stress; senolysis.


Conflict of interest statement

The authors have no conflict of interest to disclose.

Figures

Scheme 1
Scheme 1
Multi-step pathways for synthesis of three derivatives of quercetin (mitQ3, mitQ5, and mitQ7) with butyl triphenylphosphonium cation attached at the positions O-3, O-5 and O-7. For brevity, for mitQ5 and mitQ7, the two last steps were marked with one arrow, but steps D and E were subsequently performed, as represented here for mitQ3. All abbreviations and reaction conditions, isolation and identification procedures are described in detail in the Supplementary Material S1.
Figure 1
Figure 1
(Left column): The plots of oxygen uptake during peroxidation of 2.7 mM methyl linoleate in 10 mM DMPC liposomes initiated with 10 mM ABAP; see the Experimental section for details. Lines designed as ABAP represent peroxidation without additives, at pH = 7.0. (Central): Structural formulas of the studied compounds accompanied by ‘Bioavailability Radar’ plots presenting the six physicochemical parameters for each compound, namely lipophilicity (LIPO), molecular weight (SIZE), polarity (POLAR), solubility (INSOLU), rotatable bond flexibility (FLEX) and saturation (INSATU), and with circle charts displaying the affinity of each compound to enzymes and proteins as indicated in the legend at the bottom. (Right column): DSC curves obtained for DMPC liposomes containing 50, 100, and 150 μM of quercetin, mitQ3, mitQ5, and mitQ7. Black line represents pure DMPC liposomes without additives. Each row (AD) represents the data for quercetin, mitQ3, mitQ5, and mitQ7, respectively.
Figure 2
Figure 2
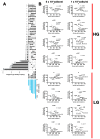
Gene mutation status (A) and correlation analysis between the metabolic activity (MTT-based data) and the number of total gene mutations (B) in six breast cancer cell lines used in the study. (A) Gene mutation raw data were acquired from DepMap portal (https://depmap.org/portal/, accessed on 18 August 2023). Set intersections in a matrix layout were visualized using the UpSet plot. Total, shared and unique gene mutations across six breast cancer cell lines are shown. Blue bars in the y-axis represent the total number of gene mutations in each cell line. Black bars in the x-axis represent the number of mutations shared across cell lines connected by the black dots in the body of the plot. (B) Correlation analysis of the data was performed using a linear correlation (Spearman’s r) test. The 95% confidence interval, r and p values are shown. HG, high-glucose DMEM (4.5 g/L); LG, low-glucose DMEM (1 g/L).
Figure 3
Figure 3
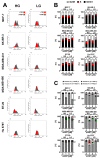
MitQ7 uptake (A), mitQ7-mediated changes in the phases of cell cycle (B) and mitQ7-induced apoptosis (C) in six breast cancer cell lines: namely, ER-positive MCF-7, HER2-positive SK-BR-3 and four triple-negative (TNBC) MDA-MB-231, MDA-MB-468, BT-20, and Hs 578T cells. Breast cancer cells were treated with 1 µM mitQ7 for 24 h. (A) MitQ7 uptake was analyzed using imaging flow cytometry and dedicated software. Two parameters were considered, namely Normalized Frequency and Intensity_MC_Ch02. Representative histograms are presented. (B) DNA content-based analysis of cell cycle using flow cytometry and dedicated DNA staining. Bars indicate SD, n = 3, *** p < 0.001, ** p < 0.01, * p < 0.05 compared to HG or LG untreated control (ANOVA and Dunnett’s a posteriori test), ### p < 0.001, ## p < 0.01 compared to HG corresponding conditions (ANOVA and Dunnett’s a posteriori test). (C) Apoptosis was assayed using flow cytometry and Annexin V staining (apoptotic marker) and 7-AAD staining (necrotic marker). Four subpopulations were revealed, namely live cells (dual staining-negative), early apoptotic cells (Annexin V-positive), late apoptotic cells (dual staining-positive), and necrotic cells (7-AAD-positive). Bars indicate SD, n = 3, *** p < 0.001, ** p < 0.01, * p < 0.05 compared to HG or LG untreated control (ANOVA and Dunnett’s a posteriori test), ### p < 0.001, ## p < 0.01, # p < 0.05 compared to HG corresponding conditions (ANOVA and Dunnett’s a posteriori test). HG, high-glucose DMEM (4.5 g/L); LG, low-glucose DMEM (1 g/L).
Figure 4
Figure 4
MitQ7-stimulated oxidative stress and related responses in six breast cancer cell lines, namely, ER-positive MCF-7, HER2-positive SK-BR-3 and four triple-negative (TNBC) MDA-MB-231, MDA-MB-468, BT-20, and Hs 578T cells. Breast cancer cells were treated with 1 µM or 5 µM mitQ7 for 24 h. (AE) Imaging cytometry-based analysis was applied. (A) Total ROS levels were assessed using CellROX™ Green Reagent. (B) Mitochondrial superoxide levels were analyzed using MitoSoxTM Red Indicator. (C) Lipid peroxidation-derived protein modifications were revealed using a Click-iT® Lipid Peroxidation Imaging Kit. (D) FOXO3a activation (increased levels of nuclear FOXO3a) was analyzed using dedicated anti-FOXO3a antibody. (E) The levels of superoxide dismutase SOD1 were investigated using dedicated anti-SOD1 antibody. (AE). Data are presented as relative fluorescence units (RFU). Box and whisker plots are shown, n = 3, *** p < 0.001, ** p < 0.01, * p < 0.05 compared to HG or LG untreated control (ANOVA and Dunnett’s a posteriori test), ### p < 0.001, ## p < 0.01, # p < 0.05 compared to HG corresponding conditions (ANOVA and Dunnett’s a posteriori test). HG, high-glucose DMEM (4.5 g/L); LG, low-glucose DMEM (1 g/L).
Figure 5
Figure 5
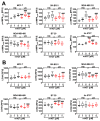
MitQ7-mediated activation of AMPK (A) and changes in lactate dehydrogenase (LDHA) levels (B) in six breast cancer cell lines, namely, ER-positive MCF-7, HER2-positive SK-BR-3 and four triple-negative (TNBC) MDA-MB-231, MDA-MB-468, BT-20, and Hs 578T cells. Breast cancer cells were treated with 1 µM or 5 µM mitQ7 for 24 h. (A,B) Imaging cytometry-based analysis was applied. (A) Phosphorylation status of AMPK was studied using dedicated anti-phospho-AMPK antibody. (B) The levels of LDHA were analyzed using dedicated anti-LDHA antibody. (A,B) Data are presented as relative fluorescence units (RFU). Box and whisker plots are shown, n = 3, *** p < 0.001, ** p < 0.01, * p < 0.05 compared to HG or LG untreated control (ANOVA and Dunnett’s a posteriori test), ### p < 0.001, ## p < 0.01, # p < 0.05 compared to HG corresponding conditions (ANOVA and Dunnett’s a posteriori test). HG, high-glucose DMEM (4.5 g/L); LG, low-glucose DMEM (1 g/L).
Figure 6
Figure 6
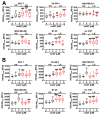
MitQ7-mediated changes in the levels of cytosolic NSUN4 (A) and NSUN6 (B) in six breast cancer cell lines, namely, ER-positive MCF-7, HER2-positive SK-BR-3 and four triple-negative (TNBC) MDA-MB-231, MDA-MB-468, BT-20, and Hs 578T cells. Breast cancer cells were treated with 1 µM or 5 µM mitQ7 for 24 h. (A,B) Imaging cytometry-based analysis was applied. (A) The levels of NSUN4 were investigated using dedicated anti-NSUN4 antibody. (B) The levels of NSUN6 were analyzed using dedicated anti-NSUN6 antibody. (A,B) Data are presented as relative fluorescence units (RFU). Box and whisker plots are shown, n = 3, *** p < 0.001, * p < 0.05 compared to HG or LG untreated control (ANOVA and Dunnett’s a posteriori test), ### p < 0.001, ## p < 0.01, # p < 0.05 compared to HG corresponding conditions (ANOVA and Dunnett’s a posteriori test). HG, high-glucose DMEM (4.5 g/L); LG, low-glucose DMEM (1 g/L).
Figure 7
Figure 7
MitQ7-induced cellular senescence in six breast cancer cell lines, namely, ER-positive MCF-7, HER2-positive SK-BR-3 and four triple-negative (TNBC) MDA-MB-231, MDA-MB-468, BT-20, and Hs 578T cells. Breast cancer cells were treated with 1 µM mitQ7 for 24 h, test compound was removed and cells were cultured for 7 days after drug removal with medium exchange every 48 h. Imaging cytometry and several markers of cellular senescence were considered, namely (A) senescence-associated beta-galactosidase (SA-beta-gal) activity using a dedicated staining kit, (B) the levels of p21 using a dedicated anti-p21 antibody, (C) the levels of p27 using a dedicated anti-p27 antibody, (D) the levels of IL-6 using a dedicated anti-IL-6 antibody, (E) the levels of IL-8 using a dedicated anti-IL-8 antibody. (AE) Data are presented as relative fluorescence units (RFU). Box and whisker plots are shown, n = 3, *** p < 0.001, ** p < 0.01, * p < 0.05 compared to HG or LG untreated control (ANOVA and Dunnett’s a posteriori test), ### p < 0.001, ## p < 0.01, # p < 0.05 compared to HG corresponding conditions (ANOVA and Dunnett’s a posteriori test). HG, high-glucose DMEM (4.5 g/L); LG, low-glucose DMEM (1 g/L).
Figure 8
Figure 8
MitQ7-mediated senolytic activity (A) and changes in mitochondrial transmembrane potential (B) in doxorubicin-induced senescent breast cancer cells. MCF-7, SK-BR-3, MDA-MB-231, MDA-MB-468, BT-20, and Hs 578T cells were treated with 35 nM doxorubicin for 24 h and left for growth for 7 days after drug removal to induce senescence program. Doxorubicin-induced senescent breast cancer cells were then treated with 1 µM mitQ7 for 24 h, and apoptosis was assayed using flow cytometry and Annexin V staining (A), and changes in mitochondrial transmembrane potential (B) were revealed using flow cytometry and dedicated mitopotential probe. Bars indicate SD, n = 3, *** p < 0.001, ** p < 0.01, * p < 0.05 compared to HG or LG untreated control (ANOVA and Dunnett’s a posteriori test), ### p < 0.001, ## p < 0.01, # p < 0.05 compared to HG corresponding conditions (ANOVA and Dunnett’s a posteriori test). HG, high-glucose DMEM (4.5 g/L); LG, low-glucose DMEM (1 g/L).
Figure 9
Figure 9
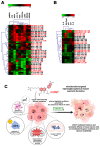
Clustering analysis of selected stress parameters ((A), pAMPK, LPO, SOD1, mitochondrial superoxide, ROS, FOXO3a, LDHA, NSUN4, and NSUN6) and senescence biomarkers ((B), SA-beta-gal, p21, p27, IL-6, and IL-8) as a function of glucose concertation and treatment with mitQ7 (1 or 5 µM) in six breast cancer cell lines. (A,B) Heat maps were generated from imaging flow cytometry-based data. Hierarchical clustering was performed using Genesis software, version 1.8.1. HG (in black), high-glucose DMEM (4.5 g/L); LG (in red), low-glucose DMEM (1 g/L). (C) A summarizing scheme. Mitochondria-targeted derivative of quercetin (mitQ7) promoted apoptotic cell death, oxidative stress conditions, energetic stress associated with the alkalization of intracellular pH and changes in the levels of mitochondrial protein NSUN4 in breast cancer cells. The anticancer effects of mitQ7 against breast cancer cells may be modulated by gene mutation status and glucose availability.

Similar articles

Cited by

References

    1. Wallace D.C. Mitochondria and cancer. Nat. Rev. Cancer. 2012;12:685–698. doi: 10.1038/nrc3365. - DOI - PMC - PubMed
    1. Denisenko T.V., Gorbunova A.S., Zhivotovsky B. Mitochondrial Involvement in Migration, Invasion and Metastasis. Front. Cell Dev. Biol. 2019;7:355. doi: 10.3389/fcell.2019.00355. - DOI - PMC - PubMed
    1. Sica V., Bravo-San Pedro J.M., Stoll G., Kroemer G. Oxidative phosphorylation as a potential therapeutic target for cancer therapy. Int. J. Cancer. 2020;146:10–17. doi: 10.1002/ijc.32616. - DOI - PubMed
    1. Tan A.S., Baty J.W., Dong L.-F., Bezawork-Geleta A., Endaya B., Goodwin J., Bajzikova M., Kovarova J., Peterka M., Yan B., et al. Mitochondrial Genome Acquisition Restores Respiratory Function and Tumorigenic Potential of Cancer Cells without Mitochondrial DNA. Cell Metab. 2015;21:81–94. doi: 10.1016/j.cmet.2014.12.003. - DOI - PubMed
    1. Hubackova S., Magalhaes Novais S., Davidova E., Neuzil J., Rohlena J. Mitochondria-driven elimination of cancer and senescent cells. Biol. Chem. 2019;400:141–148. doi: 10.1515/hsz-2018-0256. - DOI - PubMed