. 2023 Nov 28;15(23):5621.
doi: 10.3390/cancers15235621.

Spatial Distribution of Non-Immune Cells Expressing Glycoprotein A Repetitions Predominant in Human and Murine Metastatic Lymph Nodes

Affiliations

Spatial Distribution of Non-Immune Cells Expressing Glycoprotein A Repetitions Predominant in Human and Murine Metastatic Lymph Nodes

Loïc Rouaud et al. Cancers (Basel). .

Abstract

Several types of cancer spread through the lymphatic system via the sentinel lymph nodes (LNs). Such LN-draining primary tumors, modified by tumor factors, lead to the formation of a metastatic niche associated with an increased number of Foxp3+ regulatory T cells (Tregs). These cells are expected to contribute to the elaboration of an immune-suppressive environment. Activated Tregs express glycoprotein A repetitions predominant (GARP), which binds and presents latent transforming growth factor beta 1 (TGF-β1) at their surface. GARP is also expressed by other non-immune cell types poorly described in LNs. Here, we mapped GARP expression in non-immune cells in human and mouse metastatic LNs. The mining of available (human and murine) scRNA-Seq datasets revealed GARP expression by blood (BEC)/lymphatic (LEC) endothelial, fibroblastic, and perivascular cells. Consistently, through immunostaining and in situ RNA hybridization approaches, GARP was detected in and around blood and lymphatic vessels, in (αSMA+) fibroblasts, and in perivascular cells associated with an abundant matrix. Strikingly, GARP was detected in LECs forming the subcapsular sinus and high endothelial venules (HEVs), two vascular structures localized at the interface between LNs and the afferent lymphatic and blood vessels. Altogether, we here provide the first distribution maps for GARP in human and murine LNs.

Keywords: GARP mRNA; LRRC32; cancer; glycoprotein A repetitions predominant (GARP); lymph node; metastases; transforming growth factor beta 1 (TGF-β1); tumor microenvironment.


Conflict of interest statement

The authors declare no conflict of interest.

Figures

Figure A1
Figure A1
Full scans of Western blot images shown in Figure 2a. (a) Western blot membrane of GARP in Jurkat hGARP used as a positive control. The red rectangle corresponds to the first lane in Figure 2a. (b) Western blot membrane of GARP on HUVECs, LECs, and HLFs in which the red rectangle corresponds to the right part of Western blot shown in Figure 2a.
Figure A2
Figure A2
Evaluation of GARP integrins partners in HUVEC, LEC, and HLF cells cultured in basal condition. (a) Flow cytometric analyses were conducted to evaluate the expression of αV (green), β3 (blue), β6 (orange), and β8 (purple) integrins in the different cells. The isotype control is depicted in grey, and positive signals for each integrin are shown in color (described above) as a percentage of the maximum. (b) The relative MFI is represented with a bar graph for each integrin shown on the left panel; n is at least equal to 4 (n ≥ 4, means ± SD, n.s, no significance, determined by one−way ANOVA).
Figure A3
Figure A3
Lrrc32mRNA (Garp) and Prox1mRNA expression by RNAscope coupled with FoxP3 immunostaining as a control in Tregs cells. Scale bar = 50 µm.
Figure A4
Figure A4
Immunostaining ITGA7 (pink) in human LN samples. Scale bar = 100 µm.
Figure 1
Figure 1
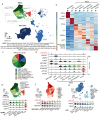
LRRC32 gene expression analysis in individual cells derived from metastasis-free human LNs. (a) UMAP plot clusters 27,111 cells from 9 metastasis-free LNs into 8 distinct groups (BECs/HEVs, LECs, SCs-PTX3, SCs-C7, SCs-SFRP4, SCs-AGT, ACs-MedRCs, and PvCs). (b) Heatmap showing the expression levels of the top-ranking marker genes in each cluster. Key genes are indicated on the left. (c) Number of DEGs in each cluster (d). Violin plot showing expression of genes of interest including LRRC32 (in red) in each cluster. (eg) UMAP plot clusters (e) non-endothelial stromal cells (NESCs), (f) BECs/HEVs, and (g) LECs, and violin plots showing expression of genes of interest, including LRRC32 (in red) in each cluster.
Figure 2
Figure 2
Evaluation of GARP in HUVEC, LEC, and HLF cells cultured under basal conditions. (a) Western blot analysis of GARP expression. The blot is a representative blot out of 4 independent experiments. The bar graph shows the quantification of GARP protein levels relative to the GAPDH protein signal (GARP/GAPDH signals) (n = 4, means ± SD, n.s. determined by one-way ANOVA). (b) Flow cytometry analysis of GARP at the surface of primary cells. Jurkat cells overexpressing GARP (Jurkat−hGARP) were used as a positive control. The isotype control is represented in grey, and the positive signal is depicted in red as a percentage of the maximum. The relative MFI of GARP in flow cytometry is represented with a bar graph (n ≥ 3, means ± SD, n.s., no significance, determined by one-way ANOVA).
Figure 3
Figure 3
Multiplex immunofluorescence identifies GARP expression in human LN. (a) Immunofluorescence was conducted on frozen sections of human LN derived from metastatic-negative (MLN−, n = 3) and metastatic-positive (MLN+, n = 18) LNs from patients diagnosed with breast cancer (BC; 3 MLN− and 14 MLN+) or cervical cancer (CC; 1 MLN− and 4 MLN+). The sections were stained with anti-GARP antibody (in green) and DAPI for nuclei (in blue). Scale bar = 2, 1, 1.5, or 2.5 mm (b) Computer-assisted quantification of GARP density using QuPath (relative density with DAPI area) in MLN− and MLN+. The bar graph is represented with individual data points, and results are expressed by mean ± SD (** p = 0.0053 determined by the Mann–Whitney test).
Figure 4
Figure 4
Multiplex immunofluorescence identifies GARP expression in lymphatic and blood vessels in human LNs. (a) Multiplex immunofluorescence staining of GARP (in green), CD34 (in red), podoplanin (in pink), and nuclei (DAPI, in blue) on MLN+ from patients with breast cancer (n = 14) or with cervical cancer (n = 4). LV: lymphatic vessel, BV: blood vessel. Scale bar = 100 µm. (b) Multiplex immunofluorescence staining of GARP (in green), PDPN (in red), and nuclei (DAPI, in blue) focused on the LN capsule on MLN+ from patients with breast cancer (n = 14) or with cervical cancer (n = 4). SCS: subcapsular sinus. Scale bar = 100 µm. (c) Multiplex immunofluorescence staining of GARP (in red), PNAd (in green), and nuclei (DAPI, in blue) on MLN+ from patients with breast cancer (n = 14) or with cervical cancer (n = 4). Scale bar = 50 µm. (d) Multiplex immunofluorescence staining of GARP (in green), αSMA (in red), and nuclei (DAPI, in blue) of MLN+ from patients with breast cancer (n = 14) or with cervical cancer (n = 4) or (e) in the ECM. Scale bar = 100 µm.
Figure 5
Figure 5
Lrrc32 gene expression analysis in individual cells derived from metastasis-free mice LNs. (a) UMAP plot clusters 3,418 cells from 3 C57/Bl6 female mice LNs cells into 8 distinct groups (BEC/HEV, LEC I, LEC II, MedRCs, ACs, MRCs, TRCs, and PvCs). (b) Heatmap showing the expression levels of the top-ranking marker genes in each cluster. Key genes are indicated on the left. (c) Number of DEGs in each cluster. (d) Violin plot showing expression of genes of interest including Lrrc32 (in red) in each cluster. (e) UMAP plot of Lrrc32 expression level in each cluster.
Figure 6
Figure 6
Mapping of Lrrc32 mRNA (encoding Garp) in mouse LN parenchyma with hybridization. (a) mRNA detection by RNAscope of Prox1 mRNA (white), Lrrc32 mRNA (red), and/or coupled with Lyve-1 immunostaining on mouse cervical LN with a focus on the parenchyma area in control condition; (b) mRNA detection by RNAscope of Prox1 mRNA (white), Lrrc32 mRNA (red), and/or coupled with Lyve-1 immunostaining in a metastatic LN 3 weeks after B16F10 transplantation. Scale bar = 100 and 50 µm.
Figure 7
Figure 7
Mapping of Lrrc32 mRNA (encoding Garp) in mouse LN SCS with hybridization. (a) mRNA detection by RNAscope of Prox1 mRNA (white), Lrrc32 mRNA (red) coupled with Lyve-1 immunostaining on mouse cervical LN with a focus on the SCS area in the control condition and (b) metastatic LN 3 weeks after B16F10 transplantation. Scale bar = 25 µm.
Figure 8
Figure 8
Lrrc32 (encoding Garp) mRNA is expressed in HEV in mouse LN detected by hybridization. (a) mRNA detection by RNAscope of Prox1 mRNA (white), Lrrc32 mRNA (red) coupled with PNAd (HEV, in green) immunostaining on mouse cervical LN in control and (b) a metastatic LN 3 weeks after B16F10 transplantation conditions. The dashed line highlights HEV vessel sections. Scale bar = 20 µm.
Figure 9
Figure 9
Lrrc32 (encoding Garp) is expressed in blood and lymphatic vessels in mouse LN detected by hybridization. (a) mRNA detection by RNAscope of Prox1 mRNA (white), Lrrc32 mRNA (red) coupled with αSMA (in red), and CD31 (in pink) immunostaining on mouse cervical LN in control and (b) a metastatic LN 3 weeks after B16F10 transplantation conditions. The dashed line highlights the lymphatic vessel network. LV: lymphatic vessel, BV: blood vessel. White arrowheads show blood endothelial cells inside the vessel, and orange arrowheads indicate perivascular cells (PvCs). Scale bar = 20 µm.

Similar articles

References

    1. Chatterjee G., Pai T., Hardiman T., Avery-Kiejda K., Scott R.J., Spencer J., Pinder S.E., Grigoriadis A. Molecular Patterns of Cancer Colonisation in Lymph Nodes of Breast Cancer Patients. Breast Cancer Res. 2018;20:143. doi: 10.1186/s13058-018-1070-3. - DOI - PMC - PubMed
    1. Balsat C., Blacher S., Herfs M., Van de Velde M., Signolle N., Sauthier P., Pottier C., Gofflot S., De Cuypere M., Delvenne P., et al. A Specific Immune and Lymphatic Profile Characterizes the Pre-Metastatic State of the Sentinel Lymph Node in Patients with Early Cervical Cancer. Oncoimmunology. 2017;6:e1265718. doi: 10.1080/2162402X.2016.1265718. - DOI - PMC - PubMed
    1. Wakisaka N., Hasegawa Y., Yoshimoto S., Miura K., Shiotani A., Yokoyama J., Sugasawa M., Moriyama-Kita M., Endo K., Yoshizaki T. Primary Tumor-Secreted Lymphangiogenic Factors Induce Pre-Metastatic Lymphvascular Niche Formation at Sentinel Lymph Nodes in Oral Squamous Cell Carcinoma. PLoS ONE. 2015;10:e0144056. doi: 10.1371/journal.pone.0144056. - DOI - PMC - PubMed
    1. Tammela T., Alitalo K. Lymphangiogenesis: Molecular Mechanisms and Future Promise. Cell. 2010;140:460–476. doi: 10.1016/j.cell.2010.01.045. - DOI - PubMed
    1. Maus R.L.G., Jakub J.W., Hieken T.J., Nevala W.K., Christensen T.A., Sutor S.L., Flotte T.J., Markovic S.N. Identification of Novel, Immune-Mediating Extracellular Vesicles in Human Lymphatic Effluent Draining Primary Cutaneous Melanoma. OncoImmunology. 2019;8:e1667742. doi: 10.1080/2162402X.2019.1667742. - DOI - PMC - PubMed