. 2023 Nov 28;15(23):5623.
doi: 10.3390/cancers15235623.

Characteristics of ABCC4 and ABCG2 High Expression Subpopulations in CRC-A New Opportunity to Predict Therapy Response

Affiliations

Characteristics of ABCC4 and ABCG2 High Expression Subpopulations in CRC-A New Opportunity to Predict Therapy Response

Jakub Kryczka et al. Cancers (Basel). .

Abstract

Background: Our previous findings proved that ABCC4 and ABCG2 proteins present much more complex roles in colorectal cancer (CRC) than typically cancer-associated functions as drug exporters. Our objective was to evaluate their predictive/diagnostic potential.

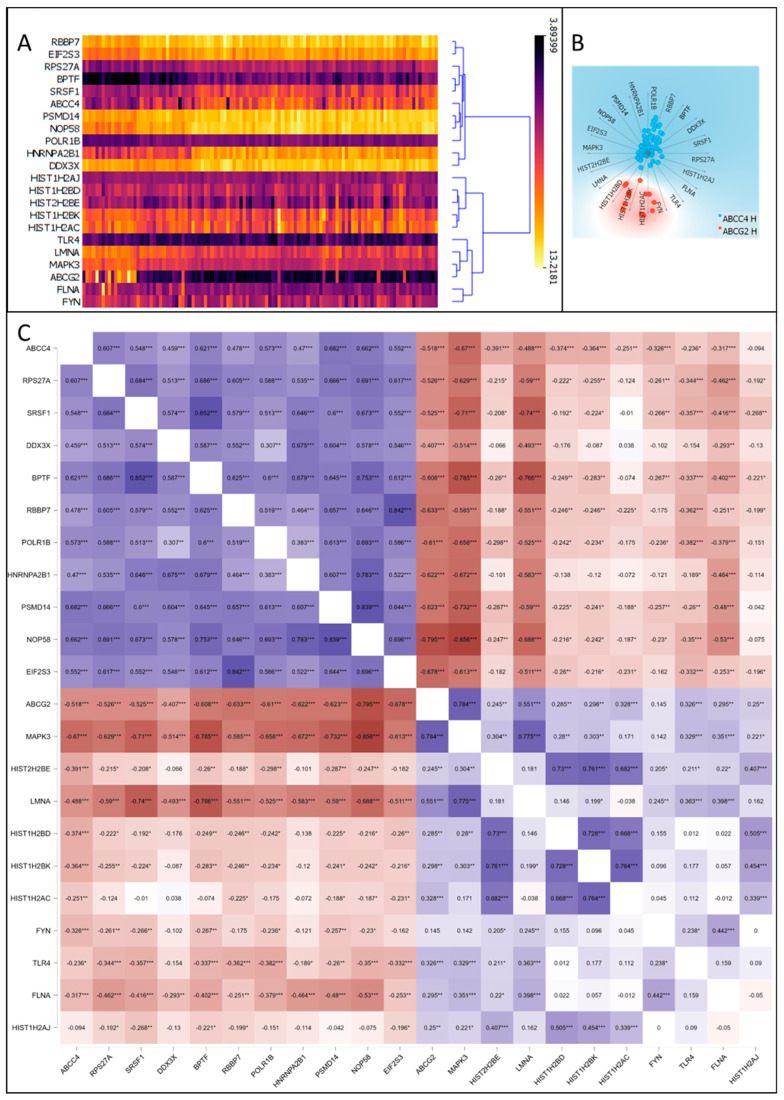
Methods: CRC patients' transcriptomic data from the Gene Expression Omnibus database (GSE18105, GSE21510 and GSE41568) were discriminated into two subpopulations presenting either high expression levels of ABCC4 (ABCC4 High) or ABCG2 (ABCG2 High). Subpopulations were analysed using various bioinformatical tools and platforms (KEEG, Gene Ontology, FunRich v3.1.3, TIMER2.0 and STRING 12.0).

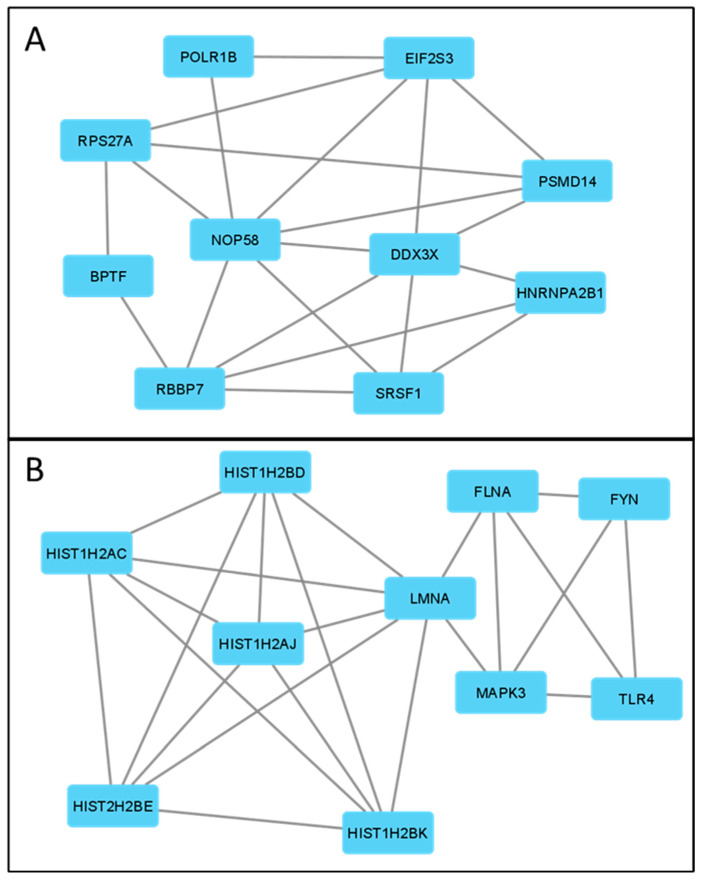
Results: The analysed subpopulations present different gene expression patterns. The protein-protein interaction network of subpopulation-specific genes revealed the top hub proteins in ABCC4 High: RPS27A, SRSF1, DDX3X, BPTF, RBBP7, POLR1B, HNRNPA2B1, PSMD14, NOP58 and EIF2S3 and in ABCG2 High: MAPK3, HIST2H2BE, LMNA, HIST1H2BD, HIST1H2BK, HIST1H2AC, FYN, TLR4, FLNA and HIST1H2AJ. Additionally, our multi-omics analysis proved that the ABCC4 expression correlates with substantially increased tumour-associated macrophage infiltration and sensitivity to FOLFOX treatment.

Conclusions: ABCC4 and ABCG2 may be used to distinguish CRC subpopulations that present different molecular and physiological functions. The ABCC4 High subpopulation demonstrates significant EMT reprogramming, RNA metabolism and high response to DNA damage stimuli. The ABCG2 High subpopulation may resist the anti-EGFR therapy, presenting higher proteolytical activity.

Keywords: ABCC4; ABCG2; CRC; CRC diagnostic and prognostic biomarkers; CRC subpopulations; immune cell infiltration; metastasis.


Conflict of interest statement

The authors declare that they have no competing interest.

Figures

Figure 1
Figure 1
ABCC4 and ABCG2 involvement in CRC progression. ABCC4 and ABCG2 expression levels in “CRC” and noncancerous “Normal” colon tissue were calculated using data from GSE18105 (A,C) and GSE21510 (B,D) and visualised using Orange data mining 3.31.1 software. A normality test (Shapiro–Wilk) was performed, followed by the Mann–Whitney U test ** p < 0.005; *** p < 0.001; ABCC4 (E) and ABCG2 (F) impact on survival rate was analysed using TCGA data and visualised by the TIMER2.0 platform. The correlation of ABCC4 (G) and ABCG2 (H) wild-type (WT) and mutated variants was calculated using TCGA data and visualised by the TIMER2.0 platform. Wilcoxon test was performed, and the p-value is indicated in the figure.
Figure 2
Figure 2
Correlation of mutated ABCC4 gene expression and immune cell infiltration of CRC. ABCC4 presents a high positive correlation with CD4+ Th2 log2FC = 0.565 (A) and CD4+ Th1 log2FC = 0.805 (B), CD8+ central memory log2FC = 1.401 (C) and CD8+ naive log2FC = 0.526 (D) T-cell infiltration. The calculation was performed using TCGA data and visualised by the TIMER2.0 platform. Wilcoxon test was performed, and the p-value is indicated in the figure.
Figure 3
Figure 3
Identification of CRC subgroups presenting high ABCC4 (ABCC4 High) and ABCG2 (ABCG2 High) expression levels and related DEGs. Identification of CRC samples belonging to each subgroup using GSE18105 (A) and GSE21510 (B) datasets. Visualisation performed using a 2D VizRank-based algorithm and Orange data mining 3.31.1 software. Visual representation of differently expressed genes (DEGs) for ABCG2 High and ABCC4 High CRC subgroups in GSE18105 and GSE21510 analysed using the GEO2R online tool (C). Venn diagram of selected ABCG2 High and ABCC4 High DEGs from datasets GSE18105 and GSE21510 (D). Venn diagram presenting no mutual DEGs between ABCC4 High and ABCG2 High subgroups (E).
Figure 4
Figure 4
Enrichment analysis of ABCC4 High and ABCG2 High CRC subgroups related to DEGs. Data were analysed and visualised using the FunRich platform supported by the Gene Ontology database, depicting the total percentage of subgroup-specific DEGs enriched in Biological Process (A) and Molecular Functions (B).
Figure 5
Figure 5
ABCC4 and ABCG2 correlation with top hub proteins selected from ABCC4 High and ABCG2 High CRC subgroups related to DEGs. Hierarchical clustering analysis of chosen top protein hubs, selected from DEGs using mRNA values of CRC patients from GSE18105 and GSE21510 datasets visualised using Orange data mining 3.31.1 software (A). Radial visualisation of clusters created by chosen top networking DEGs visualised using the FreeViz tool and Orange data mining 3.31.1 software and mRNA values of CRC patients from GSE18105 and GSE21510 datasets (B). Pearson correlation matrix of ABCC4, ABCG2 and chosen DEGs, using mRNA values of CRC patients from GSE18105 and GSE21510 datasets, calculated and visualised using JASP 0.16.0.0 software. * p < 0.05; ** p < 0.005; *** p < 0.001 (C).
Figure 6
Figure 6
Protein–protein interaction network (PPI) of ABCC4 High (A) and ABCG2 High (B) CRC subgroups related to top networking DEGs. Calculated using the STRING platform and visualised by Cytoscape 3.9.1.
Figure 7
Figure 7
Selected DEGs expression level and its implication as metastatic CRC organotropism biomarkers. mRNA expression levels of selected DEGs in primary CRC, liver, lung and omentum metastases. Data downloaded from GSE41568 were calculated and visualised using JASP 0.16.0.0 software. A normality test (Shapiro–Wilk) was performed, followed by the Mann–Whitney U test (A)—linear projection model of primary and metastatic CRC based on the mRNA expression level of chosen DEGs. GSE41568 data were analysed and visualised using Orange data mining 3.31.1 software. Dashed lines presents region of interest formed by chosen DEGs mRNA expression consisting mostly of primary (orange) and metastatic (red) CRC (B).
Figure 8
Figure 8
Selected DEGs’ impact on CRC patients’ survival rate. RBBP7, FLNA, POLR1B, EIF2S3, PSMD14 and FYN impact on survival rate was analysed using TCGA data and visualised by the TIMER2.0 platform. Dashed lines indicate 5-year survival rate (60 months) for CRC samples characterised by low (blue) or high (red) expression of chosen DEGs.
Figure 9
Figure 9
Chemotherapy response predictive capabilities of ABCC4 and ABCG2 mRNA expression. Data containing FOLFIRI (A)- and FOLFOX (B)-resistant and -sensitive patients’ responses were downloaded from the GEO database (GSE62080 and GSE83129, respectively). Visualisation was performed using a 2D VizRank-based algorithm and Orange data mining 3.31.1 software. Dashed lines present gates set for ABCG2 High and ABCC4 High subgroups. mRNA expression of ABCC4 I ABCG2 in FOLFIRI (C)- and FOLFOX (D)-treated CRC patients’ sample. Visualisation was performed using Orange data mining 3.31.1 software and the GEO database (GSE62080 and GSE83129, respectively).

Similar articles

Cited by

References

    1. Henry J.T., Johnson B. Current and evolving biomarkers for precision oncology in the management of metastatic colorectal cancer. Chin. Clin. Oncol. 2019;8:49. doi: 10.21037/cco.2019.08.08. - DOI - PubMed
    1. Xie Y.-H., Chen Y.-X., Fang J.-Y. Comprehensive review of targeted therapy for colorectal cancer. Signal Transduct. Target. Ther. 2020;5:22. doi: 10.1038/s41392-020-0116-z. - DOI - PMC - PubMed
    1. Vatandoust S., Price T.J., Karapetis C.S. Colorectal cancer: Metastases to a single organ. World J. Gastroenterol. 2015;21:11767–11776. doi: 10.3748/wjg.v21.i41.11767. - DOI - PMC - PubMed
    1. Baran B., Mert Ozupek N., Yerli Tetik N., Acar E., Bekcioglu O., Baskin Y. Difference Between Left-Sided and Right-Sided Colorectal Cancer: A Focused Review of Literature. Gastroenterol. Res. 2018;11:264–273. doi: 10.14740/gr1062w. - DOI - PMC - PubMed
    1. Hsu H.-H., Chen M.-C., Baskaran R., Lin Y.-M., Day C.H., Lin Y.-J., Tu C.-C., Vijaya Padma V., Kuo W.-W., Huang C.-Y. Oxaliplatin resistance in colorectal cancer cells is mediated via activation of ABCG2 to alleviate ER stress induced apoptosis. J. Cell. Physiol. 2018;233:5458–5467. doi: 10.1002/jcp.26406. - DOI - PubMed