

Plasma Immune Proteins and Circulating Tumor DNA Predict the Clinical Outcome for Non-Small-Cell Lung Cancer Treated with an Immune Checkpoint Inhibitor
- PMID: 38067332
- PMCID: PMC10705682
- DOI: 10.3390/cancers15235628
Plasma Immune Proteins and Circulating Tumor DNA Predict the Clinical Outcome for Non-Small-Cell Lung Cancer Treated with an Immune Checkpoint Inhibitor
Abstract
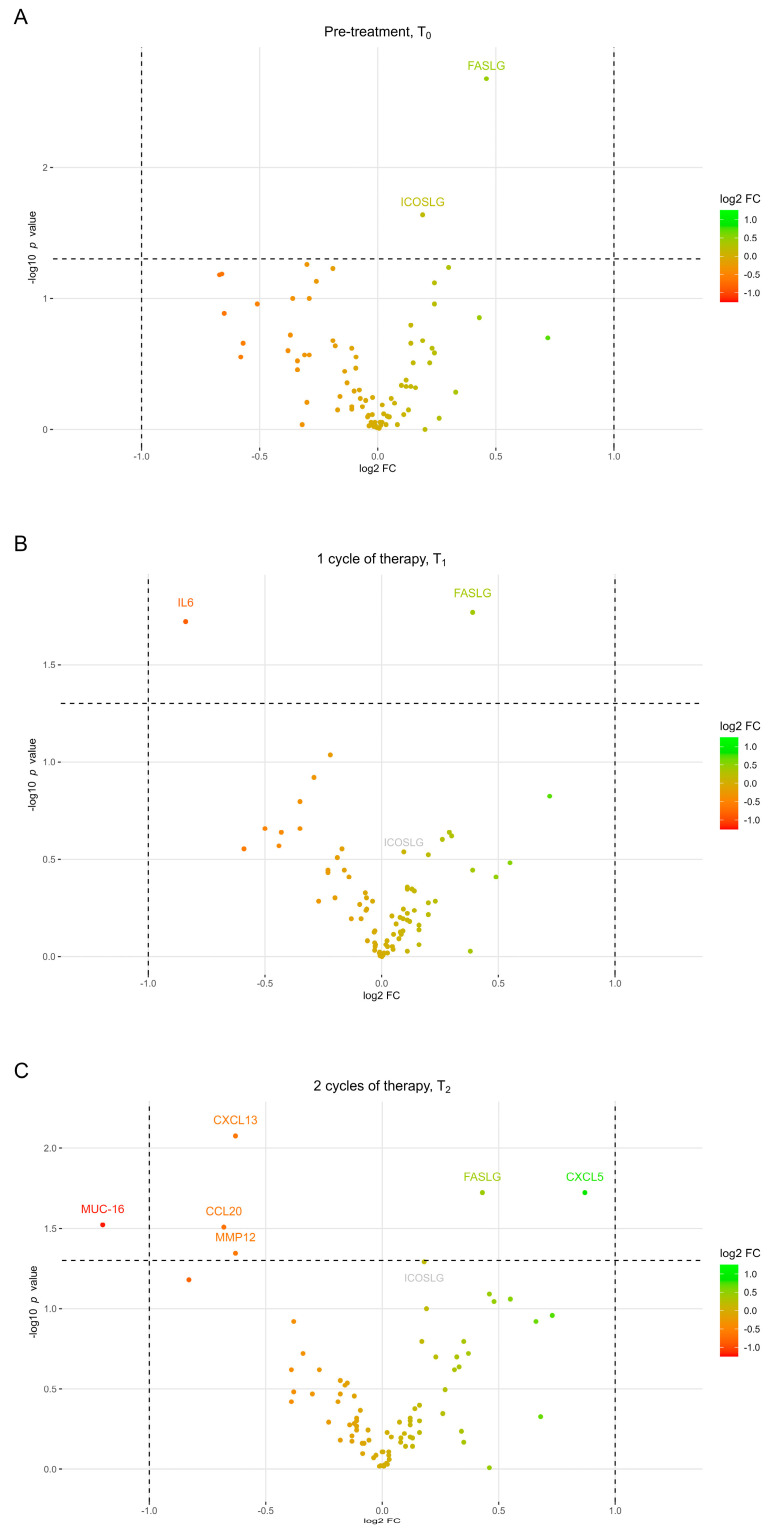
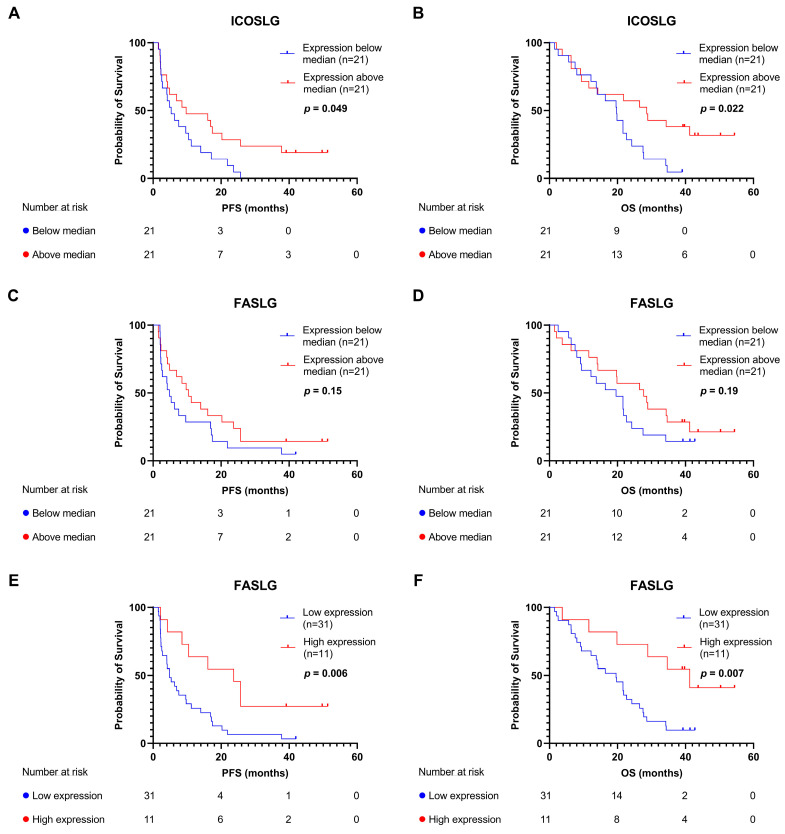
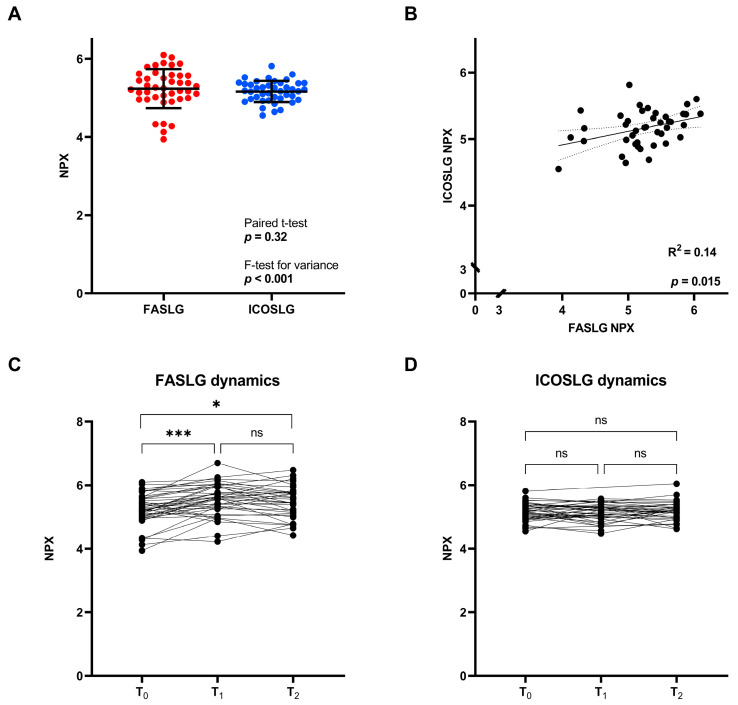
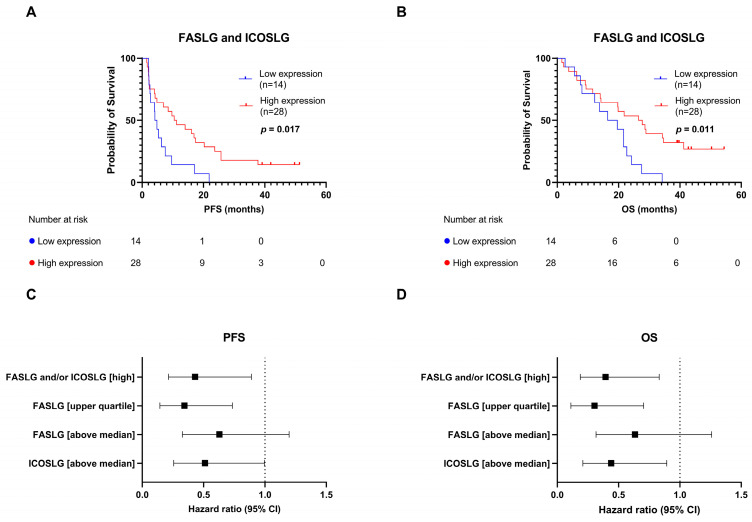
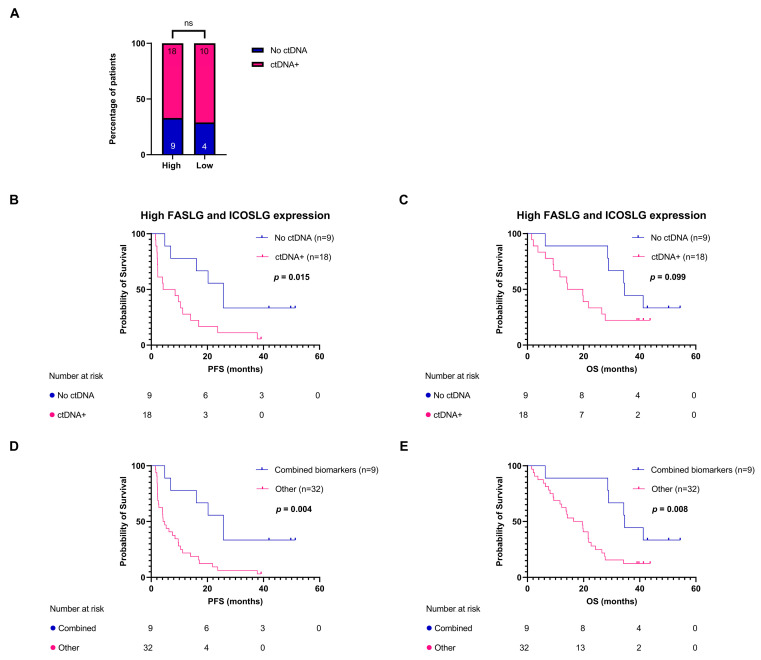
Immunotherapy has altered the therapeutic landscape for patients with non-small-cell lung cancer (NSCLC). The immune checkpoint inhibitor pembrolizumab targets the PD-1/PD-L1 signaling axis and produces durable clinical responses, but reliable biomarkers are lacking. Using 115 plasma samples from 42 pembrolizumab-treated patients with NSCLC, we were able to identify predictive biomarkers. In the plasma samples, we quantified the level of 92 proteins using the Olink proximity extension assay and circulating tumor DNA (ctDNA) using targeted next-generation sequencing. Patients with an above-median progression-free survival (PFS) had significantly higher expressions of Fas ligand (FASLG) and inducible T-cell co-stimulator ligand (ICOSLG) at baseline than patients with a PFS below the median. A Kaplan-Meier analysis demonstrated that high levels of FASLG and ICOSLG were predictive of longer PFS and overall survival (OS) (PFS: 10.83 vs. 4.49 months, OS: 27.13 vs. 18.0 months). Furthermore, we identified a subgroup with high expressions of FASLG and ICOSLG who also had no detectable ctDNA mutations after treatment initiation. This subgroup had significantly longer PFS and OS rates compared to the rest of the patients (PFS: 25.71 vs. 4.52 months, OS: 34.62 vs. 18.0 months). These findings suggest that the expressions of FASLG and ICOSLG at baseline and the absence of ctDNA mutations after the start of treatment have the potential to predict clinical outcomes.
Keywords: biomarkers; circulating tumor DNA; immune checkpoint inhibitor; immuno-oncology; immunotherapy; non-small-cell lung cancer.
Conflict of interest statement
The authors declare no conflict of interest.
Figures
Similar articles
-
Association of Survival and Immune-Related Biomarkers With Immunotherapy in Patients With Non-Small Cell Lung Cancer: A Meta-analysis and Individual Patient-Level Analysis.JAMA Netw Open. 2019 Jul 3;2(7):e196879. doi: 10.1001/jamanetworkopen.2019.6879. JAMA Netw Open. 2019. PMID: 31290993 Free PMC article.
-
Blood tumor mutational burden and dynamic changes in circulating tumor DNA predict response to pembrolizumab treatment in advanced non-small cell lung cancer.Transl Lung Cancer Res. 2023 May 31;12(5):971-984. doi: 10.21037/tlcr-22-818. Epub 2023 May 9. Transl Lung Cancer Res. 2023. PMID: 37323168 Free PMC article.
-
Integration of comprehensive genomic profiling, tumor mutational burden, and PD-L1 expression to identify novel biomarkers of immunotherapy in non-small cell lung cancer.Cancer Med. 2021 Apr;10(7):2216-2231. doi: 10.1002/cam4.3649. Epub 2021 Mar 2. Cancer Med. 2021. PMID: 33655698 Free PMC article.
-
The Role of Circulating Tumor DNA in Advanced Non-Small Cell Lung Cancer Patients Treated With Immune Checkpoint Inhibitors: A Systematic Review and Meta-Analysis.Front Oncol. 2021 Jul 21;11:671874. doi: 10.3389/fonc.2021.671874. eCollection 2021. Front Oncol. 2021. PMID: 34367957 Free PMC article.
-
Predicting the efficacy of first-line immunotherapy by combining cancer cachexia and tumor burden in advanced non-small cell lung cancer.Thorac Cancer. 2022 Jul;13(14):2064-2074. doi: 10.1111/1759-7714.14529. Epub 2022 Jun 13. Thorac Cancer. 2022. PMID: 35698259 Free PMC article. Review.
Cited by
-
Development of a Mitochondrial Permeability Transition-Driven Necrosis-Related Prognostic Signature in Cervical Cancer: Integrating Bulk Transcriptomic and Single-Cell Data.Cancer Med. 2025 Aug;14(15):e71094. doi: 10.1002/cam4.71094. Cancer Med. 2025. PMID: 40747615 Free PMC article.
-
Decoding the Dynamics of Circulating Tumor DNA in Liquid Biopsies.Cancers (Basel). 2024 Jul 1;16(13):2432. doi: 10.3390/cancers16132432. Cancers (Basel). 2024. PMID: 39001494 Free PMC article. Review.
-
Combination of inflammatory proteins in serum can be used to diagnose papillary thyroid carcinoma with lymph node metastasis.Discov Oncol. 2025 Jan 15;16(1):51. doi: 10.1007/s12672-025-01793-z. Discov Oncol. 2025. PMID: 39812761 Free PMC article.
References
-
- Osmani L., Askin F., Gabrielson E., Li Q.K. Current WHO guidelines and the critical role of immunohistochemical markers in the subclassification of non-small cell lung carcinoma (NSCLC): Moving from targeted therapy to immunotherapy. Semin. Cancer Biol. 2018;52:103–109. doi: 10.1016/j.semcancer.2017.11.019. - DOI - PMC - PubMed
LinkOut - more resources
Full Text Sources
Research Materials
Miscellaneous
