

Adaptation Time as a Determinant of the Dosimetric Effectiveness of Online Adaptive Radiotherapy for Bladder Cancer
- PMID: 38067333
- PMCID: PMC10705074
- DOI: 10.3390/cancers15235629
Adaptation Time as a Determinant of the Dosimetric Effectiveness of Online Adaptive Radiotherapy for Bladder Cancer
Abstract
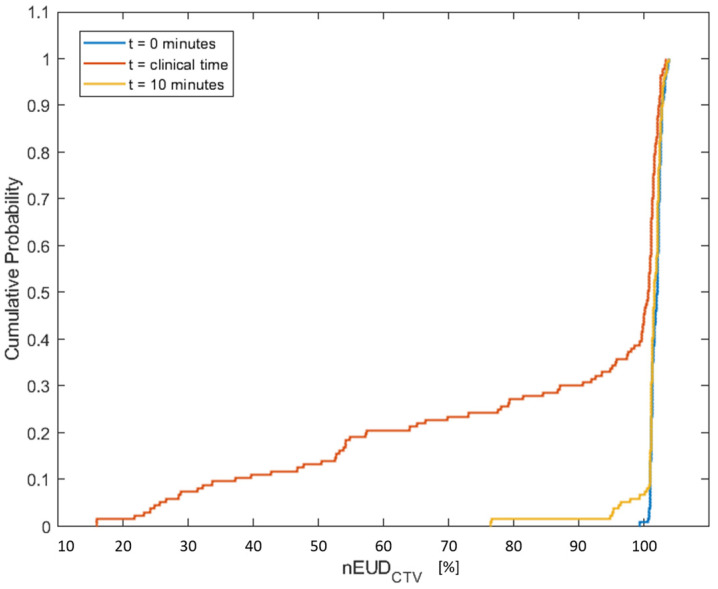
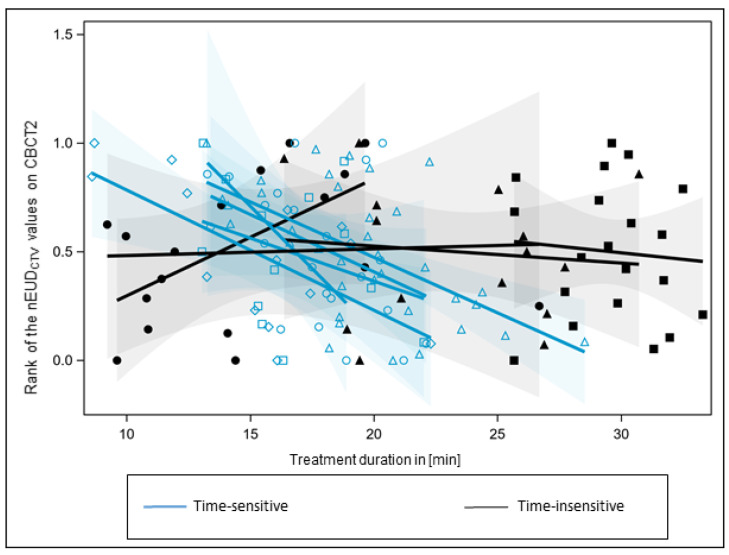
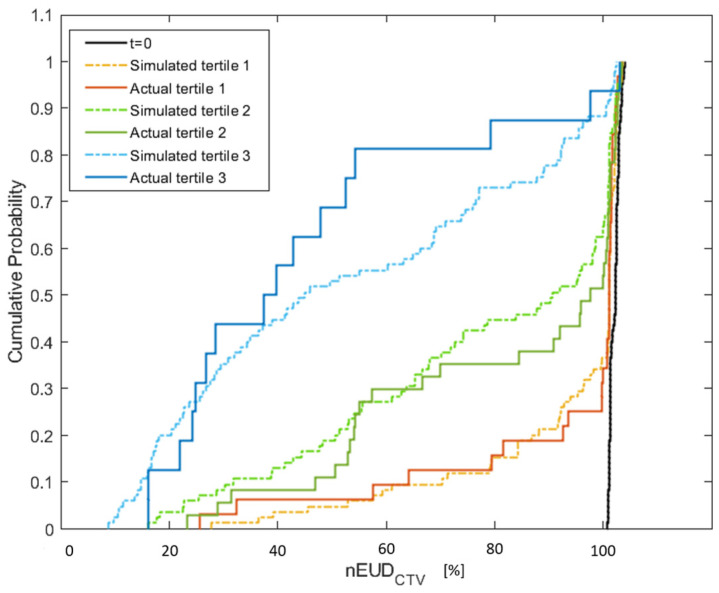
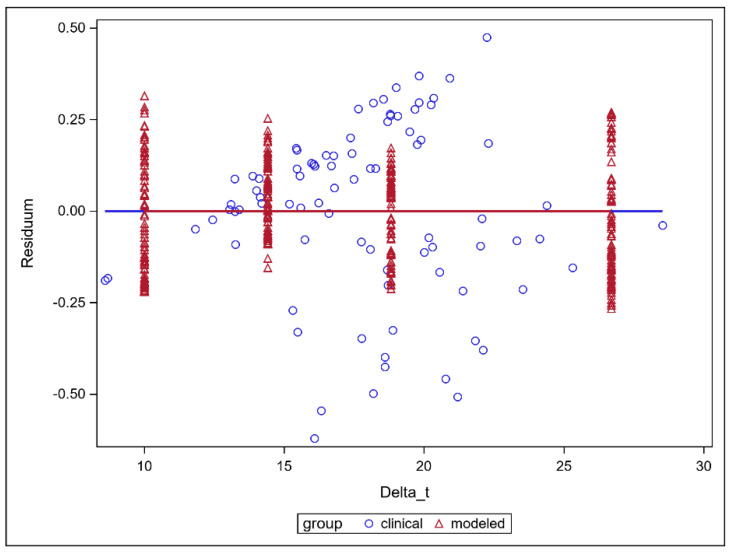
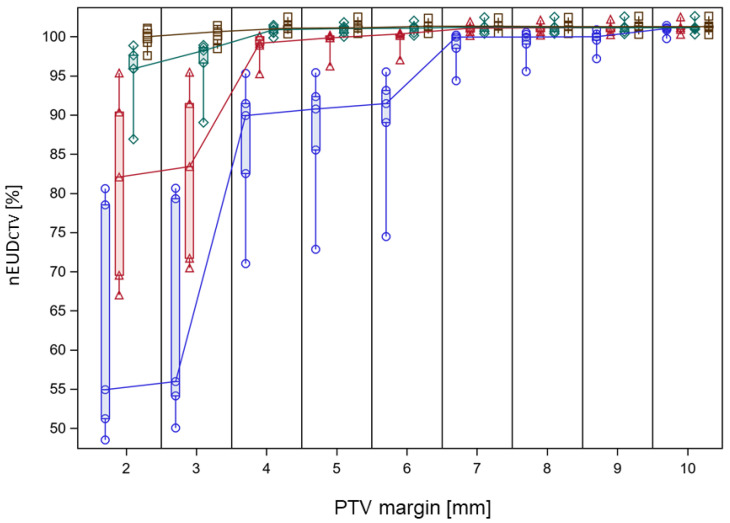
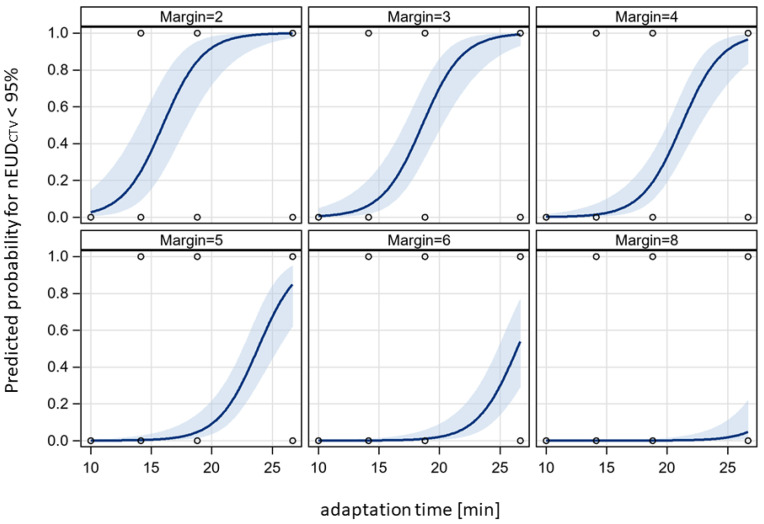
Interfraction anatomic deformations decrease the precision of radiotherapy, which can be improved by online adaptive radiation therapy (oART). However, oART takes time, allowing intrafractional deformations. In this study on focal radiotherapy for bladder cancer, we analyzed the time effect of oART on the equivalent uniform dose in the CTV (EUDCTV) per fraction and for the accumulated dose distribution over a treatment series as measure of effectiveness. A time-dependent digital CTV model was built from deformable image registration (DIR) between pre- and post-adaptation imaging. The model was highly dose fraction-specific. Planning target volume (PTV) margins were varied by shrinking the clinical PTV to obtain the margin-specific CTV. The EUDCTV per fraction decreased by-4.4 ± 0.9% of prescribed dose per min in treatment series with a steeper than average time dependency of EUDCTV. The EUDCTV for DIR-based accumulated dose distributions over a treatment series was significantly dependent on adaptation time and PTV margin (p < 0.0001, Chi2 test for each variable). Increasing adaptation times larger than 10 min by five minutes requires a 1.9 ± 0.24 mm additional margin to maintain EUDCTV for a treatment series. Adaptation time is an important determinant of the precision of oART for one half of the bladder cancer patients, and it should be aimed at to be minimized.
Keywords: bladder cancer; bladder deformation; intrafractional motion; online adaptive radiotherapy.
Conflict of interest statement
The authors declare no conflict of interest.
Figures
Similar articles
-
Fractionation versus Adaptation for Compensation of Target Volume Changes during Online Adaptive Radiotherapy for Bladder Cancer: Answers from a Prospective Registry.Cancers (Basel). 2023 Oct 11;15(20):4933. doi: 10.3390/cancers15204933. Cancers (Basel). 2023. PMID: 37894299 Free PMC article.
-
Prospects for online adaptive radiation therapy (ART) for head and neck cancer.Radiat Oncol. 2024 Jan 8;19(1):4. doi: 10.1186/s13014-023-02390-6. Radiat Oncol. 2024. PMID: 38191400 Free PMC article.
-
Online Adaptive Radiotherapy for Planning Target Volume (PTV) Reduction in Gastric Mucosa-Associated Lymphoid Tissue (MALT) Lymphoma.Cureus. 2024 Sep 8;16(9):e68919. doi: 10.7759/cureus.68919. eCollection 2024 Sep. Cureus. 2024. PMID: 39381477 Free PMC article.
-
CTV-to-PTV margin assessment for esophageal cancer radiotherapy based on an accumulated dose analysis.Radiother Oncol. 2021 Aug;161:16-22. doi: 10.1016/j.radonc.2021.05.005. Epub 2021 May 14. Radiother Oncol. 2021. PMID: 33992628
-
Reduction of the planning target volume with daily online adaptive radiotherapy in bladder cancer.Strahlenther Onkol. 2025 Apr 15. doi: 10.1007/s00066-025-02397-w. Online ahead of print. Strahlenther Onkol. 2025. PMID: 40232382
Cited by
-
Minimizing human interference in an online fully automated daily adaptive radiotherapy workflow for bladder cancer.Radiat Oncol. 2024 Oct 7;19(1):138. doi: 10.1186/s13014-024-02526-2. Radiat Oncol. 2024. PMID: 39375787 Free PMC article.
-
Clinical implementation of RTT-only CBCT-guided online adaptive focal radiotherapy for bladder cancer.Clin Transl Radiat Oncol. 2024 Nov 2;50:100884. doi: 10.1016/j.ctro.2024.100884. eCollection 2025 Jan. Clin Transl Radiat Oncol. 2024. PMID: 39559697 Free PMC article.
-
Quantification and dosimetric impact of intra-fractional bladder changes during CBCT-guided online adaptive radiotherapy for pelvic cancer treatments.J Appl Clin Med Phys. 2025 Jun;26(6):e70074. doi: 10.1002/acm2.70074. Epub 2025 Mar 21. J Appl Clin Med Phys. 2025. PMID: 40114528 Free PMC article.
References
-
- Foroudi F., Wong J., Haworth A., Baille A., McAlpine J., Rolfo A., Kron T., Roxby P., Paneghel A., Williams S., et al. Offline adaptive radiotherapy for bladder cancer using cone beam computed tomography. J. Med. Imaging Radiat. Oncol. 2009;53:226–233. doi: 10.1111/j.1754-9485.2009.02066.x. - DOI - PubMed
-
- El-Bared N., Portelance L., Spieler B.O., Kwon D., Padgett K.R., Brown K.M., Mellon E.A. Dosimetric Benefits and Practical Pitfalls of Daily Online Adaptive MRI-Guided Stereotactic Radiation Therapy for Pancreatic Cancer. Pract. Radiat. Oncol. 2019;9:e46–e54. doi: 10.1016/j.prro.2018.08.010. - DOI - PubMed
LinkOut - more resources
Full Text Sources
