. 2023 Nov 29;15(23):5645.
doi: 10.3390/cancers15235645.

Efficient Radial-Shell Model for 3D Tumor Spheroid Dynamics with Radiotherapy

Affiliations

Efficient Radial-Shell Model for 3D Tumor Spheroid Dynamics with Radiotherapy

Florian Franke et al. Cancers (Basel). .

Abstract

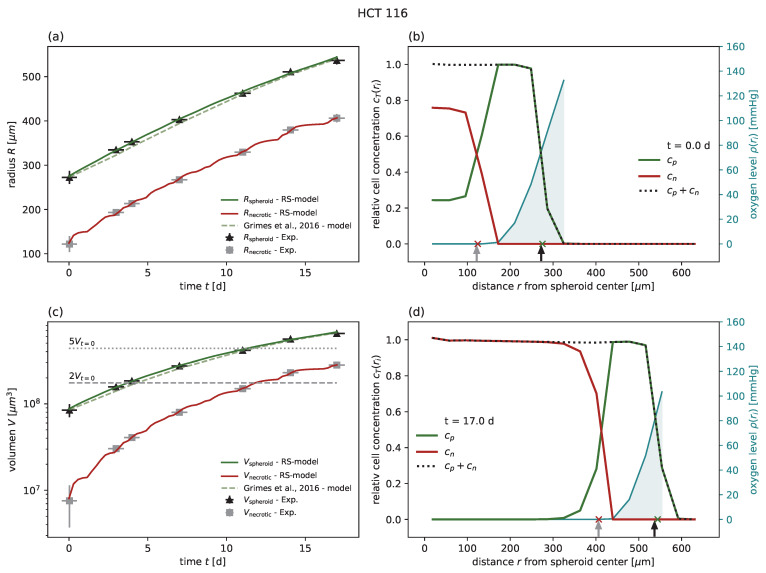
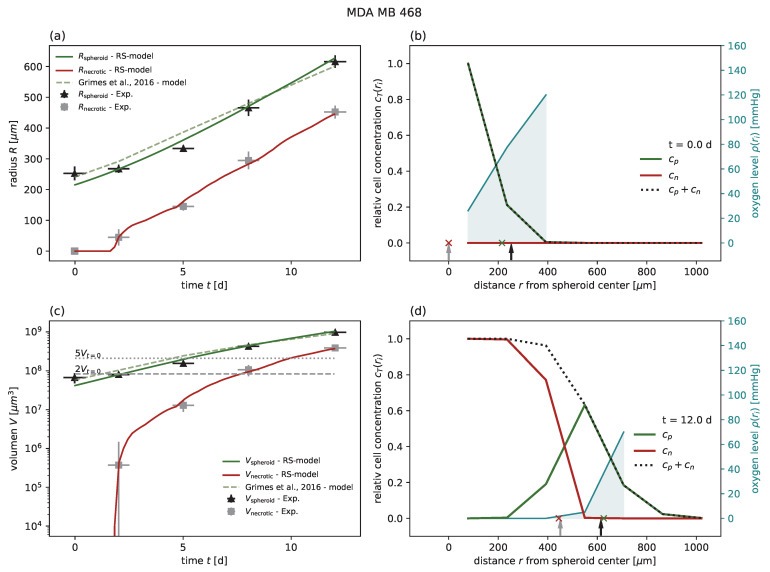
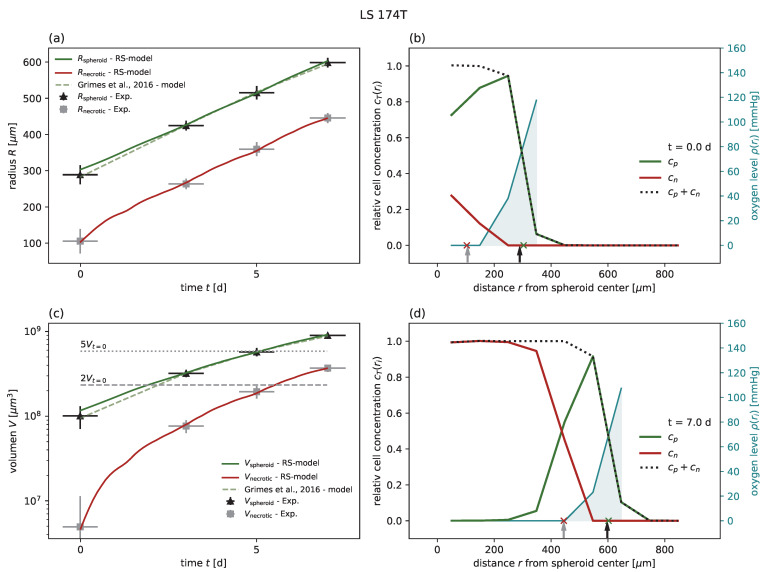
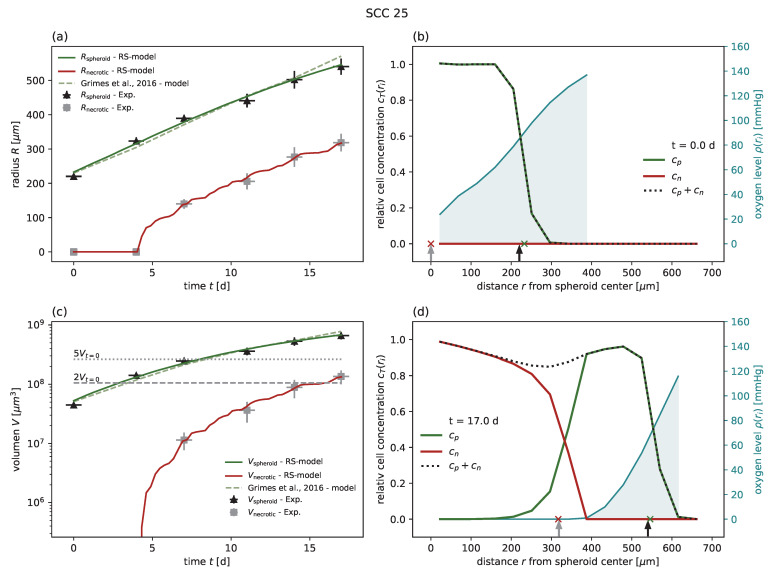
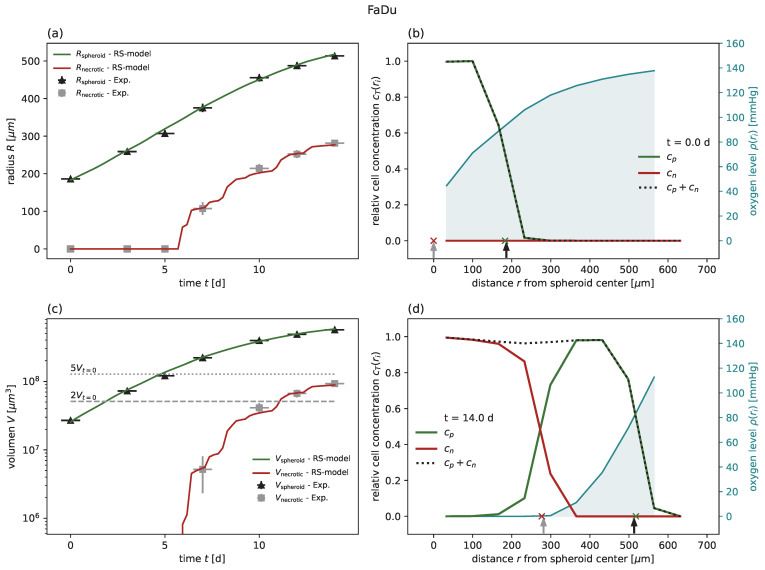
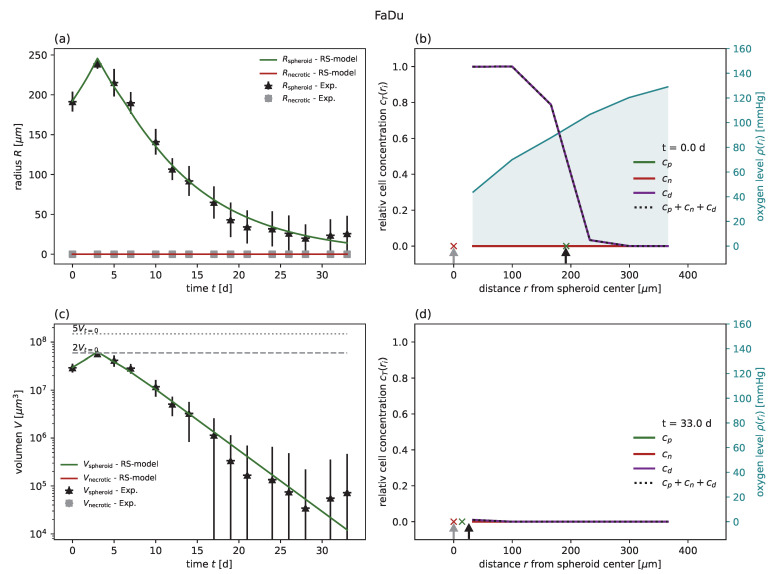
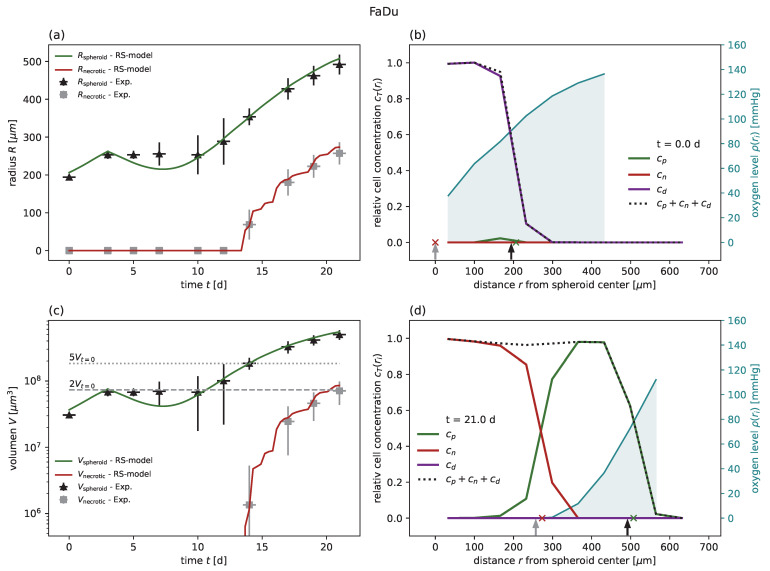
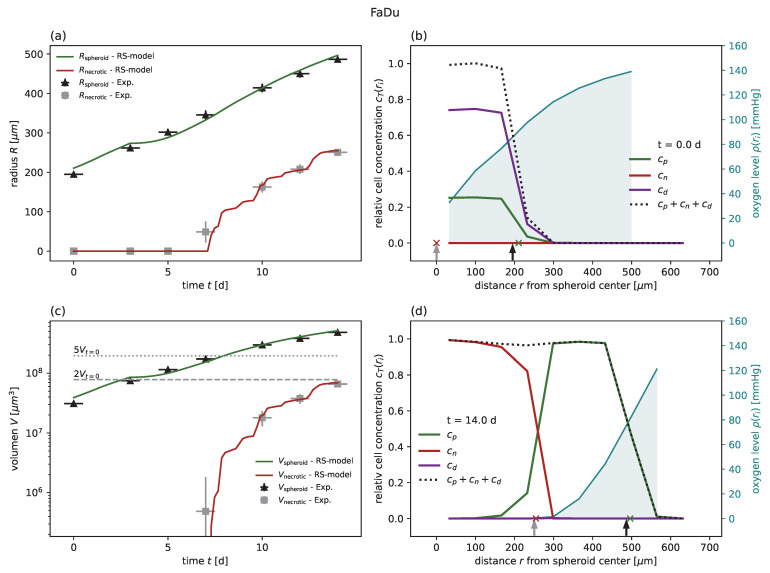
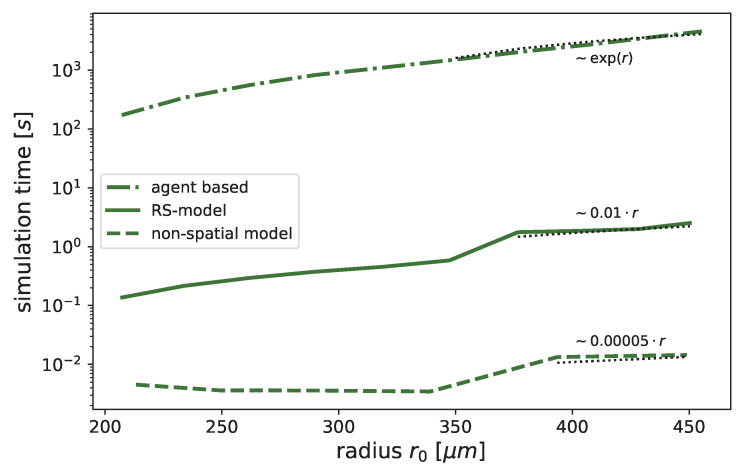
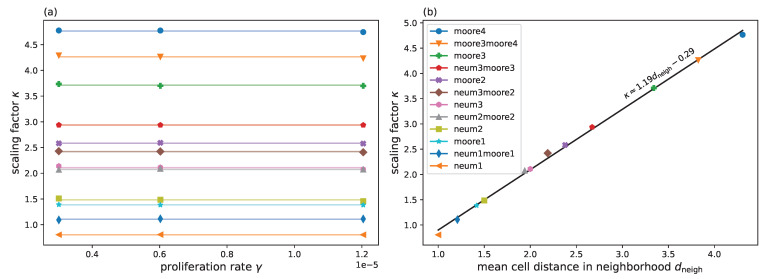
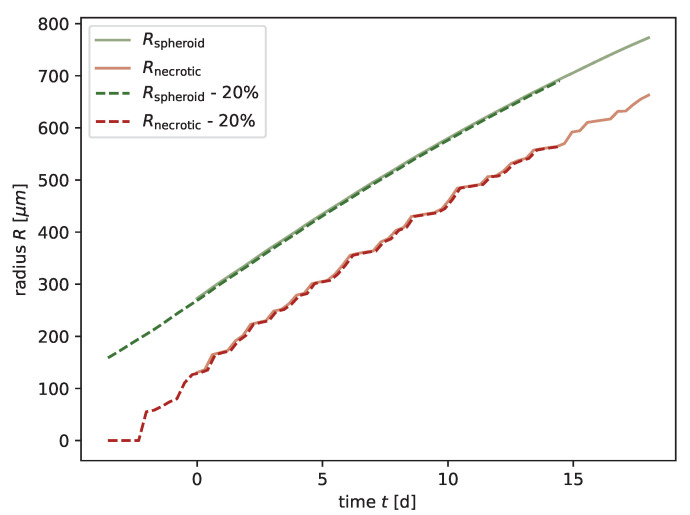
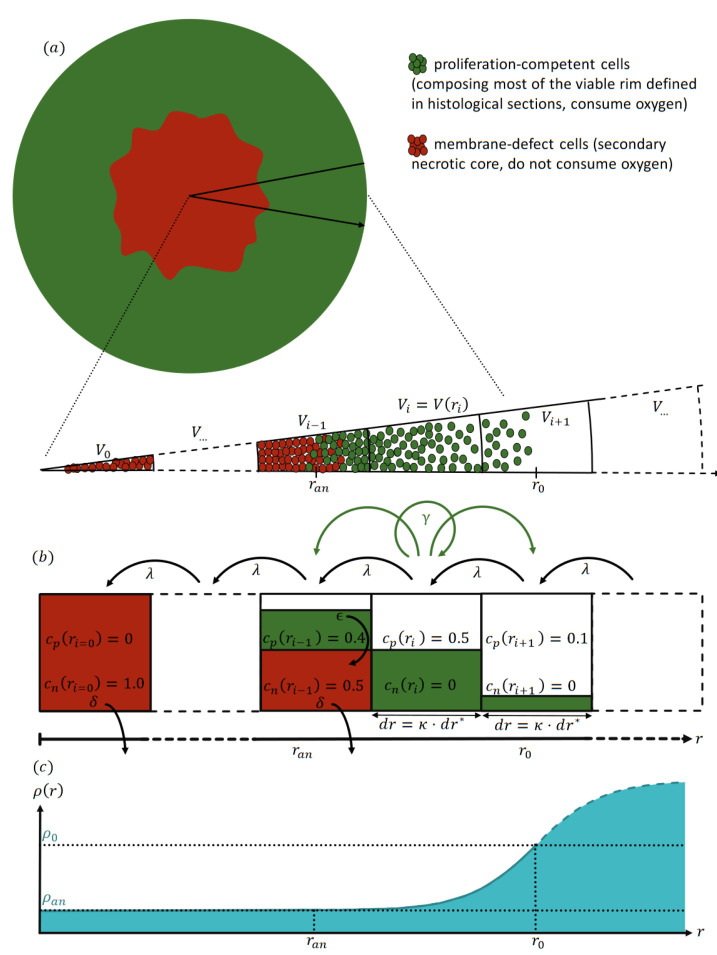
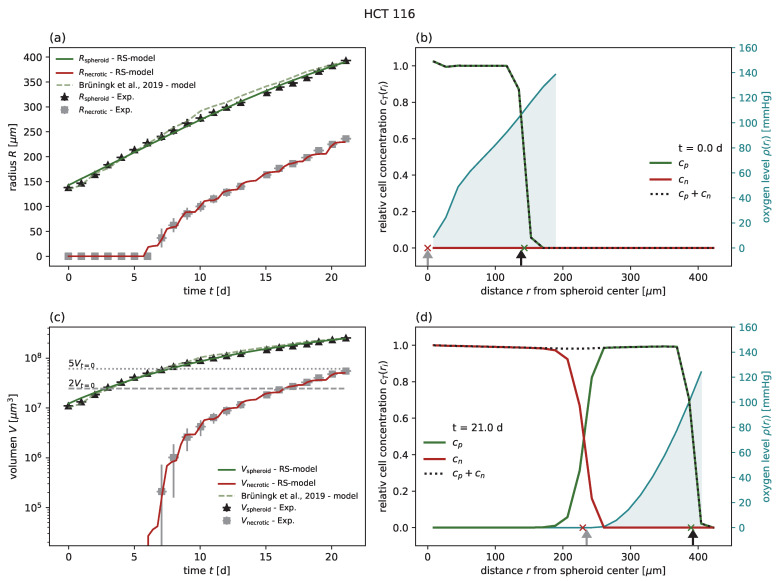
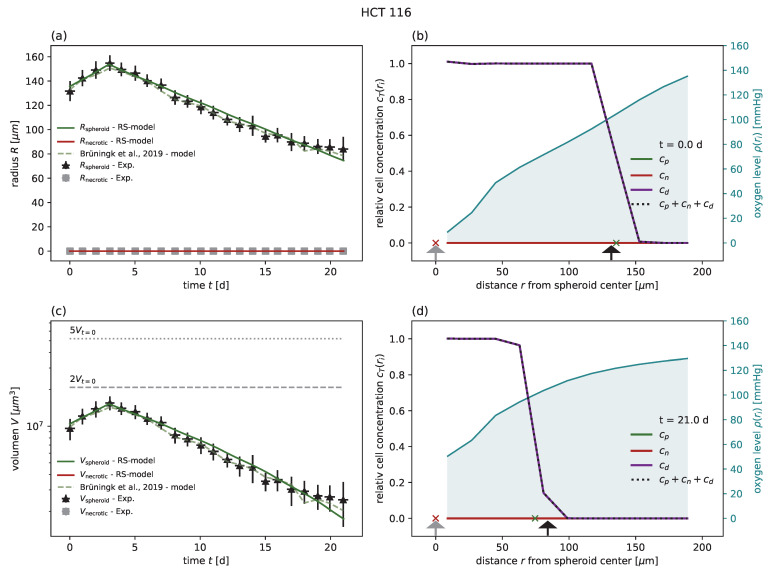
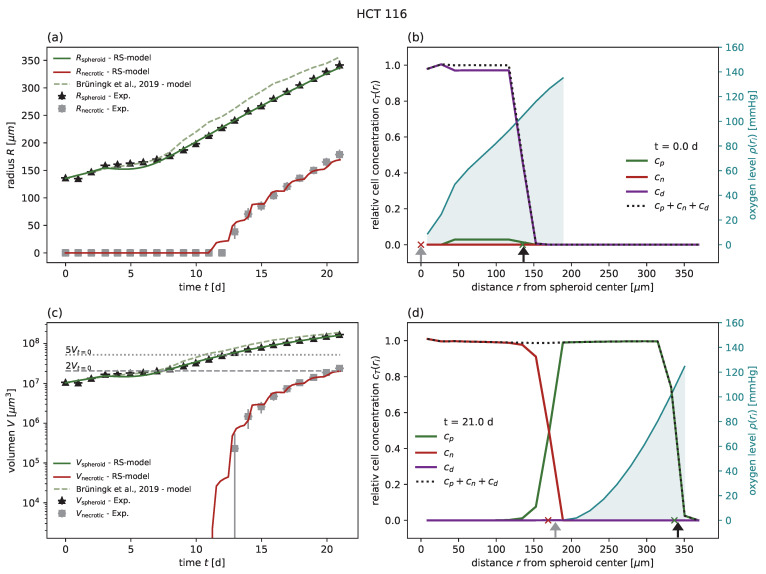
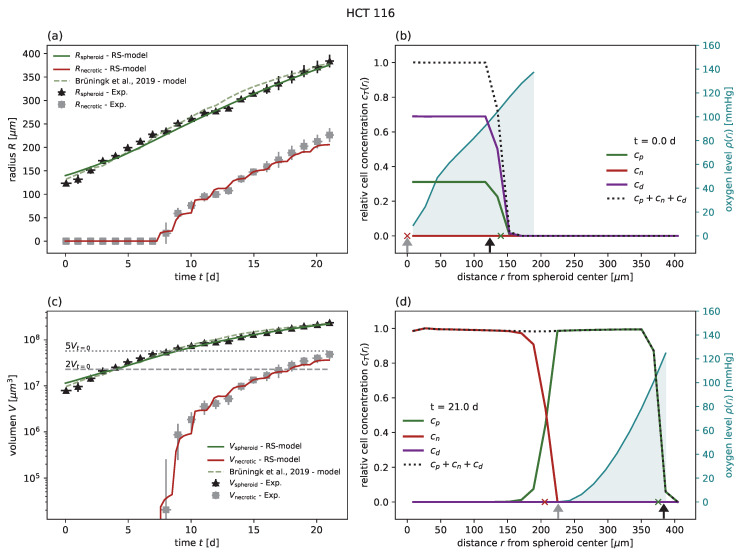
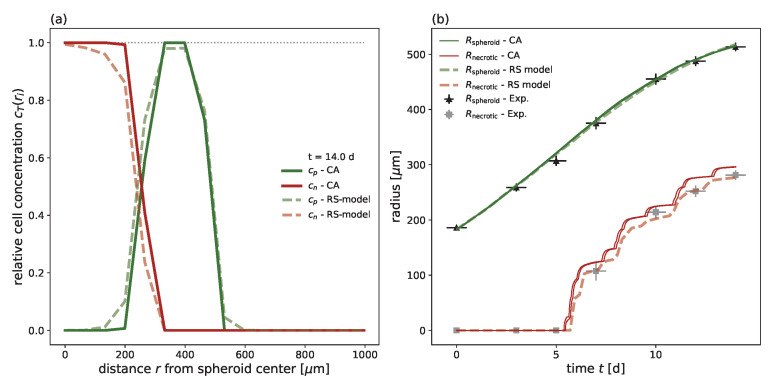
Understanding the complex dynamics of tumor growth to develop more efficient therapeutic strategies is one of the most challenging problems in biomedicine. Three-dimensional (3D) tumor spheroids, reflecting avascular microregions within a tumor, are an advanced in vitro model system to assess the curative effect of combinatorial radio(chemo)therapy. Tumor spheroids exhibit particular crucial pathophysiological characteristics such as a radial oxygen gradient that critically affect the sensitivity of the malignant cell population to treatment. However, spheroid experiments remain laborious, and determining long-term radio(chemo)therapy outcomes is challenging. Mathematical models of spheroid dynamics have the potential to enhance the informative value of experimental data, and can support study design; however, they typically face one of two limitations: while non-spatial models are computationally cheap, they lack the spatial resolution to predict oxygen-dependent radioresponse, whereas models that describe spatial cell dynamics are computationally expensive and often heavily parameterized, impeding the required calibration to experimental data. Here, we present an effectively one-dimensional mathematical model based on the cell dynamics within and across radial spheres which fully incorporates the 3D dynamics of tumor spheroids by exploiting their approximate rotational symmetry. We demonstrate that this radial-shell (RS) model reproduces experimental spheroid growth curves of several cell lines with and without radiotherapy, showing equal or better performance than published models such as 3D agent-based models. Notably, the RS model is sufficiently efficient to enable multi-parametric optimization within previously reported and/or physiologically reasonable ranges based on experimental data. Analysis of the model reveals that the characteristic change of dynamics observed in experiments at small spheroid volume originates from the spatial scale of cell interactions. Based on the calibrated parameters, we predict the spheroid volumes at which this behavior should be observable. Finally, we demonstrate how the generic parameterization of the model allows direct parameter transfer to 3D agent-based models.

Keywords: 3D growth; cellular automaton; growth curve; minimal model; radial shell model; radiation therapy; simulation; spatio-temporal mathematical modelling; spheroids; systems biology; tumor relapse.


Conflict of interest statement

The authors declare no conflict of interest.

Figures

Figure A1
Figure A1
(a) The RS model reproduces the outer radius (dark green) for untreated growth of the cell line HCT-116, with experimental data from Grimes et al. [24] (black crosses) even better than the model proposed along with the data (light green dashed). Note that the necrotic radius during the experiment can be estimated (gray crosses; see main text Section 3 for details) and that the RS model additionally reproduces this necrotic radius (red). (c) Volumes corresponding to the radii displayed in (a) in a semi-log plot. Multiples of 2 and 5 of the starting volume Vt=0 are highlighted with horizontal gray dashed and gray dotted lines, respectively. Additionally, the RS model predicts the cell concentration over the radius at any time point. Examples show the cell distribution for (b) the first time point t=0 d and (d) the last day t=17 d of the experiment. Displayed are the cell concentrations of proliferation-competent cells cp (green solid) and membrane-defect cells cn (red solid), the total concentration of cells (black dotted), and the oxygen profile (blue solid, right y axis). The marker at the bottom of the panels (b,c) indicates the necrotic and outer radius estimated from the model (red and green crosses) and from the actual experimental data (gray and black arrows), respectively. The used parameters are reported in Table 1.
Figure A2
Figure A2
(a) The RS model reproduces the outer radius (dark green) for untreated growth of the cell line MDA-MB-468, with experimental data from Grimes et al. [24] (black crosses) even better than the model proposed along with the data (light green dashed). Note that the necrotic radius during the experiment can be estimated (gray crosses; see main text Section 3 for details) and that the RS model additionally reproduces this necrotic radius (red). (c) Volumes corresponding to the radii displayed in (a) in a semi-log plot. Multiples of 2 and 5 of the starting volume Vt=0 are highlighted with horizontal gray dashed and gray dotted lines, respectively. Additionally, the RS model predicts the cell concentration over the radius at any time point. Examples show the cell distribution for (b) the first time point t=0 d and (d) the last day t=12 d of the experiment. Displayed are the cell concentrations of proliferation-competent cells cp (green solid) and membrane-defect cells cn (red solid), the total concentration of cells (black dotted), and the oxygen profile (blue solid, right y axis). The marker at the bottom of the panels (b,c) indicates the necrotic and outer radius estimated from the model (red and green crosses) and from the actual experimental data (gray and black arrows), respectively. The used parameters are reported in Table 1.
Figure A3
Figure A3
The RS model reproduces the outer radius (dark green) for untreated growth of the cell line LS-174T, with experimental data from Grimes et al. [24] (black crosses) even better than the model proposed along with the data (light green dashed). Note that the necrotic radius during the experiment can be estimated (gray crosses; see main text Section 3 for details) and that the RS model additionally reproduces this necrotic radius (red). (c) Volumes corresponding to the radii displayed in (a) in a semi-log plot. Multiples of 2 and 5 of the starting volume Vt=0 are highlighted with horizontal gray dashed and gray dotted lines, respectively. Additionally, the RS model predicts the cell concentration over the radius at any time point. Examples show the cell distribution for (b) the first time point t=0 d and (d) the last day t=7 d of the experiment. Displayed are the cell concentrations of proliferation-competent cells cp (green solid) ans membrane-defect cells cn (red solid), the total concentration of cells (black dotted), and the oxygen profile (blue solid, right y axis). The marker at the bottom of the panels (b,c) indicates the necrotic and outer radius estimated from the model (red and green crosses) and from the actual experimental data (gray and black arrows), respectively. The used parameters are reported in Table 1.
Figure A4
Figure A4
The RS model reproduces the outer radius (dark green) for untreated growth of the cell line SCC-25, with experimental data from Grimes et al. [24] (black crosses) even better than the model proposed along with the data (light green dashed). Note that the necrotic radius during the experiment can be estimated (gray crosses; see main text Section 3 for details) and that the RS model additionally reproduces this necrotic radius (red). (c) Volumes corresponding to the radii displayed in (a) in a semi-log plot. Multiples of 2 and 5 of the starting volume Vt=0 are highlighted with horizontal gray dashed and gray dotted lines, respectively. Additionally, the RS model predicts the cell concentration over the radius at any time point. Examples show the cell distribution for (b) the first time point t=0 d and (d) the last day t=17 d of the experiment. Displayed are the cell concentrations of proliferation-competent cells cp (green solid) and membrane-defect cells cn (red solid), the total concentration of cells (black dotted), and the oxygen profile (blue solid, right y axis). The marker at the bottom of the panels (b,c) indicates the necrotic and outer radius estimated from the model (red and green crosses) and from the actual experimental data (gray and black arrows), respectively. The used parameters are reported in Table 1.
Figure A5
Figure A5
The RS model reproduces the outer radius (dark green) for untreated growth of the FaDu cell line, with experimental data from Chen et al. [18] (black crosses). Note that the necrotic radius during the experiment can be estimated (gray crosses; see main text Section 3 for details) and that the RS model additionally reproduces this necrotic radius (red). (c) Volumes corresponding to the radii displayed in (a) in a semi-log plot. Multiples of 2 and 5 of the starting volume Vt=0 are highlighted with horizontal gray dashed and gray dotted lines, respectively. Additionally, the RS model predicts the cell concentration over the radius at any time point. Examples show the cell distribution for (b) the first time point t=0 d and (d) the last day t=14 d of the experiment. Displayed are the cell concentrations of proliferation-competent cells cp (green solid) and membrane-defect cells cn (red solid), the total concentration of cells (black dotted), and the oxygen profile (blue solid, right y axis). The marker at the bottom of the panels (b,c) indicates the necrotic and outer radius estimated from the model (red and green crosses) and from the actual experimental data (gray and black arrows), respectively. The used parameters are reported in Table 1.
Figure A6
Figure A6
(a) The RS model reproduces the outer radius (dark green) for the FaDu cell line with 20 Gy radiation, experimental data from Chen et al. [18] (black crosses) as effectively as the model proposed along with the data (light green dashed). We used the parameters calibrated for untreated growth, only fitted the probabilities of mitotic catastrophe Pmc1, Pmc2, and adopted the radiosensitivities αRT and βRT from the ranges observed in Chen et al. [17] and Xu et al. [59]. Note that no necrotic core is expected for this regime (experimental estimate shown as gray crosses), which is reproduced by the RS model (red). The used parameters can be found in Table 1 and Table 2. (c) Volumes corresponding to the radii are displayed in (a) in a semi-log plot. Multiples of 2 and 5 of the starting volume Vt=0 are highlighted with horizontal gray dashed and gray dotted lines, respectively. Additionally, the RS model predicts the cell concentration over the radius at any time point. Examples show the cell distribution for (b) the first time point t=0 d and (d) the last day t=33 d of the experiment. Displayed are the cell concentrations of proliferation competent cells cp (green solid) and membrane-defect cells cn (red solid), the total concentration of cells (black dotted), and the oxygen profile (blue solid, right y axis). The marker at the bottom of the panels (b,c) indicates the necrotic and outer radius estimated from the model (red and green crosses) and from the actual experimental data (gray and black arrows), respectively.
Figure A7
Figure A7
(a) The RS model reproduces the outer radius (dark green) for the FaDu cell line with 5 Gy radiation, experimental data from Chen et al. [18] (black crosses). We used the parameters calibrated for untreated growth, the values for Pmc1 and Pmc2 fitted at 20 Gy, and adopted the radiosensitivities αRT and βRT from the ranges observed in Chen et al. [17] and Xu et al. [59]. Note that no necrotic core is expected for this regime (experimental estimate shown as gray crosses), which is reproduced by the RS model (red). The used parameters can be found in Table 1 and Table 2. (c) Volumes corresponding to the radii are displayed in (a) in a semi-log plot. Multiples of 2 and 5 of the starting volume Vt=0 are highlighted with horizontal gray dashed and gray dotted lines, respectively. Additionally, the RS model predicts the cell concentration over the radius at any time point. Examples show the cell distribution for (b) the first time point t=0 d and (d) the last day t=21 d of the experiment. Displayed are the cell concentrations of proliferation competent cells cp (green solid) and membrane-defect cells cn (red solid), the total concentration of cells (black dotted), and the oxygen profile (blue solid, right y axis). The marker at the bottom of the panels (b,c) indicates the necrotic and outer radius estimated from the model (red and green crosses) and from the actual experimental data (gray and black arrows), respectively.
Figure A8
Figure A8
(a) The RS model reproduces the outer radius (dark green) for the FaDu cell line, with 2.5 Gy radiation experimental data from Chen et al. [18] (black crosses). We used the parameters calibrated for untreated growth, the values Pmc1 and Pmc2 fitted at 20 Gy, and adopted the radiosensitivities αRT and βRT from the ranges observed in Chen et al. [17] and Xu et al. [59]. The necrotic radius of the experiments can be estimated (gray crosses; see Section 3 for details). The RS model can predict the necrotic radius (red) in a good manner. Note that the necrotic radius of the RS model appears jagged due to the spatial discretization of r0. The used parameters can be found in Table 1 and Table 2. (c) Shows the same data plotted for the volume in a semi-log plot. Multiples of 2 and 5 of the starting volume Vt=0 are highlighted with horizontal gray dashed and gray dotted lines, respectively. Additionally, the RS model predicts the cell concentration over the radius at any time point. Examples show the cell distribution for (b) the first time point t=0 d and (d) the last day t=14 d of the experiment. Displayed are the cell concentrations of proliferation competent cells cp (green solid) and membrane-defect cells cn (red solid), the total concentration of cells (black dotted), and the oxygen profile (blue solid, right y axis). The marker at the bottom of the panels (b,c) indicates the necrotic and outer radius estimated from the model (red and green crosses) and from the actual experimental data (gray and black arrows), respectively.
Figure A9
Figure A9
The oxygen profile estimated with the hybrid analytical approach (solid blue) is similar to the previously published method of Grimes et al. [24] (solid black), which assumes hard spheres for the spheroid and its necrotic core. Shown here is a cell concentration for proliferation-competent cells (solid green), membrane-defect cells (solid red), and their sum (dotted black), with the parameter fitted for the FaDu cell line.
Figure A10
Figure A10
Using bisection, the anoxic radius ran for the oxygen profile is determined by requiring the minima of the oxygen profile ρ*(r) to be at ran, with ρ*(ran)=ρan. (a) Example cell concentration of oxygen consuming proliferation-competent cells cp (solid dark green) with corresponding oxygen profiles for different anoxic radii ran (dashed lines). We used the parameters calibrated for FaDu. (b) Magnification of the black box in (a) around the minima of the oxygen profiles. The solid vertical lines in corresponding colors highlight the anoxic radius ran for each oxygen profile. The correct radius determined by bisection is shown in red.
Figure A11
Figure A11
The outer radius Rspheroid of the RS model agrees with the analytical predictions. We used the parameter fitted for the FaDu cell line and a radiation dose of 20 Gy. Certain parameters were altered to make the characteristics of the spheroid dynamics more pronounced: the initial volume is lower and the probability for a mitotic catastrophe Pmc changes after t=25 d from Pmc1=0 to Pmc2=0.87. From the analytical derivation, a linear scaling (black dashed lines) for larger and an exponential scaling (black dotted lines) for smaller radii is expected; (a,b) display the same results in the linear and semi-log-y scales, respectively. The gray area marks the predicted transition region between the linear and exponential regimes drRspheroid3·dr.
Figure A12
Figure A12
The dynamics resulting from different choices of γ and dr can only be discriminated at small Rspheroid<150 µm, where the transition between the linear and exponential regimes is observable. As an example, three choices of parameter sets with the same product γdr (same slope in the linear regime) are displayed for the FaDu cell line with 20 Gy irradiation (the solid line corresponds to parameters in Figure A6). The time ln(2)/γ is varied in the fitting range used for the calibration of the RS model (20 h dashed line and 40 h dotted line).
Figure A13
Figure A13
The RS model is feasibly fast for parameter fitting. Shown here is a comparison of the simulation time needed to reach a specific outer radius Rspheroid for three model types: cell-based (3D cellular automaton), shown by the point-dashed line, the RS model, shown by a solid line, and the non-spatial model from [24], shown by a dashed line. The cell-based model scales exponentially, while the other two models scale linearly. Linear and exponential fits are respectively highlighted by black dotted lines.
Figure A14
Figure A14
The shell size κ of the RS model can be related to the individual neighborhood condition of a 3D cellular automaton. (a) The correlation is independent of the chosen proliferation rate γ for the range of experimentally expected values. Note that the variance for each fit of κ was smaller than the shown symbols. (b) It is possible to find a linear correlation between the shell size κ and the mean distance at which a cell can be placed from its mother cell in a certain neighborhood condition in the 3D cellular automaton. Note that neum1moor1 refers to a random choice between these two neighborhoods for each proliferation event. The mean radius of Rspheroid of 5 simulations of the 3D cellular automaton where used to fit the κ of the RS model. The fitted parameters of the FaDu cell line were used. Only ϵ and δ were set to 0 in order to single out the effect of proliferation. Additionally, the starting volume was multiplied by 2.5 to increase visibility.
Figure A15
Figure A15
The simulation result is independent of the starting condition. We compared two different starting cell concentrations for the radial-shell model. The brighter colors (solid) are from the simulation where the starting condition was set as described in Appendix J and used in all other simulations of the manuscript. The darker colored lines (dashed) are from a simulation in which the initial cell concentration was set with a relatively steep sigmoid function for 20% of the starting volume. The same parameters were used for both simulations.
Figure 1
Figure 1
Illustration of the radial-shell model (RS-model). (a) Sketch of a typical stained histological section of a spheroid with a viable rim (green) surrounding a secondary necrotic core, with cell debris membrane-defect cells (red) suggesting an approximate rotational symmetry of the spheroid. (b) By exploiting the symmetry, the model is able to consider the cell dynamics on radial shells i[0,1,2,...) and along the distance r from the center of the spheroid at i=0. The shells have equal radial width dr, and their maximal volume Vi is consequently increasing outwards. Each shell i holds a concentration of cells cT(ri) of type T cells, where T=p denotes proliferation-competent cells (green, proliferate with maximal rate γ, consume oxygen with rate a) and T=n membrane-defect cells (red, irreversibly lost competence to proliferate, do not consume oxygen). Note that the concentrations cT[0,1] are normalized according to the available space in each shell. (c) Oxygen consumption of proliferation-competent cells leads to a radial decrease of oxygen pressure from the value ρ0 at the most outer shell at r0 down to an anoxic threshold ρan at ran towards the center of the spheroid. Beyond the threshold ρan, cells are anoxic and become membrane-defect with the anoxic death rate ϵ. The volume occupied by membrane-defect cells is reduced with rate δ and all cells are transported inward with rate λ such that the spheroid remains compact. Then, the outer radius Rspheroid and necrotic radius Rnecrotic are defined as the radius of a sphere with a volume equal to the total cell volume and membrane-defect cell volume, respectively. For reference, the shell width dr=κdr* is expressed as multiple κ of a single cell diameter dr*.
Figure 2
Figure 2
(a) The RS model reproduces the outer radius (dark green) for untreated growth of the cell line HCT-116, with experimental data from Brüningk et al. [1] (black crosses) even better than the model proposed along with the data (light green dashed). Note that the necrotic radius during the experiment can be estimated (gray crosses; see Section 3 for details) and that the RS model additionally reproduces this necrotic radius (red). (c) Volumes corresponding to the radii displayed in (a) in a semi-log plot. Multiples of 2 and 5 of the starting volume Vt=0 are highlighted with horizontal gray dashed and gray dotted lines, respectively. The RS model predicts the cell concentration over the radius at any time point. Examples show the cell distributions for (b) the first time point t=0 d and (d) the last day t=21 d of the experiment. Displayed are the cell concentrations of proliferation-competent cells cp (green solid), membrane-defect cells cn (red solid), total concentration of cells (black dotted), and oxygen profile (blue solid, right y axis). The marker at the bottom of the panels (b,c) indicates the necrotic and outer radius estimated from the model (red and green crosses) and from the actual experimental data (gray and black arrows), respectively. The used parameters are reported in Table 1.
Figure 3
Figure 3
(a) The RS model reproduces the outer radius (dark green) for the cell line HCT-116 with 10 Gy radiation experimental data from Brüningk et al. [1] (black crosses) as effectively as the model proposed along with the data (light green dashed). We used the parameters calibrated for untreated growth, only fitted the probabilities of mitotic catastrophe Pmc1, Pmc2, and adopted the radiosensitivities αRT and βRT from Brüningk et al. [1]. Note that for this regime no secondary necrotic core is expected (experimental estimate shown as gray crosses), which is reproduced by the RS model (red). The parameters we used can be found in Table 1 and Table 2. (c) Volumes corresponding to the radii displayed in (a) in a semi-log plot. Multiples of 2 and 5 of the starting volume Vt=0 are highlighted with horizontal gray dashed and gray dotted lines, respectively. The RS model predicts the cell concentration over the radius at any time point. Examples show the cell distribution for (b) the first time point t=0 d and (d) the last day t=21 d of the experiment. Displayed are the cell concentrations of proliferation-competent cells cp (green solid) and membrane-defect cells cn (red solid), the total concentration of cells (black dotted), and the oxygen profile (blue solid, right y axis). The marker at the bottom of the panels (b,c) indicates the necrotic and outer radius estimated from the model (red and green crosses) and from the actual experimental data (gray and black arrows), respectively.
Figure 4
Figure 4
(a) The RS model reproduces the outer radius (dark green) for the cell line HCT-116, with 5 Gy radiation experimental data from Brüningk et al. [1] (black crosses) even better than the model proposed along with the data (light green dashed). We used the parameters calibrated for untreated growth, the values for Pmc1 and Pmc2 fitted at 10 Gy, and the values αRT and βRT from Brüningk et al. [1]. Note that the necrotic radius during the experiment can be estimated (gray crosses) (see Section 3 for details) and that the RS model reproduces this necrotic radius (red). Additionally, note that the necrotic radius of the RS model appears jagged due to the spatial discretization of r0. The used parameters are reported in Table 1 and Table 2. (c) Volumes corresponding to the radii displayed in (a) in a semi-log plot. Multiples of 2 and 5 of the starting volume Vt=0 are highlighted with horizontal gray dashed and gray dotted lines, respectively. The RS model predicts the cell concentration over the radius at any time point. Examples show the cell distribution for (b) the first time point t=0 d and (d) the last day t=21 d of the experiment. Displayed are the cell concentrations of proliferation-competent cells cp (green solid) and membrane-defect cells cn (red solid), the total concentration of cells (black dotted), and the oxygen profile (blue solid, right y axis). The marker at the bottom of the panels (b,c) indicates the necrotic and outer radius estimated from the model (red and green crosses) and from the actual experimental data (gray and black arrows), respectively.
Figure 5
Figure 5
(a) The RS model reproduces the outer radius (dark green) for the cell line HCT-116, with 2 Gy radiation experimental data from Brüningk et al. [1] (black crosses) as effectively as the model proposed along with the data (light green dashed). We used the parameters calibrated for untreated growth, the values for Pmc1 and Pmc2, and the model proposed along with the data (light green dashed) at 10 Gy, as well as the values αRT and βRT from Brüningk et al. [1]. The necrotic radius during the experiment can be estimated (gray crosses) (see Section 3 for details) and the RS model reproduces this necrotic radius (red). Note that the necrotic radius of the RS model appears jagged due to the spatial discretization of r0. The used parameters can be found in Table 1 and Table 2. (c) Volumes corresponding to the radii displayed in (a) in a semi-log plot. Multiples of 2 and 5 of the starting volume Vt=0 are highlighted with horizontal gray dashed and gray dotted lines, respectively. Additionally, the RS model predicts the cell concentration over the radius at any time point. Examples show the cell distribution for (b) the first time point t=0 d and (d) the last day t=21 d of the experiment. Displayed are the cell concentrations of proliferation-competent cells cp (green solid) and membrane-defect cells cn (red solid), the total concentration of cells (black dotted), and the oxygen profile (blue solid, right y axis). The marker at the bottom of the panels (b,c) indicates the necrotic and outer radius estimated from the model (red and green crosses) and from the actual experimental data (gray and black arrows), respectively. The used parameters are reported in Table 1.
Figure 6
Figure 6
The cellular automaton reproduces the experimental growth curve for the FaDu cell line after parameter transfer from the previously fitted RS model. We directly transferred the parameters of the RS model to the cellular automaton using a 50:50 alteration between the 3-Moore and 4-Moore neighborhoods to achieve a value of κ=4.26. (a) Cell concentration over the radius at t=14 d for the 3D cellular automaton; the mean cell concentrations (solid) from ten independent simulation runs are compared with the cell concentrations of the corresponding RS model (dashed). The cell concentrations of proliferation-competent cells cp (green solid) and membrane-defect cells cn (red solid) are displayed. (b) Growth dynamics over time for the outer radius Rspheroid (green) and necrotic radius Rnecrotic (red) along with the experimental outer radius (black crosses) and corresponding estimated necrotic radius (gray crosses). For the cellular automaton, the maximal and minimal radii from ten independent simulations are shown.

Similar articles

Cited by

References

    1. Brüningk S.C., Ziegenhein P., Rivens I., Oelfke U., ter Haar G. A cellular automaton model for spheroid response to radiation and hyperthermia treatments. Sci. Rep. 2019;9:17674. doi: 10.1038/s41598-019-54117-x. - DOI - PMC - PubMed
    1. Brüningk S.C., Rivens I., Box C., Oelfke U., ter Haar G. 3D tumour spheroids for the prediction of the effects of radiation and hyperthermia treatments. Sci. Rep. 2020;10:1653. doi: 10.1038/s41598-020-58569-4. - DOI - PMC - PubMed
    1. Riffle S., Hegde R.S. Modeling tumor cell adaptations to hypoxia in multicellular tumor spheroids. J. Exp. Clin. Cancer Res. 2017;36:102. doi: 10.1186/s13046-017-0570-9. - DOI - PMC - PubMed
    1. Leek R., Grimes D.R., Harris A.L., McIntyre A. Methods: Using Three-Dimensional Culture (Spheroids) as an In Vitro Model of Tumour Hypoxia. In: Koumenis C., Coussens L.M., Giaccia A., Hammond E., editors. Proceedings of the Tumor Microenvironment. Springer International Publishing; Berlin/Heidelberg, Germany: 2016. pp. 167–196. Advances in Experimental Medicine and Biology. - DOI - PubMed
    1. Hirschhaeuser F., Menne H., Dittfeld C., West J., Mueller-Klieser W., Kunz-Schughart L.A. Multicellular tumor spheroids: An underestimated tool is catching up again. J. Biotechnol. 2010;148:3–15. doi: 10.1016/j.jbiotec.2010.01.012. - DOI - PubMed

LinkOut - more resources