Integrated Genomic Analysis of Primary Prostate Tumor Foci and Corresponding Lymph Node Metastases Identifies Mutations and Pathways Associated with Metastasis
- PMID: 38067373
- PMCID: PMC10705102
- DOI: 10.3390/cancers15235671
Integrated Genomic Analysis of Primary Prostate Tumor Foci and Corresponding Lymph Node Metastases Identifies Mutations and Pathways Associated with Metastasis
Abstract
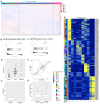
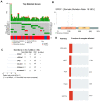
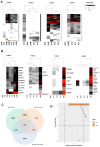
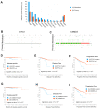
Prostate cancer is a highly heterogeneous disease and mortality is mainly due to metastases but the initial steps of metastasis have not been well characterized. We have performed integrative whole exome sequencing and transcriptome analysis of primary prostate tumor foci and corresponding lymph node metastases (LNM) from 43 patients enrolled in clinical trial. We present evidence that, while there are some cases of clonally independent primary tumor foci, 87% of primary tumor foci and metastases are descended from a common ancestor. We demonstrate that genes related to oxidative phosphorylation are upregulated in LNM and in African-American patients relative to White patients. We further show that mutations in TP53, FLT4, EYA1, NCOR2, CSMD3, and PCDH15 are enriched in prostate cancer metastases. These findings were validated in a meta-analysis of 3929 primary tumors and 2721 metastases and reveal a pattern of molecular alterations underlying the pathology of metastatic prostate cancer. We show that LNM contain multiple subclones that are already present in primary tumor foci. We observed enrichment of mutations in several genes including understudied genes such as EYA1, CSMD3, FLT4, NCOR2, and PCDH15 and found that mutations in EYA1 and CSMD3 are associated with a poor outcome in prostate cancer.
Keywords: cancer genomics; metastasis; prostate cancer; tumor heterogeneity.
Conflict of interest statement
The authors declare no conflict of interest.
Figures


Similar articles
-
Comparative genomics of primary prostate cancer and paired metastases: insights from 12 molecular case studies.J Pathol. 2022 Jul;257(3):274-284. doi: 10.1002/path.5887. Epub 2022 Mar 28. J Pathol. 2022. PMID: 35220606 Free PMC article.
-
Loss of p53 and c-myc overrepresentation in stage T(2-3)N(1-3)M(0) prostate cancer are potential markers for cancer progression.Mod Pathol. 2002 Jan;15(1):35-44. doi: 10.1038/modpathol.3880487. Mod Pathol. 2002. PMID: 11796839
-
Integrative genomic profiling reveals characteristics of lymph node metastasis in small cell lung cancer.Transl Lung Cancer Res. 2023 Feb 28;12(2):295-311. doi: 10.21037/tlcr-22-785. Epub 2023 Feb 13. Transl Lung Cancer Res. 2023. PMID: 36895932 Free PMC article.
-
Multifocal Primary Prostate Cancer Exhibits High Degree of Genomic Heterogeneity.Eur Urol. 2019 Mar;75(3):498-505. doi: 10.1016/j.eururo.2018.08.009. Epub 2018 Sep 1. Eur Urol. 2019. PMID: 30181068
-
Mutational landscape of paired primary and synchronous metastatic lymph node in chemotherapy naive gallbladder cancer.Mol Biol Rep. 2022 Feb;49(2):1295-1301. doi: 10.1007/s11033-021-06957-y. Epub 2022 Jan 5. Mol Biol Rep. 2022. PMID: 34988893
Cited by
-
Transcriptomic miRNA and mRNA signatures in primary prostate cancer that are associated with lymph-node invasion.Clin Transl Med. 2025 Apr;15(4):e70288. doi: 10.1002/ctm2.70288. Clin Transl Med. 2025. PMID: 40219635 Free PMC article.
-
Metastatic hormone-naïve prostate cancer: a distinct biological entity.Trends Cancer. 2024 Sep;10(9):825-841. doi: 10.1016/j.trecan.2024.06.005. Epub 2024 Jul 23. Trends Cancer. 2024. PMID: 39048488 Free PMC article. Review.
-
Tissue-Based Genomic Testing in Prostate Cancer: 10-Year Analysis of National Trends on the Use of Prolaris, Decipher, ProMark, and Oncotype DX.Clin Pract. 2024 Mar 19;14(2):508-520. doi: 10.3390/clinpract14020039. Clin Pract. 2024. PMID: 38525718 Free PMC article.
References
Grants and funding
LinkOut - more resources
Full Text Sources
Research Materials
Miscellaneous

