

Computational Modeling of Thermal Ablation Zones in the Liver: A Systematic Review
- PMID: 38067386
- PMCID: PMC10705371
- DOI: 10.3390/cancers15235684
Computational Modeling of Thermal Ablation Zones in the Liver: A Systematic Review
Abstract
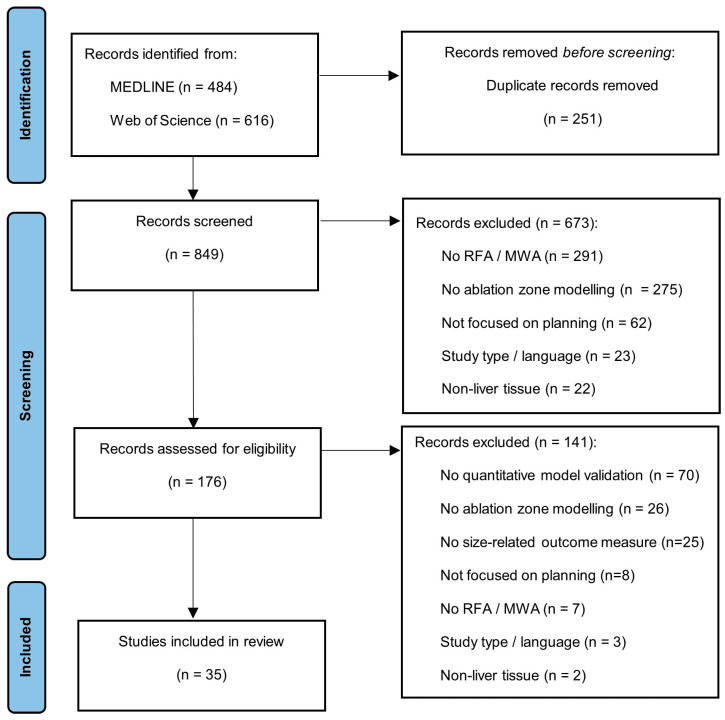
Purpose: This systematic review aims to identify, evaluate, and summarize the findings of the literature on existing computational models for radiofrequency and microwave thermal liver ablation planning and compare their accuracy.
Methods: A systematic literature search was performed in the MEDLINE and Web of Science databases. Characteristics of the computational model and validation method of the included articles were retrieved.
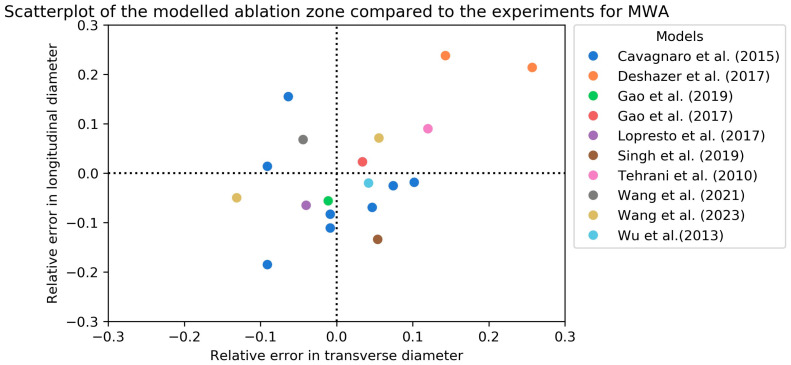
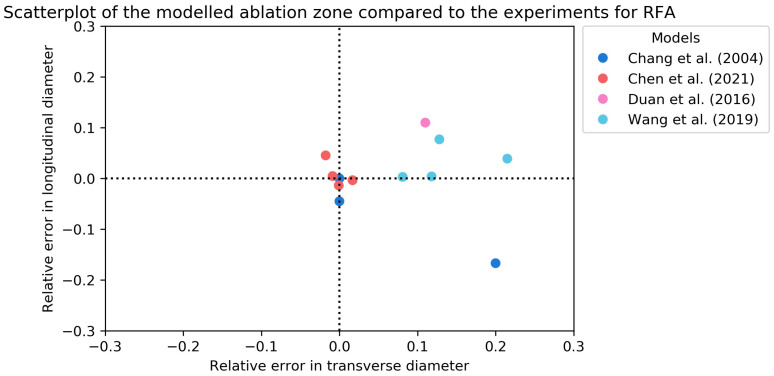
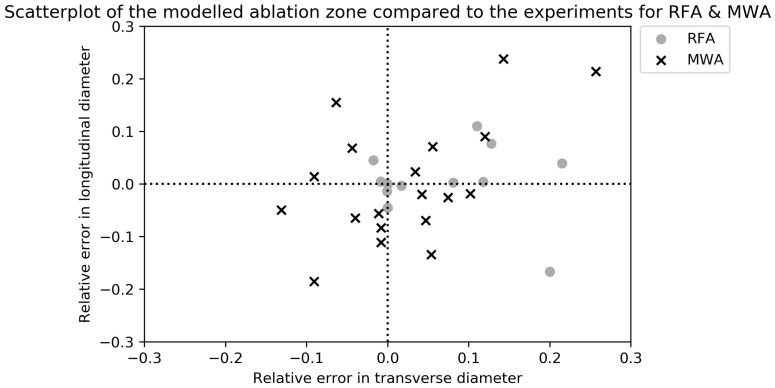
Results: The literature search identified 780 articles, of which 35 were included. A total of 19 articles focused on simulating radiofrequency ablation (RFA) zones, and 16 focused on microwave ablation (MWA) zones. Out of the 16 articles simulating MWA, only 2 used in vivo experiments to validate their simulations. Out of the 19 articles simulating RFA, 10 articles used in vivo validation. Dice similarity coefficients describing the overlap between in vivo experiments and simulated RFA zones varied between 0.418 and 0.728, with mean surface deviations varying between 1.1 mm and 8.67 mm.
Conclusion: Computational models to simulate ablation zones of MWA and RFA show considerable heterogeneity in model type and validation methods. It is currently unknown which model is most accurate and best suitable for use in clinical practice.
Keywords: ablation zone simulation; computational modeling; liver neoplasm; therapy planning; thermal ablation.
Conflict of interest statement
The authors declare no conflict of interest.
Figures
Similar articles
-
Experimental assessment of microwave ablation computational modeling with MR thermometry.Med Phys. 2020 Sep;47(9):3777-3788. doi: 10.1002/mp.14318. Epub 2020 Jul 16. Med Phys. 2020. PMID: 32506550 Free PMC article.
-
How large is the periablational zone after radiofrequency and microwave ablation? Computer-based comparative study of two currently used clinical devices.Int J Hyperthermia. 2020;37(1):1131-1138. doi: 10.1080/02656736.2020.1823022. Int J Hyperthermia. 2020. PMID: 32996794 Free PMC article.
-
Physical modeling of microwave ablation zone clinical margin variance.Med Phys. 2016 Apr;43(4):1764. doi: 10.1118/1.4942980. Med Phys. 2016. PMID: 27036574
-
Microwave ablation versus radiofrequency ablation for treating spinal metastases.Medicine (Baltimore). 2023 Jun 23;102(25):e34092. doi: 10.1097/MD.0000000000034092. Medicine (Baltimore). 2023. PMID: 37352076 Free PMC article.
-
Evidence on percutaneous radiofrequency and microwave ablation for liver metastases over the last decade.Jpn J Radiol. 2022 Oct;40(10):1035-1045. doi: 10.1007/s11604-022-01335-5. Epub 2022 Sep 13. Jpn J Radiol. 2022. PMID: 36097234 Free PMC article. Review.
Cited by
-
Role of Computational Modelling in Enhancing Thermal Safety During Cardiac Ablation.Interdiscip Cardiovasc Thorac Surg. 2025 Aug 5;40(8):ivaf184. doi: 10.1093/icvts/ivaf184. Interdiscip Cardiovasc Thorac Surg. 2025. PMID: 40737441 Free PMC article.
-
Treatment Planning Strategies for Interstitial Ultrasound Ablation of Prostate Cancer.IEEE Open J Eng Med Biol. 2024 May 8;5:362-375. doi: 10.1109/OJEMB.2024.3397965. eCollection 2024. IEEE Open J Eng Med Biol. 2024. PMID: 38899026 Free PMC article.
-
Optimizing microwave ablation planning with the ablation success ratio.Sci Rep. 2025 Mar 26;15(1):10450. doi: 10.1038/s41598-025-94957-4. Sci Rep. 2025. PMID: 40140611 Free PMC article.
-
Consensus Guideline of Ablation for Metastatic Liver Tumors by Taiwan Academy of Tumor Ablation.Liver Cancer. 2025 Jun 19. doi: 10.1159/000546765. Online ahead of print. Liver Cancer. 2025. PMID: 40686658 Free PMC article.
-
Comparison of CT-Guided Microwave Ablation of Liver Malignancies with and Without Intra-Arterial Catheter Placement for Contrast Administration.Curr Oncol. 2025 Jan 2;32(1):28. doi: 10.3390/curroncol32010028. Curr Oncol. 2025. PMID: 39851944 Free PMC article.
References
-
- Reig M., Forner A., Rimola J., Ferrer-Fàbrega J., Burrel M., Garcia-Criado Á., Kelley R.K., Galle P.R., Mazzaferro V., Salem R., et al. BCLC strategy for prognosis prediction and treatment recommendation: The 2022 update. J. Hepatol. 2022;76:681–693. doi: 10.1016/j.jhep.2021.11.018. - DOI - PMC - PubMed
-
- Kim Y.S., Lee W.J., Rhim H., Lim H.K., Choi D., Lee J.Y. The minimal ablative margin of radiofrequency ablation of hepatocellular carcinoma (>2 and <5 cm) needed to prevent local tumor progression: 3D quantitative assessment using CT image fusion. AJR Am. J. Roentgenol. 2010;195:758–765. doi: 10.2214/ajr.09.2954. - DOI - PubMed
-
- Laimer G., Schullian P., Jaschke N., Putzer D., Eberle G., Alzaga A., Odisio B., Bale R. Minimal ablative margin (MAM) assessment with image fusion: An independent predictor for local tumor progression in hepatocellular carcinoma after stereotactic radiofrequency ablation. Eur. Radiol. 2020;30:2463–2472. doi: 10.1007/s00330-019-06609-7. - DOI - PMC - PubMed
Publication types
LinkOut - more resources
Full Text Sources
