

Increased Plasmatic Levels of Exosomes Are Significantly Related to Relapse Rate in Patients with Oral Squamous Cell Carcinoma: A Cohort Study
- PMID: 38067397
- PMCID: PMC10705147
- DOI: 10.3390/cancers15235693
Increased Plasmatic Levels of Exosomes Are Significantly Related to Relapse Rate in Patients with Oral Squamous Cell Carcinoma: A Cohort Study
Abstract
Background: Oral squamous cell carcinoma (OSCC) is characterized by an immunosuppressive tumor microenvironment. Their plasma-derived exosomes deliver immunomodulatory molecules and cargo that correlate significantly with clinical parameters. This study aims to assess the exosomal profile as a potential tool for early detection of relapse and long-term outcomes in OSCC patients undergoing conventional therapy.
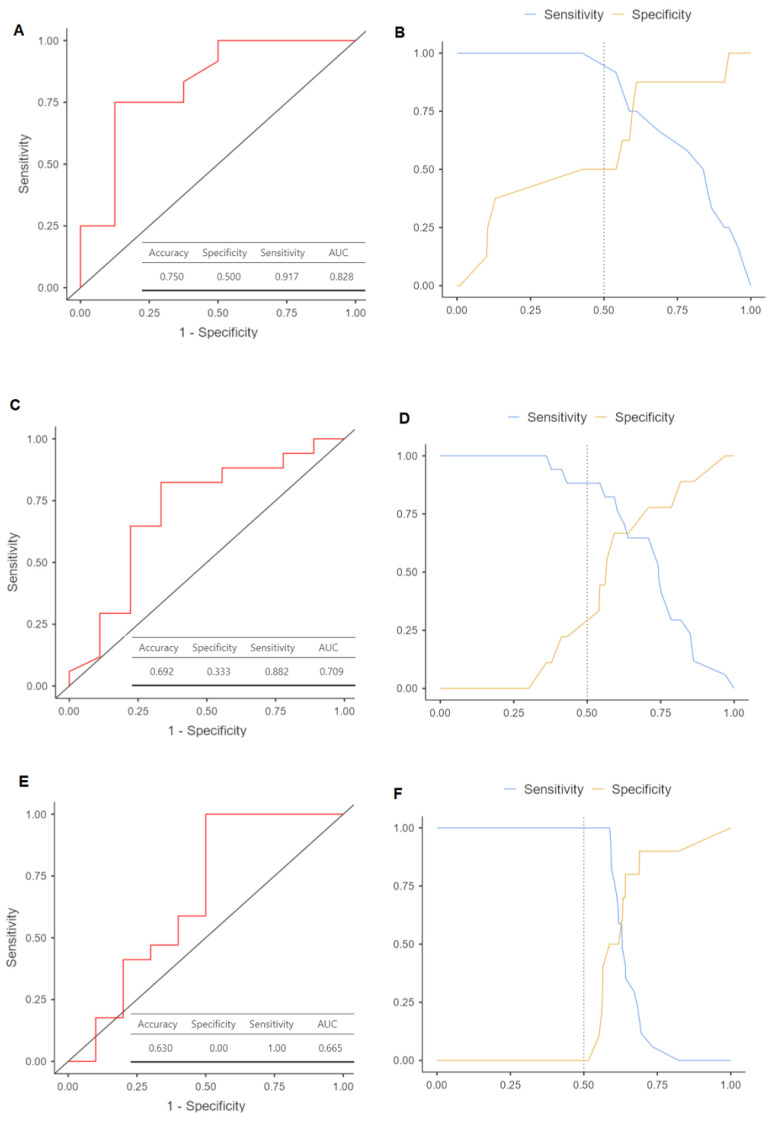
Methods: 27 OSCC patients with a median 38-month follow-up were included in this study. The relationship between NTA-derived parameters and clinical pathological parameters was examined, and receiver operating characteristic (ROC) curves were utilized to evaluate the diagnostic efficacy of these values in detecting cancer relapse.
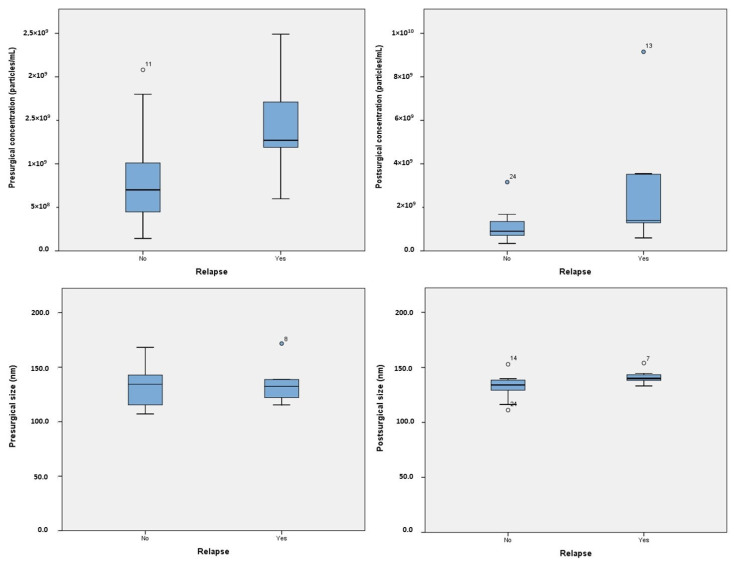
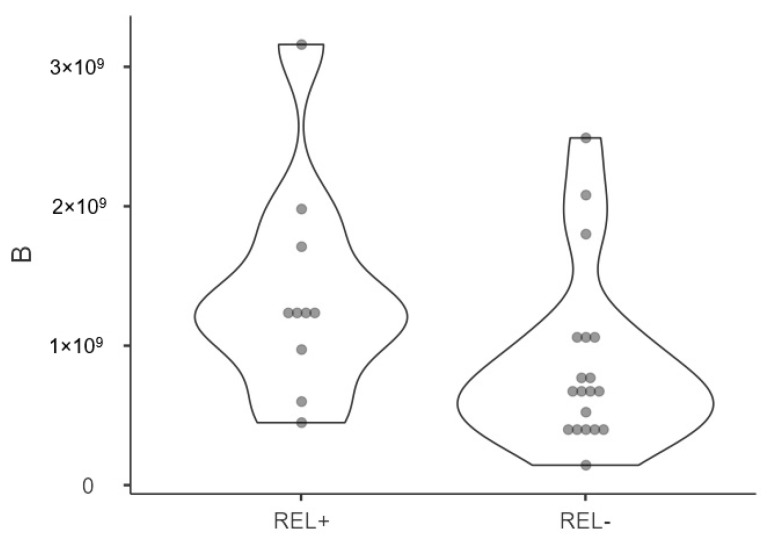
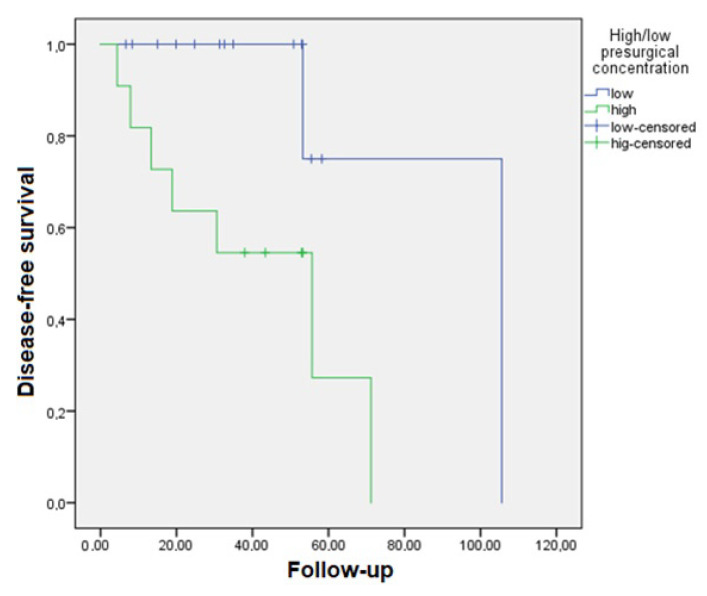
Results: Plasmatic levels of exosomes prior to surgery showed a drastic reduction after surgical intervention (8.08E vs. 1.41 × 10⁹ particles/mL, p = 0.006). Postsurgical concentrations of exosomes were higher in patients who experienced relapse compared to those who remained disease-free (2.97 × 10⁹ vs. 1.11 × 10⁹ particles/mL, p = 0.046). Additionally, patients who relapsed exhibited larger exosome sizes after surgery (141.47 vs. 132.31 nm, p = 0.03). Patients with lower concentrations of exosomes prior to surgery demonstrated better disease-free survival compared to those with higher levels (p = 0.012). ROC analysis revealed an area under the curve of 0.82 for presurgical exosome concentration in identifying relapse.
Conclusions: Presurgical exosomal plasmatic levels serve as independent predictors of early recurrence and survival in OSCC. All in all, our findings indicate that the detection of peripheral exosomes represents a novel tool for the clinical management of OSCC, with potential implications for prognosis assessment.
Keywords: NTA; liquid biopsy; mouth neoplasm; plasmatic exosomes; screening test.
Conflict of interest statement
The authors declare no conflict of interest.
Figures
Similar articles
-
A Pilot Clinical Study on the Prognostic Relevance of Plasmatic Exosomes Levels in Oral Squamous Cell Carcinoma Patients.Cancers (Basel). 2019 Mar 26;11(3):429. doi: 10.3390/cancers11030429. Cancers (Basel). 2019. PMID: 30917536 Free PMC article.
-
Salivary exosomal miR-24-3p serves as a potential detective biomarker for oral squamous cell carcinoma screening.Biomed Pharmacother. 2020 Jan;121:109553. doi: 10.1016/j.biopha.2019.109553. Epub 2019 Nov 5. Biomed Pharmacother. 2020. PMID: 31704611
-
Plasmatic Exosome Number and Size Distinguish Prostate Cancer Patients From Healthy Individuals: A Prospective Clinical Study.Front Oncol. 2021 Oct 20;11:727317. doi: 10.3389/fonc.2021.727317. eCollection 2021. Front Oncol. 2021. PMID: 34745949 Free PMC article.
-
The Emerging Role of Exosomes in Oral Squamous Cell Carcinoma.Front Cell Dev Biol. 2021 Feb 22;9:628103. doi: 10.3389/fcell.2021.628103. eCollection 2021. Front Cell Dev Biol. 2021. PMID: 33718365 Free PMC article. Review.
-
The Roles of Exosomes in the Diagnose, Development and Therapeutic Resistance of Oral Squamous Cell Carcinoma.Int J Mol Sci. 2023 Jan 19;24(3):1968. doi: 10.3390/ijms24031968. Int J Mol Sci. 2023. PMID: 36768288 Free PMC article. Review.
Cited by
-
The Diagnostic and Prognostic Value of Plasmatic Exosome Count in Cancer Patients and in Patients with Other Pathologies.Int J Mol Sci. 2024 Jan 15;25(2):1049. doi: 10.3390/ijms25021049. Int J Mol Sci. 2024. PMID: 38256122 Free PMC article.
-
Role of Exosomes in Salivary Gland Tumors and Technological Advances in Their Assessment.Cancers (Basel). 2024 Sep 27;16(19):3298. doi: 10.3390/cancers16193298. Cancers (Basel). 2024. PMID: 39409917 Free PMC article. Review.
-
Exosomal Biomarkers: A Comprehensive Overview of Diagnostic and Prognostic Applications in Malignant and Non-Malignant Disorders.Biomolecules. 2025 Apr 15;15(4):587. doi: 10.3390/biom15040587. Biomolecules. 2025. PMID: 40305328 Free PMC article. Review.
-
The effect of absorbable collagen suture for oral implant repair on wound healing and inflammation factors of gingival crevicular fluid.J Med Biochem. 2025 Jan 24;44(1):24-30. doi: 10.5937/jomb0-51148. J Med Biochem. 2025. PMID: 39991177 Free PMC article.
References
LinkOut - more resources
Full Text Sources
