

Characterization of Metabolite Landscape Distinguishes Medicinal Fungus Cordyceps sinensis and other Cordyceps by UHPLC-Q Exactive HF-X Untargeted Metabolomics
- PMID: 38067475
- PMCID: PMC10708286
- DOI: 10.3390/molecules28237745
Characterization of Metabolite Landscape Distinguishes Medicinal Fungus Cordyceps sinensis and other Cordyceps by UHPLC-Q Exactive HF-X Untargeted Metabolomics
Abstract
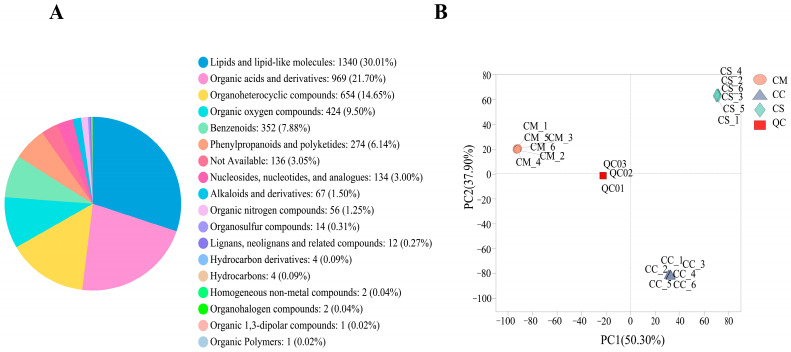
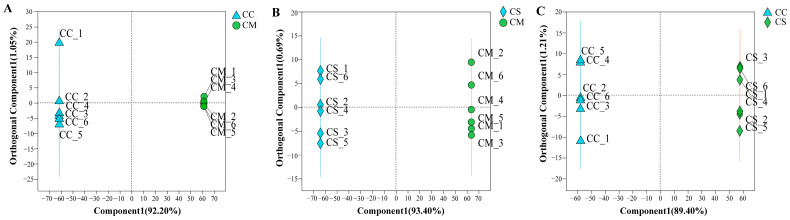
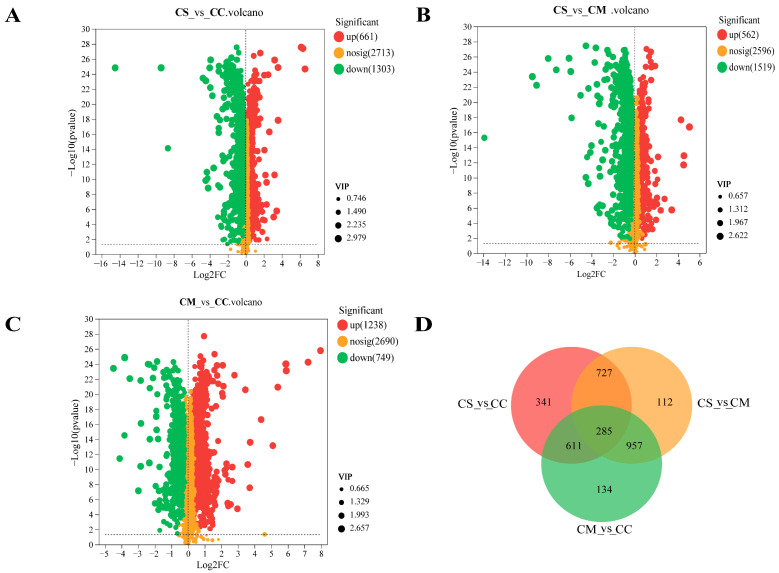
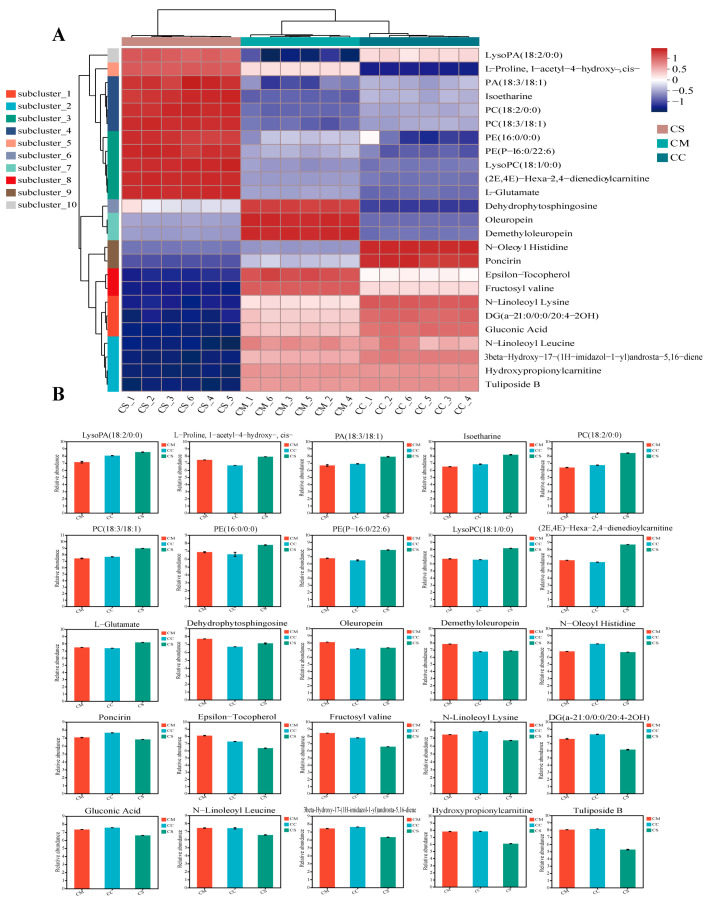
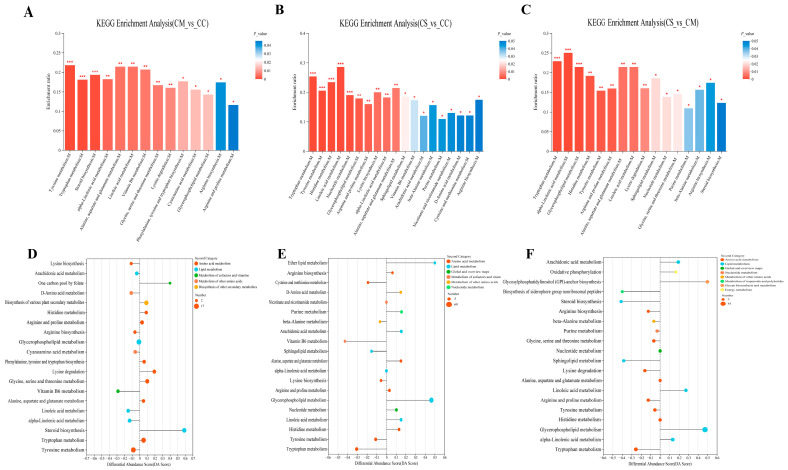
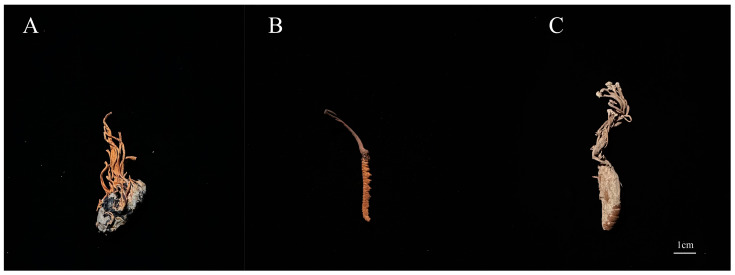
Cordyceps represent a valuable class of medicinal fungi with potential utilization. The overexploitation and resource scarcity of Cordyceps sinensis (CS) have led to the emergence of Cordyceps such as Cordyceps militaris (CM) and Cordyceps cicadae (CC) as substitutes. The medicinal value of CS is often considered superior to other Cordyceps, potentially owing to differences in active ingredients. This study aimed to evaluate the differences in the composition and abundance of the primary and secondary metabolites of CS and its substitutes by untargeted metabolomics. A total of 4671 metabolites from 18 superclasses were detected. CS and its substitutes were rich in amino acids, lipids, organic acids, and their derivatives. We statistically analyzed the metabolites and found a total of 285 differential metabolites (3'-Adenylic acid, O-Adipoylcarnitine, L-Dopachrome, etc.) between CS and CC, CS and CM, and CM and CC, which are potential biomarkers. L-glutamate and glycerophospholipids were differential metabolites. A KEGG enrichment analysis indicated that the tyrosine metabolic pathway and tryptophan metabolism pathway are the most differentially expressed pathways among the three Cordyceps. In contrast, CS was enriched in a higher abundance of most lipid metabolites when compared to CM and CC, which may be an indispensable foundation for the pharmacological functions of CS. In conclusion, systematic, untargeted metabolomics analyses for CS and other Cordyceps have delivered a precious resource for insights into metabolite landscapes and predicted potential components of disease therapeutics.
Keywords: Cordyceps cicadae; Cordyceps militaris; Cordyceps sinensis; differential metabolites; untargeted metabolomics.
Conflict of interest statement
The authors declare no conflict of interest.
Figures
Similar articles
-
Comparative Metabolite Profiling Between Cordyceps sinensis and Other Cordyceps by Untargeted UHPLC-MS/MS.Biology (Basel). 2025 Jan 23;14(2):118. doi: 10.3390/biology14020118. Biology (Basel). 2025. PMID: 40001886 Free PMC article.
-
Analysis of Metabolic Profiles and Antioxidant Activity of Chinese Cordyceps, Ophiocordyceps sinensis, and Paecilomyces hepiali Based on Untargeted Metabolomics.Biology (Basel). 2024 Aug 31;13(9):683. doi: 10.3390/biology13090683. Biology (Basel). 2024. PMID: 39336110 Free PMC article.
-
Cordyceps cicadae and Cordyceps gunnii have closer species correlation with Cordyceps sinensis: from the perspective of metabonomic and MaxEnt models.Sci Rep. 2022 Nov 28;12(1):20469. doi: 10.1038/s41598-022-24309-z. Sci Rep. 2022. PMID: 36443322 Free PMC article.
-
Can Cordyceps cicadae be used as an alternative to Cordyceps militaris and Cordyceps sinensis? - A review.J Ethnopharmacol. 2020 Jul 15;257:112879. doi: 10.1016/j.jep.2020.112879. Epub 2020 Apr 16. J Ethnopharmacol. 2020. PMID: 32305637 Review.
-
Cordyceps fungi: natural products, pharmacological functions and developmental products.J Pharm Pharmacol. 2009 Mar;61(3):279-91. doi: 10.1211/jpp/61.03.0002. J Pharm Pharmacol. 2009. PMID: 19222900 Review.
Cited by
-
Daily Brain Metabolic Rhythms of Wild Nocturnal Bats.Int J Mol Sci. 2024 Sep 12;25(18):9850. doi: 10.3390/ijms25189850. Int J Mol Sci. 2024. PMID: 39337348 Free PMC article.
-
Impact of climate change on the distribution of Isaria cicadae Miquel in China: predictions based on the MaxEnt model.Front Microbiol. 2025 Feb 7;16:1509882. doi: 10.3389/fmicb.2025.1509882. eCollection 2025. Front Microbiol. 2025. PMID: 39990145 Free PMC article.
-
Integrated Amino Acid Profiling and 4D-DIA Proteomics Reveal Protein Quality Divergence and Metabolic Adaptation in Cordyceps Species.J Fungi (Basel). 2025 May 8;11(5):365. doi: 10.3390/jof11050365. J Fungi (Basel). 2025. PMID: 40422699 Free PMC article.
-
The Cordyceps Genus as a Potential Source of Bioactive Compounds for Adjuvant Cancer Therapy: A Network Pharmacology Approach.Pharmaceuticals (Basel). 2025 Apr 30;18(5):667. doi: 10.3390/ph18050667. Pharmaceuticals (Basel). 2025. PMID: 40430485 Free PMC article.
-
Exploiting the roles of nitrogen sources for HEA increment in Cordyceps cicadae.Front Microbiol. 2024 May 13;15:1384027. doi: 10.3389/fmicb.2024.1384027. eCollection 2024. Front Microbiol. 2024. PMID: 38803370 Free PMC article.
References
MeSH terms
Supplementary concepts
LinkOut - more resources
Full Text Sources
Research Materials
Miscellaneous
