

A Study on Wheel Member Condition Recognition Using 1D-CNN
- PMID: 38067874
- PMCID: PMC10708876
- DOI: 10.3390/s23239501
A Study on Wheel Member Condition Recognition Using 1D-CNN
Abstract
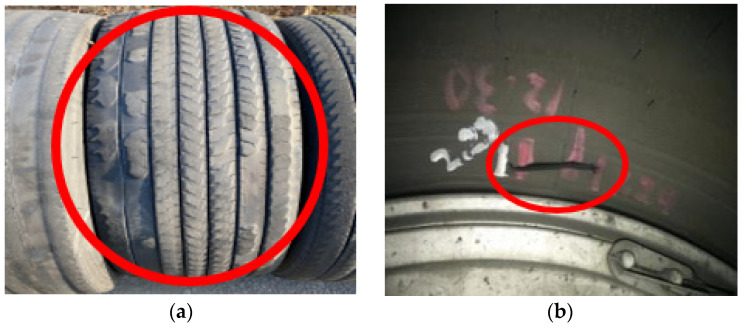
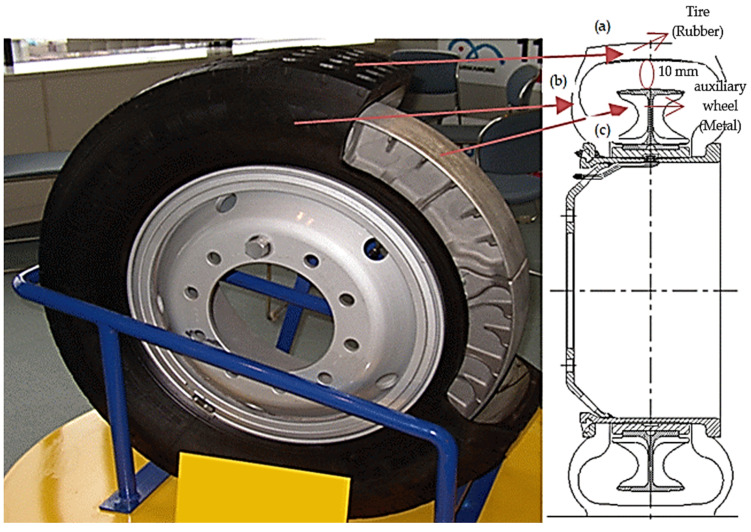
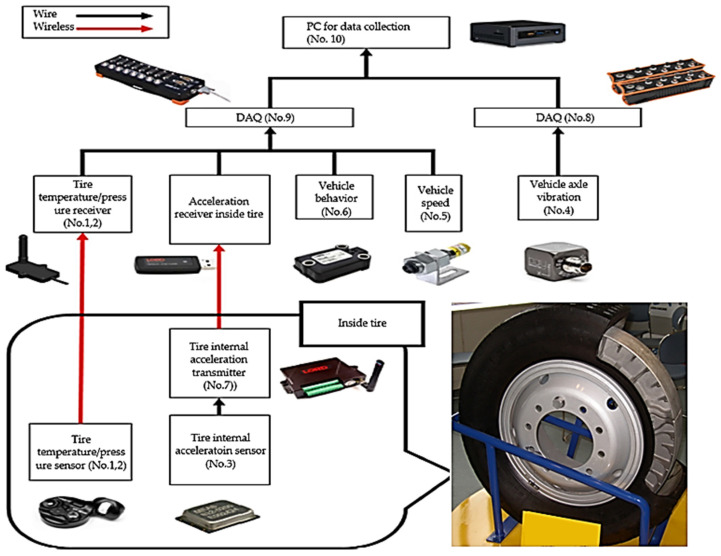
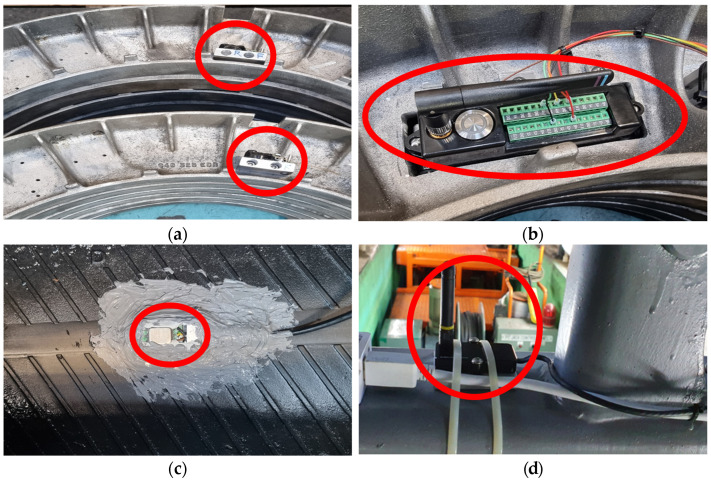
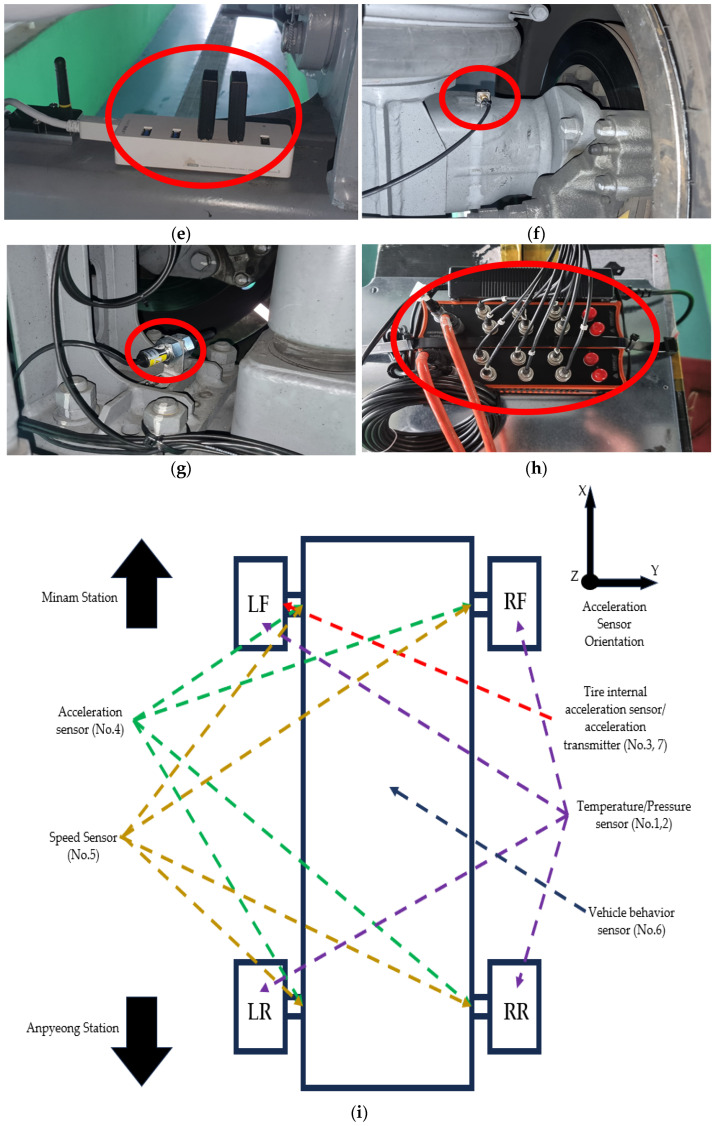
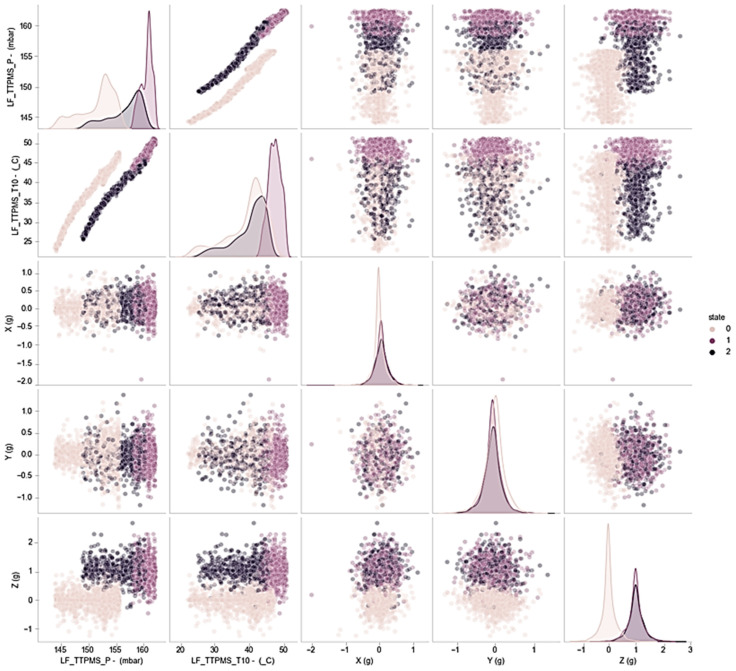
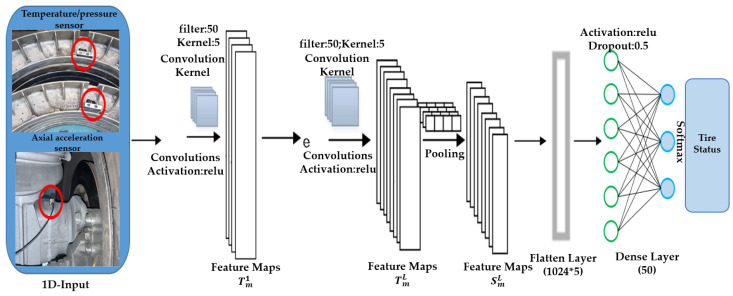
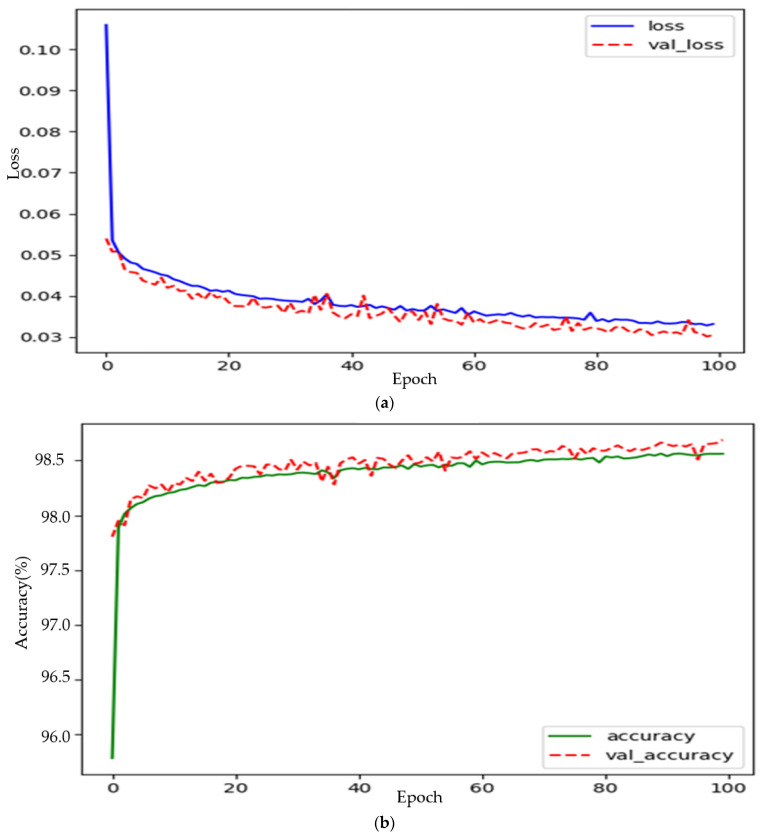
The condition of a railway vehicle's wheels is an essential factor for safe operation. However, the current inspection of railway vehicle wheels is limited to periodic major and minor maintenance, where physical anomalies such as vibrations and noise are visually checked by maintenance personnel and addressed after detection. As a result, there is a need for predictive technology concerning wheel conditions to prevent railway vehicle damage and potential accidents due to wheel defects. Insufficient predictive technology for railway vehicle's wheel conditions forms the background for this study. In this research, a real-time tire wear classification system for light-rail rubber tires was proposed to reduce operational costs, enhance safety, and prevent service delays. To perform real-time condition classification of rubber tires, operational data from railway vehicles, including temperature, pressure, and acceleration, were collected. These data were processed and analyzed to generate training data. A 1D-CNN model was employed to classify tire conditions, and it demonstrated exceptionally high performance with a 99.4% accuracy rate.
Keywords: deep learning; machine learning; recognizing condition algorithm; tire; wheel.
Conflict of interest statement
The authors declare no conflict of interest.
Figures
Similar articles
-
A Study on Wheel Member Condition Recognition Using Machine Learning (Support Vector Machine).Sensors (Basel). 2023 Oct 13;23(20):8455. doi: 10.3390/s23208455. Sensors (Basel). 2023. PMID: 37896551 Free PMC article.
-
Wheel Defect Detection Using a Hybrid Deep Learning Approach.Sensors (Basel). 2023 Jul 8;23(14):6248. doi: 10.3390/s23146248. Sensors (Basel). 2023. PMID: 37514543 Free PMC article.
-
Predicting the Wear Amount of Tire Tread Using 1D-CNN.Sensors (Basel). 2024 Oct 28;24(21):6901. doi: 10.3390/s24216901. Sensors (Basel). 2024. PMID: 39517798 Free PMC article.
-
Recent Advances in Wayside Railway Wheel Flat Detection Techniques: A Review.Sensors (Basel). 2023 Apr 12;23(8):3916. doi: 10.3390/s23083916. Sensors (Basel). 2023. PMID: 37112257 Free PMC article. Review.
-
A Review on Technologies for Localisation and Navigation in Autonomous Railway Maintenance Systems.Sensors (Basel). 2022 May 31;22(11):4185. doi: 10.3390/s22114185. Sensors (Basel). 2022. PMID: 35684804 Free PMC article. Review.
Cited by
-
FaultSeg: A Dataset for Train Wheel Defect Detection.Sci Data. 2025 Feb 20;12(1):309. doi: 10.1038/s41597-025-04557-0. Sci Data. 2025. PMID: 39979297 Free PMC article.
References
-
- Shim J., Koo J., Park Y., Kim J. Anomaly Detection Method in Railway Using Signal Processing and Deep Learning. Appl. Sci. 2022;12:12901. doi: 10.3390/app122412901. - DOI
-
- Hou M.R., Wang W.D., Chang C., Li L. A study of rail wear on sharp curves in EMU maintenance depot. J. China Railw. Soc. 2018;40:45–50.
-
- Li T., Burdisso R., Sandu C. An Artificial Neural Network Model to Predict Tread Pattern–Related Tire Noise. SAE International; Warrendale, PA, USA: 2017. SAE Technical Paper. - DOI
-
- Ye Y., Zhu B., Huang P., Peng B. OORNet: A deep learning model for on–board condition monitoring and fault diagnosis of out–of–round wheels of high–speed trains. Measurement. 2022;199:111268. doi: 10.1016/j.measurement.2022.111268. - DOI
-
- Arastounia M. Automated recognition of railroad infrastructure in rural areas from LiDAR data. Remote Sens. 2015;7:14916–14938. doi: 10.3390/rs71114916. - DOI
Grants and funding
LinkOut - more resources
Full Text Sources
Research Materials
