

Charting the Chronology of Research on Added Sugars: A Scoping Review and Evidence Map
- PMID: 38068831
- PMCID: PMC10708429
- DOI: 10.3390/nu15234974
Charting the Chronology of Research on Added Sugars: A Scoping Review and Evidence Map
Abstract
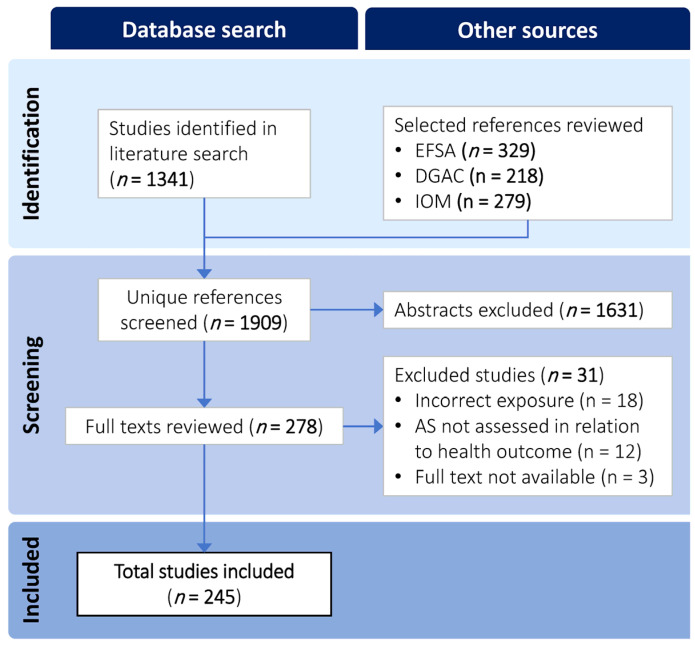
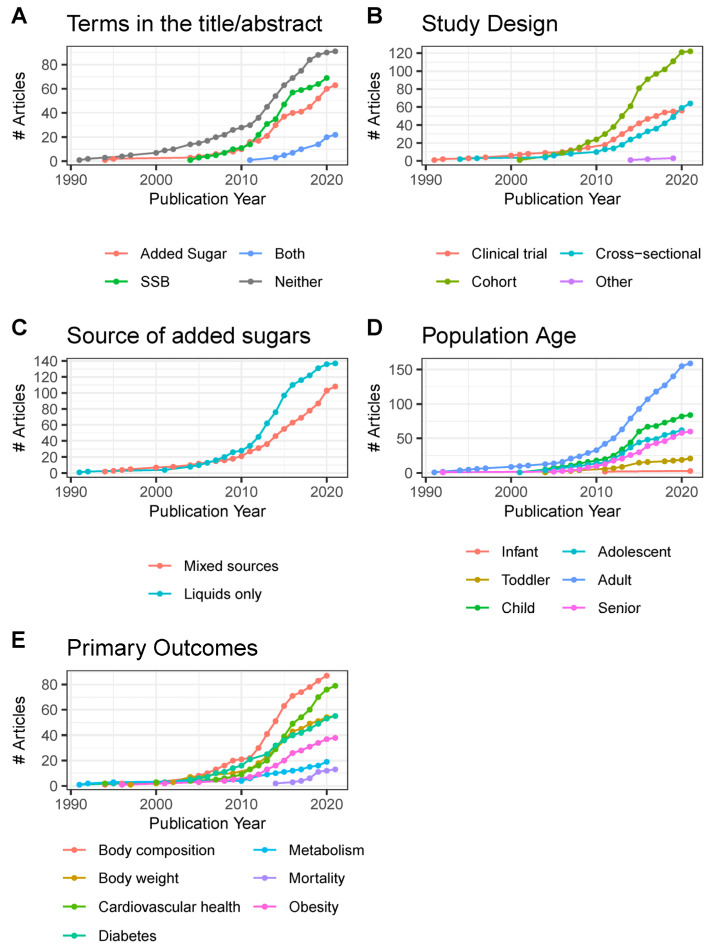
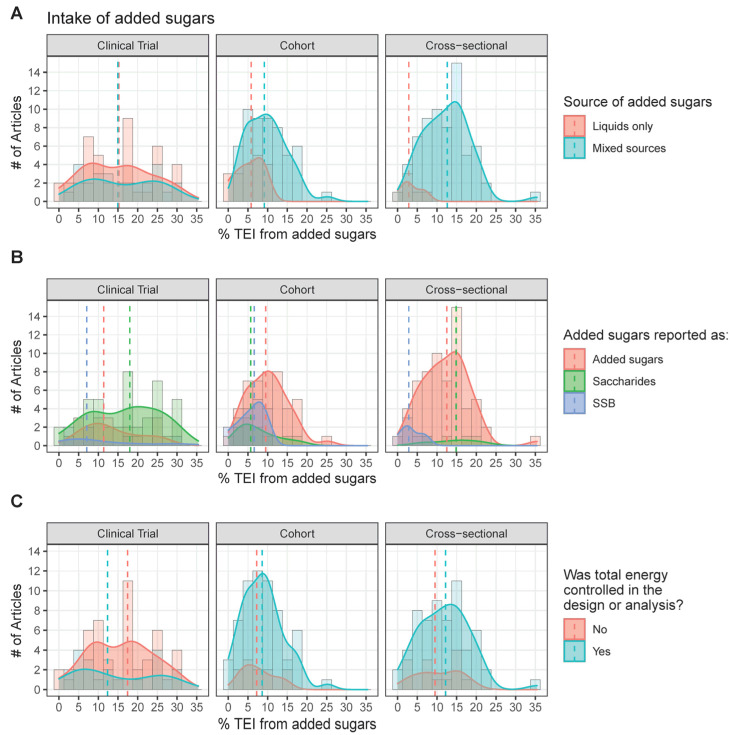
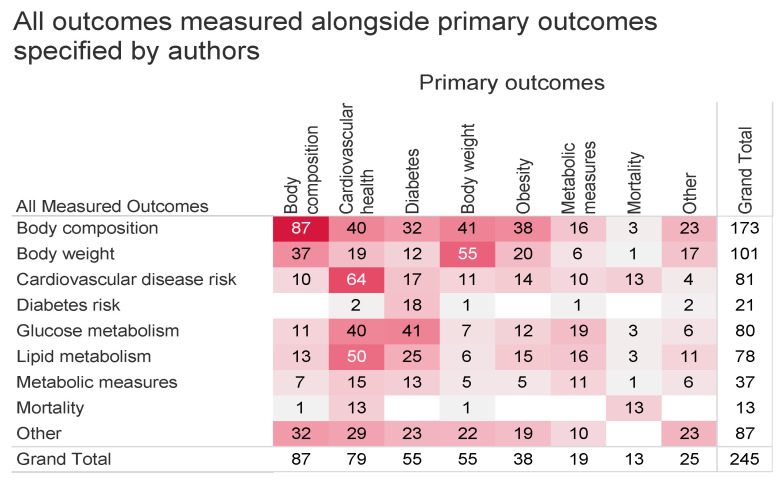
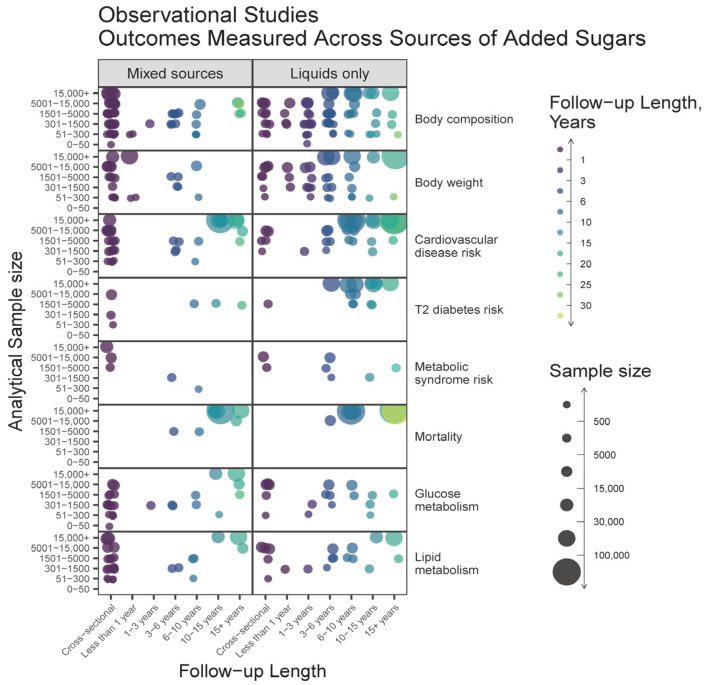
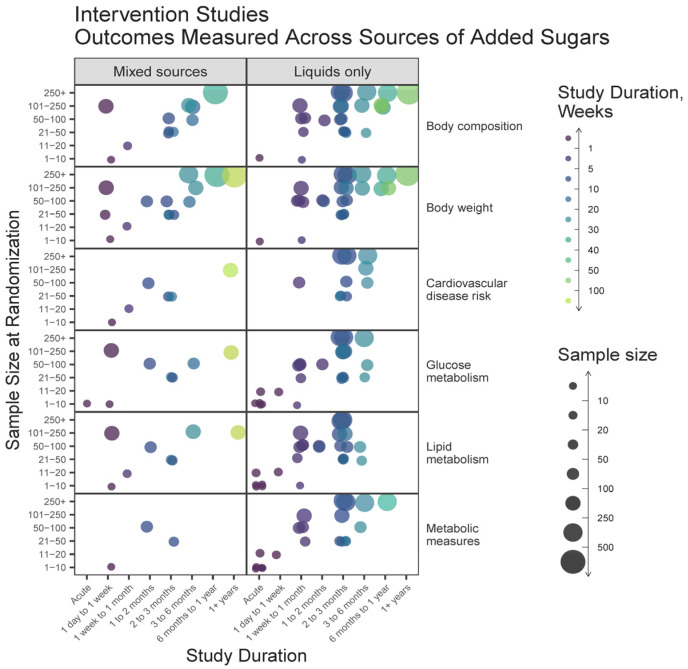
The objective of this study was to conduct a scoping review and produce a publicly available database characterizing the design and reporting elements of the literature on dietary added sugars and select health outcomes. Relevant studies published from 1990 to 2021 were identified to create a database containing information on study and population characteristics, reported added sugars source and concentrations, dietary energy balance, total energy intake, and outcome measures related to body composition, obesity, cardiovascular disease, and diabetes mellitus. There were 245 publications identified, 22% of which describe interventions, and 78% describe observational studies. Publications pertaining to added sugars have risen dramatically since 2010, led by studies primarily assessing body composition (36%) or cardiovascular health (32%), including adults (65%), measuring liquid-only sources of added sugars (56%). Over 65% of studies reported total energy intake, 61% controlled for total energy intake in the design and analysis, and fewer than 5% of studies reported the energy balance of subjects. There has been a significant increase in research on added sugars since 2010, with substantial heterogeneity across all facets of methodology-study designs, exposures and outcomes of interest, terminology, and reporting of dietary intake data-thus limiting the ability to synthesize evidence in this scope of the literature. This evidence map highlights gaps and important areas for improvement to strengthen the state of research and better inform future policies and dietary recommendations on added sugars.
Keywords: added sugars; dietary intake; sugar-sweetened beverages.
Conflict of interest statement
Author S.A.F. has ownership in Traverse Science. T.L.P. and S.A.F. are employees of Traverse Science. J.A.P. consulted for Traverse Science. M.O.S. and P.C.G. are employees of Sugar Association Inc.
Figures
Similar articles
-
Scoping Review and Evidence Map of the Relation between Exposure to Dietary Sweetness and Body Weight-Related Outcomes in Adults.Adv Nutr. 2022 Dec 22;13(6):2341-2356. doi: 10.1093/advances/nmac090. Adv Nutr. 2022. PMID: 36041167 Free PMC article.
-
Sugar-Sweetened Beverages Are the Main Sources of Added Sugar Intake in the Mexican Population.J Nutr. 2016 Sep;146(9):1888S-96S. doi: 10.3945/jn.115.220301. Epub 2016 Aug 10. J Nutr. 2016. PMID: 27511931
-
Declining consumption of added sugars and sugar-sweetened beverages in Australia: a challenge for obesity prevention.Am J Clin Nutr. 2017 Apr;105(4):854-863. doi: 10.3945/ajcn.116.145318. Epub 2017 Mar 8. Am J Clin Nutr. 2017. PMID: 28275129
-
Sugar intake by type (added vs. naturally occurring) and physical form (liquid vs. solid) and its varying association with children's body weight, NHANES 2009-2014.Pediatr Obes. 2018 Apr;13(4):213-221. doi: 10.1111/ijpo.12264. Epub 2018 Jan 9. Pediatr Obes. 2018. PMID: 29318755
-
Dietary glycation compounds - implications for human health.Crit Rev Toxicol. 2024 Sep;54(8):485-617. doi: 10.1080/10408444.2024.2362985. Epub 2024 Aug 16. Crit Rev Toxicol. 2024. PMID: 39150724
References
-
- U.S. Food & Drug Administration Added Sugars on the New Nutrition Facts Label. [(accessed on 1 August 2023)]; Available online: https://www.fda.gov/food/new-nutrition-facts-label/added-sugars-new-nutr....
-
- EFSA NDA Panel (EFSA Panel on Nutrition, Novel Foods and Food Allergens) Turck D., Bohn T., Castenmiller J., de Henauw S., Hirsch-Ernst K., Knutsen H., Maciuk A., Mangelsdorf I., McArdle H., et al. Scientific Opinion on the Tolerable Upper Intake Level for Dietary Sugars. EFSA J. 2022;20:e07074. doi: 10.2903/j.efsa.2022.7074. - DOI - PMC - PubMed
-
- World Health Organization . Guideline: Sugars Intake for Adults and Children. WHO Press; Geneva, Switzerland: 2015. - PubMed
-
- U.S. Department of Agriculture. U.S. Department of Health and Human Services . Dietary Guidelines for Americans, 2020–2025. 9th ed. U.S. Department of Agriculture and U.S. Department of Health and Human Services; Washington, DC, USA: 2020.
Publication types
MeSH terms
Substances
Grants and funding
LinkOut - more resources
Full Text Sources
Medical
