. 2023 Nov 28;24(23):16876.
doi: 10.3390/ijms242316876.

Dopaminergic Projections from the Hypothalamic A11 Nucleus to the Spinal Trigeminal Nucleus Are Involved in Bidirectional Migraine Modulation

Affiliations

Dopaminergic Projections from the Hypothalamic A11 Nucleus to the Spinal Trigeminal Nucleus Are Involved in Bidirectional Migraine Modulation

Chenhao Li et al. Int J Mol Sci. .

Abstract

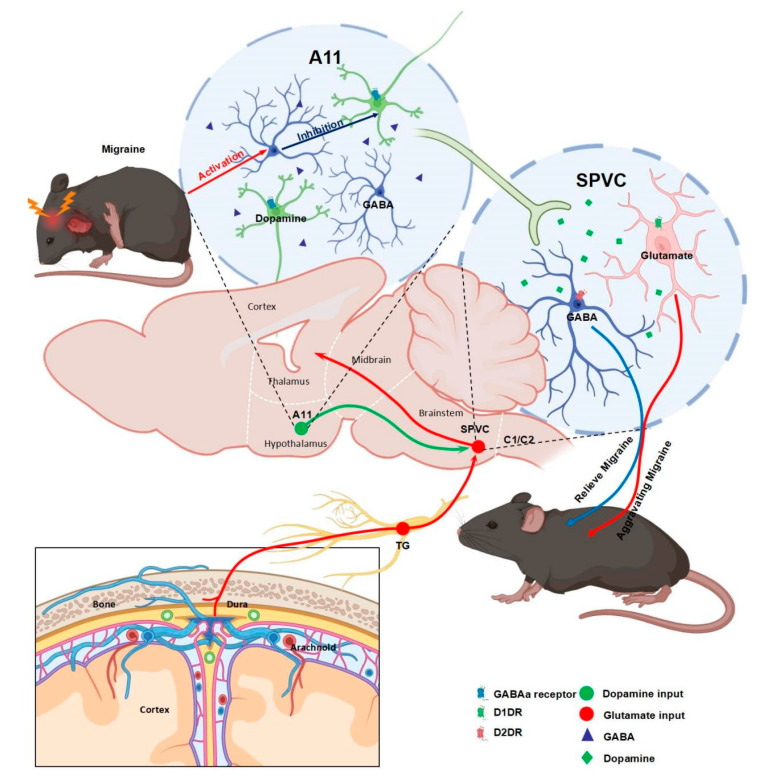
Clinical imaging studies have revealed that the hypothalamus is activated in migraine patients prior to the onset of and during headache and have also shown that the hypothalamus has increased functional connectivity with the spinal trigeminal nucleus. The dopaminergic system of the hypothalamus plays an important role, and the dopamine-rich A11 nucleus may play an important role in migraine pathogenesis. We used intraperitoneal injections of glyceryl trinitrate to establish a model of acute migraine attack and chronicity in mice, which was verified by photophobia experiments and von Frey experiments. We explored the A11 nucleus and its downstream pathway using immunohistochemical staining and neuronal tracing techniques. During acute migraine attack and chronification, c-fos expression in GABAergic neurons in the A11 nucleus was significantly increased, and inhibition of DA neurons was achieved by binding to GABA A-type receptors on the surface of dopaminergic neurons in the A11 nucleus. However, the expression of tyrosine hydroxylase and glutamic acid decarboxylase proteins in the A11 nucleus of the hypothalamus did not change significantly. Specific destruction of dopaminergic neurons in the A11 nucleus of mice resulted in severe nociceptive sensitization and photophobic behavior. The expression levels of the D1 dopamine receptor and D2 dopamine receptor in the caudal part of the spinal trigeminal nucleus candalis of the chronic migraine model were increased. Skin nociceptive sensitization of mice was slowed by activation of the D2 dopamine receptor in SP5C, and activation of the D1 dopamine receptor reversed this behavioral change. GABAergic neurons in the A11 nucleus were activated and exerted postsynaptic inhibitory effects, which led to a decrease in the amount of DA secreted by the A11 nucleus in the spinal trigeminal nucleus candalis. The reduced DA bound preferentially to the D2 dopamine receptor, thus exerting a defensive effect against headache.

Keywords: A11; D1 dopamine receptor; D2 dopamine receptor; GABAergic neuron; dopamine; glyceryl trinitrate; migraine.


Conflict of interest statement

The authors declare no conflict of interest.

Figures

Figure 4
Figure 4
Distribution characteristics of D1DR and D2DR in SP5C. (A) Most of the D2DR+ (red) cells are distributed in the deep layer of SP5C, and a small number of D2DR+ (red) cells are distributed in the shallow layer colocalized with vGluT2+ (green) cells. The majority of D1DR+ (red) cells are distributed in the shallow layer of SP5C colocalized with vGluT2+ (green) cells. (B) A small number of D1DR+ (green) cells colocalize with VGAT+ (red) cells, and the vast majority of D2DR+ (green) cells colocalize with VGAT+ (red) cells. (C) Some cells distributed in the shallow layer of SP5C exhibit D1DR+ (green) and D2DR+ (red) double immunoreactivity positivity.
Figure 1
Figure 1
Phase I modeling and functional exploration of the A11 nucleus in the model. (A) Flow chart of the experiment. (BE) Functional exploration of the A11 nucleus in the model and components. (B) The c-fos expression of A11 motifs in the control, acute, and chronic groups. TH (green) is used to indicate the position of A11 motifs, and the amount of c-fos (red) is used to characterize the activation degree of A11 motifs in each group, with a higher number representing a higher activation degree. (C) The number of c-fos+ cells in the A11 nucleus was counted in the three groups (control group: n = 10 mice per group, acute group: n = 9 mice per group, chronic group n = 8 mice per group) (D) Colocalization of VGAT+ (GABAergic neurons, red) neurons with c-fos+ (green) neurons in the A11 nucleus in the migraine model (acute vs. chronic groups). (E) Colocalization of TH+ (dopaminergic neurons, green) neurons with GABAA receptor+ (red) neurons in the A11 nucleus. (F) Differences in GAD (glutamic acid decarboxylase, used to characterize metabolic levels of GABAergic neurons) and TH (tyrosine hydroxylase, used to characterize metabolic levels of dopaminergic neurons) protein expression in the A11 nucleus among the three groups (n = 6 per group). Significance was assessed by Kruskal–Wallis H test with Mann–Whitney U post hoc comparison between groups (C; *** p < 0.001; ns, no significance) or by one-way ANOVA with post hoc comparison between groups (F; ns, no significance). All data are presented as the mean ± S.E.M.
Figure 1
Figure 1
Phase I modeling and functional exploration of the A11 nucleus in the model. (A) Flow chart of the experiment. (BE) Functional exploration of the A11 nucleus in the model and components. (B) The c-fos expression of A11 motifs in the control, acute, and chronic groups. TH (green) is used to indicate the position of A11 motifs, and the amount of c-fos (red) is used to characterize the activation degree of A11 motifs in each group, with a higher number representing a higher activation degree. (C) The number of c-fos+ cells in the A11 nucleus was counted in the three groups (control group: n = 10 mice per group, acute group: n = 9 mice per group, chronic group n = 8 mice per group) (D) Colocalization of VGAT+ (GABAergic neurons, red) neurons with c-fos+ (green) neurons in the A11 nucleus in the migraine model (acute vs. chronic groups). (E) Colocalization of TH+ (dopaminergic neurons, green) neurons with GABAA receptor+ (red) neurons in the A11 nucleus. (F) Differences in GAD (glutamic acid decarboxylase, used to characterize metabolic levels of GABAergic neurons) and TH (tyrosine hydroxylase, used to characterize metabolic levels of dopaminergic neurons) protein expression in the A11 nucleus among the three groups (n = 6 per group). Significance was assessed by Kruskal–Wallis H test with Mann–Whitney U post hoc comparison between groups (C; *** p < 0.001; ns, no significance) or by one-way ANOVA with post hoc comparison between groups (F; ns, no significance). All data are presented as the mean ± S.E.M.
Figure 2
Figure 2
Phase II modeling and behavioral validation. (A) The GTN acute intervention group was treated with bilateral A11 nucleus dopaminergic neuron-specific injury or sham surgery after a brief acclimatization period. GTN or VEH was injected intraperitoneally 14 days after surgical recovery. The light and dark box test was performed 1 h after intraperitoneal injection, and the von Frey test was performed before and 1 h, 2 h, 3 h, 6 h, 12 h, 24 h, and 48 h after intraperitoneal injection (different batches of mice were used for the light and dark box test and the von Frey test). The GTN chronic intervention group had the same acclimatization and surgical and recovery periods as the acute group. The difference was that at the end of the recovery period, intraperitoneal injections of GTN or VEH were performed every other day for a total of 5 injections. The von Frey test was performed before each intraperitoneal injection. Photophobic behavioral tests were performed 1 h after the last intraperitoneal injection. (B) Staining plots of the unilateral A11 nucleus 14 days after 6-OHDA injection, with the number of TH+ (green) neurons used to characterize the extent of the damage. Unilateral injection was a convenient control, and all A11 damage in the experiment was bilateral. (C) Cephalic and facial pain thresholds and hind paw mechanical pain thresholds were measured in the GTN acute intervention group (n = 8 mice per group). & p < 0.05, && p < 0.01, &&&& p < 0.0001 GTN + lesion group vs. GTN + Sham group. @ p < 0.05, @@ p < 0.01, @@@ p < 0.001, @@@@ p < 0.0001 GTN + lesion group vs. VEH + lesion group. * p < 0.05, ** p < 0.01, *** p < 0.001, **** p < 0.0001 GTN + lesion group vs. VEH + Sham group. (D) Photophobic behavioral assays in the GTN acute intervention group (VEH + Sham: n = 15 mice per group; VEH + lesion: n = 13 mice per group; GTN + Sham: n = 14 mice per group; GTN + lesion: n = 17 mice per group). (E) Cephalofacial pain thresholds and hind paw mechanical pain thresholds were determined in the GTN chronic intervention group (n = 8 mice per group). && p < 0.01, &&& p < 0.001 GTN + lesion group vs. GTN + Sham group. @@@ p < 0.001, @@@@ p < 0.0001 GTN + lesion group vs. VEH + lesion group. ** p < 0.01, *** p < 0.001, **** p < 0.0001 GTN + Lesion group vs. VEH + Sham group. (F) Photophobic behavioral measurements in the GTN chronic intervention group (VEH + Sham: n = 13 mice per group; VEH + lesion: n = 12 mice per group; GTN + Sham: n = 8 mice per group; GTN + lesion: n = 9 mice per group). The significance of C, E was assessed by two-way repeated-measures with ANOVA Tukey’s multiple comparisons test between groups (C (left): main group effects: F (3, 28) = 88.82, p < 0.0001, main time effects: F (5.152, 144.3) = 8.232, p < 0.0001. Interaction between group and time: F (21, 196) = 4.006, p < 0.0001; C (right): main group effects: F (3, 28) = 64.24, p < 0.0001, main time effects: F (5.207, 145.8) = 6.211, p < 0.0001. Interaction between group and time: F (21, 196) = 2.324, p = 0.0014; E (left): main group effects: F (3, 28) = 82.01, p < 0.0001, main time effects: F (2.740, 76.71) = 30.95, p < 0.0001. Interaction between group and time: F (12, 112) = 9.329, p < 0.0001; E (right): main group effects: F (3, 28) = 30.92, p < 0.0001, main time effects: F (3.537, 99.05) = 40.66, p < 0.0001. Interaction between group and time: F (12, 112) = 5.992, p < 0.0001). Significance of D, F was assessed by one-way ANOVA with post hoc comparison between groups (D; * p < 0.05, **** p <0.0001; ns, no significance; F; ** p < 0.01, *** p < 0.001, **** p <0.0001; ns, no significance). All data are presented as the mean ± S.E.M. The mean ± S.E.M. is the mean ± S.E.M. of the post hoc comparison.
Figure 2
Figure 2
Phase II modeling and behavioral validation. (A) The GTN acute intervention group was treated with bilateral A11 nucleus dopaminergic neuron-specific injury or sham surgery after a brief acclimatization period. GTN or VEH was injected intraperitoneally 14 days after surgical recovery. The light and dark box test was performed 1 h after intraperitoneal injection, and the von Frey test was performed before and 1 h, 2 h, 3 h, 6 h, 12 h, 24 h, and 48 h after intraperitoneal injection (different batches of mice were used for the light and dark box test and the von Frey test). The GTN chronic intervention group had the same acclimatization and surgical and recovery periods as the acute group. The difference was that at the end of the recovery period, intraperitoneal injections of GTN or VEH were performed every other day for a total of 5 injections. The von Frey test was performed before each intraperitoneal injection. Photophobic behavioral tests were performed 1 h after the last intraperitoneal injection. (B) Staining plots of the unilateral A11 nucleus 14 days after 6-OHDA injection, with the number of TH+ (green) neurons used to characterize the extent of the damage. Unilateral injection was a convenient control, and all A11 damage in the experiment was bilateral. (C) Cephalic and facial pain thresholds and hind paw mechanical pain thresholds were measured in the GTN acute intervention group (n = 8 mice per group). & p < 0.05, && p < 0.01, &&&& p < 0.0001 GTN + lesion group vs. GTN + Sham group. @ p < 0.05, @@ p < 0.01, @@@ p < 0.001, @@@@ p < 0.0001 GTN + lesion group vs. VEH + lesion group. * p < 0.05, ** p < 0.01, *** p < 0.001, **** p < 0.0001 GTN + lesion group vs. VEH + Sham group. (D) Photophobic behavioral assays in the GTN acute intervention group (VEH + Sham: n = 15 mice per group; VEH + lesion: n = 13 mice per group; GTN + Sham: n = 14 mice per group; GTN + lesion: n = 17 mice per group). (E) Cephalofacial pain thresholds and hind paw mechanical pain thresholds were determined in the GTN chronic intervention group (n = 8 mice per group). && p < 0.01, &&& p < 0.001 GTN + lesion group vs. GTN + Sham group. @@@ p < 0.001, @@@@ p < 0.0001 GTN + lesion group vs. VEH + lesion group. ** p < 0.01, *** p < 0.001, **** p < 0.0001 GTN + Lesion group vs. VEH + Sham group. (F) Photophobic behavioral measurements in the GTN chronic intervention group (VEH + Sham: n = 13 mice per group; VEH + lesion: n = 12 mice per group; GTN + Sham: n = 8 mice per group; GTN + lesion: n = 9 mice per group). The significance of C, E was assessed by two-way repeated-measures with ANOVA Tukey’s multiple comparisons test between groups (C (left): main group effects: F (3, 28) = 88.82, p < 0.0001, main time effects: F (5.152, 144.3) = 8.232, p < 0.0001. Interaction between group and time: F (21, 196) = 4.006, p < 0.0001; C (right): main group effects: F (3, 28) = 64.24, p < 0.0001, main time effects: F (5.207, 145.8) = 6.211, p < 0.0001. Interaction between group and time: F (21, 196) = 2.324, p = 0.0014; E (left): main group effects: F (3, 28) = 82.01, p < 0.0001, main time effects: F (2.740, 76.71) = 30.95, p < 0.0001. Interaction between group and time: F (12, 112) = 9.329, p < 0.0001; E (right): main group effects: F (3, 28) = 30.92, p < 0.0001, main time effects: F (3.537, 99.05) = 40.66, p < 0.0001. Interaction between group and time: F (12, 112) = 5.992, p < 0.0001). Significance of D, F was assessed by one-way ANOVA with post hoc comparison between groups (D; * p < 0.05, **** p <0.0001; ns, no significance; F; ** p < 0.01, *** p < 0.001, **** p <0.0001; ns, no significance). All data are presented as the mean ± S.E.M. The mean ± S.E.M. is the mean ± S.E.M. of the post hoc comparison.
Figure 3
Figure 3
Paracrine and retrograde neuronal tracing of the A11 nucleus projected to SP5C. (A) Paracrine tracer virus pAAV-EF1-DIO-EGFP-WPRE was injected into the bilateral A11 nucleus of TH-cre mice and stained after 21 days of expression. TH+ (red) neurons were colocalized with pAAV-EF1-DIO-EGFP-WPR (green)-expressing neurons. (B) Fibers of pAAV-EF1-DIO-EGFP-WPRE projected to SP5C (green) colocalized with D1DR (red) and D2DR (red), respectively. (C) Fluorescent gold injected into SP5C (left panel) as well as FG+ (red) cytosolic bodies were found in the bilateral A11 nucleus. (D) Retrograde tracer viral pAAV-hSyn-DIO-mCherry-WPRE (red) injection sites in SP5C. pAAV-hSyn-DIO-mCherry-WPRE (red) projected to the bilateral A11 nucleus colocalized with TH+ (green) neurons.
Figure 5
Figure 5
Pain behavioral measurements after modulation of dopamine receptors in SP5C and changes in dopamine receptor expression levels in different groups. (A) Behavioral changes after acute GTN intervention and administration of brain regions injected with the D1DR antagonist and D2DR antagonist (VEH + VEH: n = 8 mice per group, GTN + VEH: n = 10 mice per group, GTN + SCH23390: n = 10 mice per group; GTN + spiperone: n = 10 mice per group) (B) Changes in D1DR and D2DR protein expression levels in SP5C of the control, acute, and chronic stimulation groups (n = 6 mice per group). Significance was assessed by one-way ANOVA with post hoc comparison between groups (A, B; * p < 0.05, ** p < 0.01; ns, no significance). All data are presented as the mean ± S.E.M. The mean ± S.E.M. of the post hoc comparisons is shown in the table below.
Figure 6
Figure 6
Schematic diagram of dopaminergic projections from the hypothalamic A11 nucleus to the spinal trigeminal nucleus involved in bidirectional modulation of migraine headache.

References

    1. Ashina M., Terwindt G.M., Al-Karagholi M.A., de Boer I., Lee M.J., Hay D.L., Schulte L.H., Hadjikhani N., Sinclair A.J., Ashina H., et al. Migraine: Disease characterisation, biomarkers, and precision medicine. Lancet. 2021;397:1496–1504. doi: 10.1016/S0140-6736(20)32162-0. - DOI - PubMed
    1. Ashina M., Katsarava Z., Do T.P., Buse D.C., Pozo-Rosich P., Ozge A., Krymchantowski A.V., Lebedeva E.R., Ravishankar K., Yu S., et al. Migraine: Epidemiology and systems of care. Lancet. 2021;397:1485–1495. doi: 10.1016/S0140-6736(20)32160-7. - DOI - PubMed
    1. Collaborators G.B.D.N. Global, regional, and national burden of neurological disorders, 1990-2016: A systematic analysis for the Global Burden of Disease Study 2016. Lancet Neurol. 2019;18:459–480. doi: 10.1016/S1474-4422(18)30499-X. - DOI - PMC - PubMed
    1. Guven B., Guven H., Comoglu S.S. Migraine and Yawning. Headache. 2018;58:210–216. doi: 10.1111/head.13195. - DOI - PubMed
    1. Schulte L.H., Jurgens T.P., May A. Photo-, osmo- and phonophobia in the premonitory phase of migraine: Mistaking symptoms for triggers? J. Headache Pain. 2015;16:14. doi: 10.1186/s10194-015-0495-7. - DOI - PMC - PubMed