

Lost in Space? Unmasking the T Cell Reaction to Simulated Space Stressors
- PMID: 38069265
- PMCID: PMC10707245
- DOI: 10.3390/ijms242316943
Lost in Space? Unmasking the T Cell Reaction to Simulated Space Stressors
Abstract
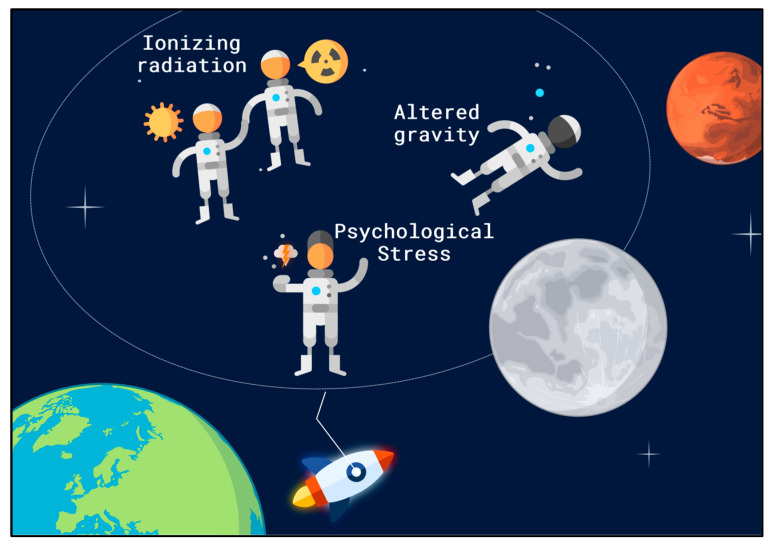
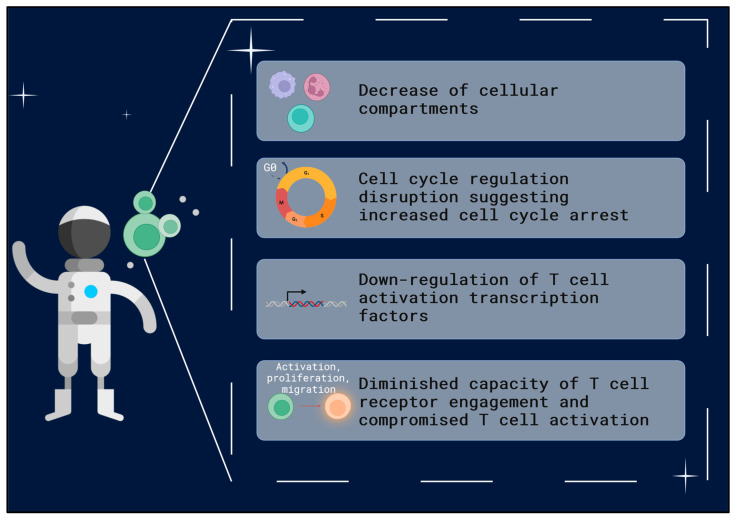
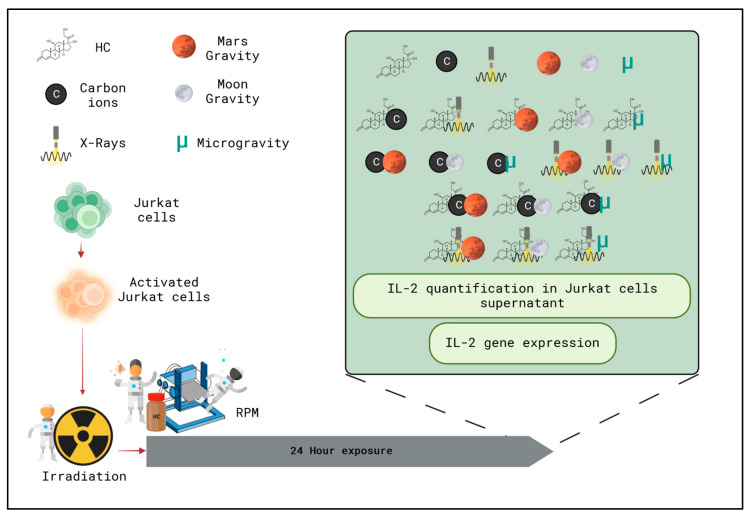
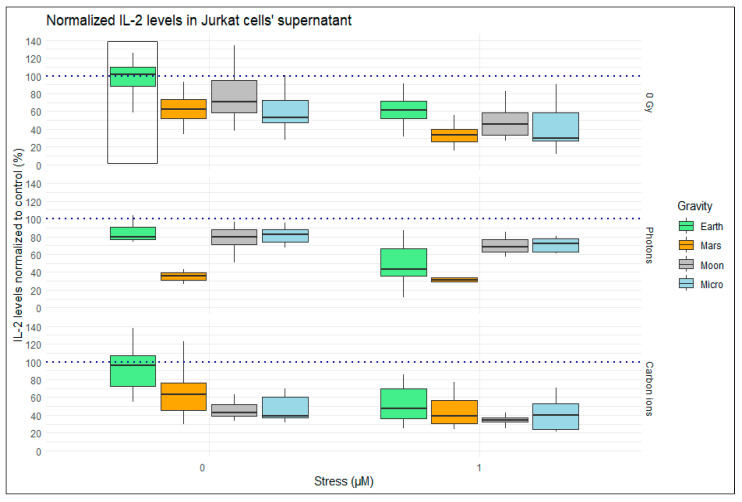
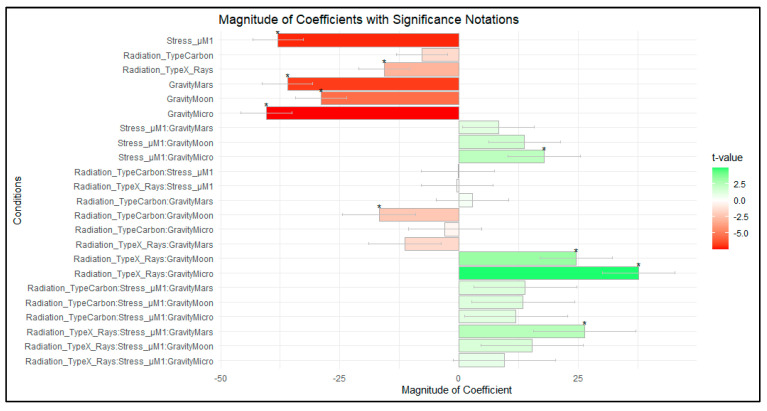
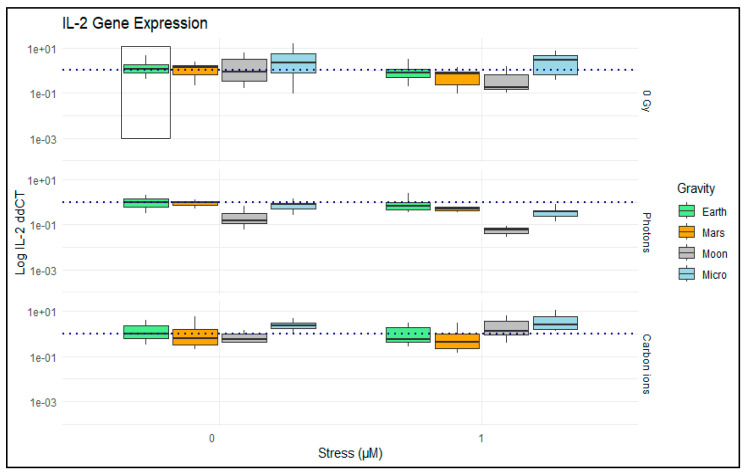
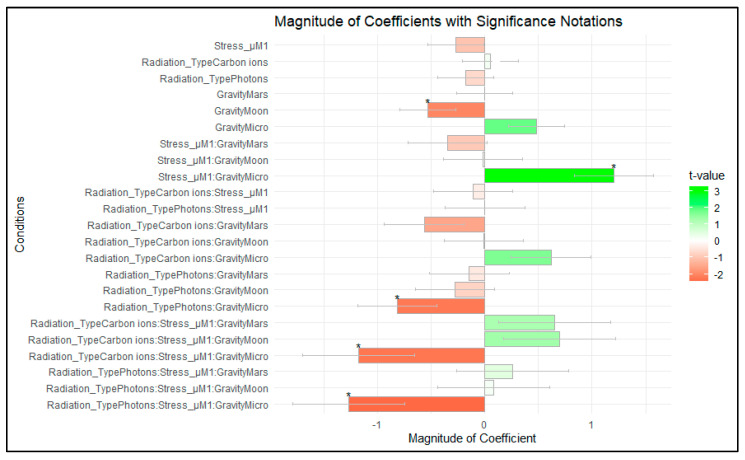
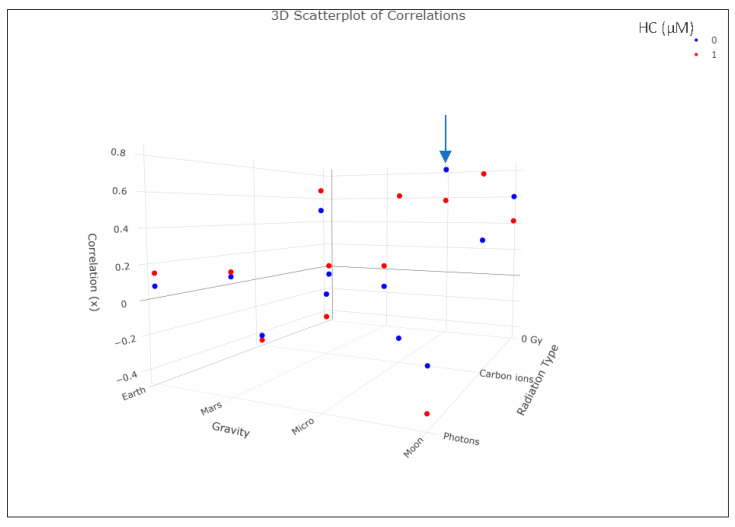
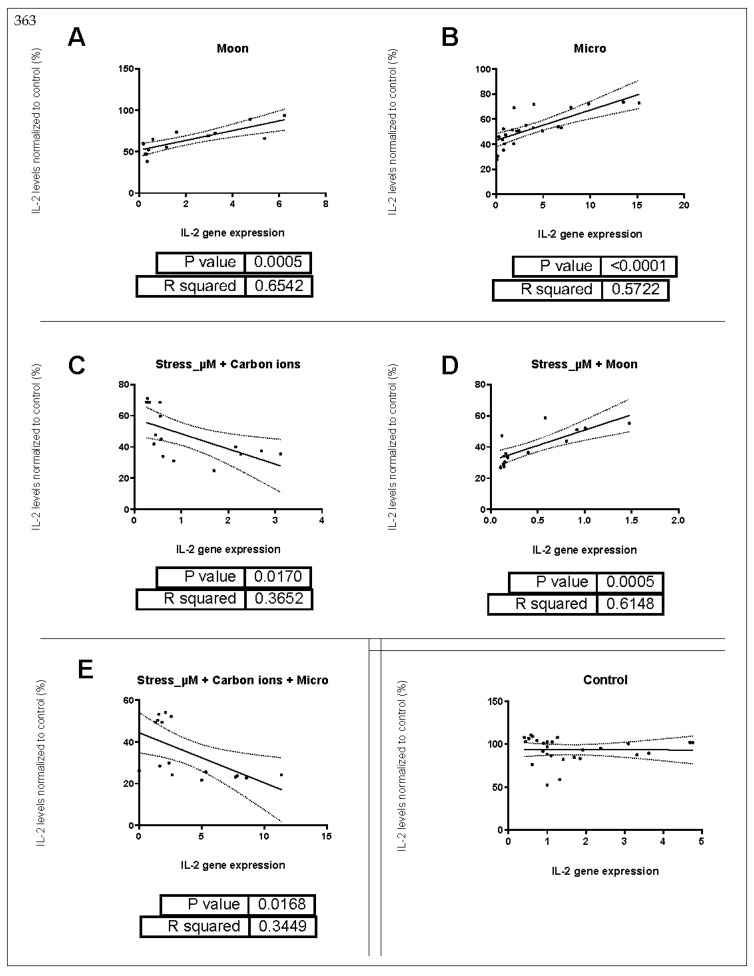
The space environment will expose astronauts to stressors like ionizing radiation, altered gravity fields and elevated cortisol levels, which pose a health risk. Understanding how the interplay between these stressors changes T cells' response is important to better characterize space-related immune dysfunction. We have exposed stimulated Jurkat cells to simulated space stressors (1 Gy, carbon ions/1 Gy photons, 1 µM hydrocortisone (HC), Mars, moon, and microgravity) in a single or combined manner. Pro-inflammatory cytokine IL-2 was measured in the supernatant of Jurkat cells and at the mRNA level. Results show that alone, HC, Mars gravity and microgravity significantly decrease IL-2 presence in the supernatant. 1 Gy carbon ion irradiation showed a smaller impact on IL-2 levels than photon irradiation. Combining exposure to different simulated space stressors seems to have less immunosuppressive effects. Gene expression was less impacted at the time-point collected. These findings showcase a complex T cell response to different conditions and suggest the importance of elevated cortisol levels in the context of space flight, also highlighting the need to use simulated partial gravity technologies to better understand the immune system's response to the space environment.
Keywords: altered gravity; space radiobiology; stress immunity.
Conflict of interest statement
The authors declare no conflict of interest. The funders had no role in the design of the study; in the collection, analyses, or interpretation of data; in the writing of the manuscript; or in the decision to publish the results.
Figures
Similar articles
-
Effects of simulated space conditions on CD4+ T cells: a multi modal analysis.Front Immunol. 2024 Sep 2;15:1443936. doi: 10.3389/fimmu.2024.1443936. eCollection 2024. Front Immunol. 2024. PMID: 39286254 Free PMC article.
-
Genomic Changes Driven by Radiation-Induced DNA Damage and Microgravity in Human Cells.Int J Mol Sci. 2021 Sep 29;22(19):10507. doi: 10.3390/ijms221910507. Int J Mol Sci. 2021. PMID: 34638848 Free PMC article. Review.
-
The Effects of Combined Exposure to Simulated Microgravity, Ionizing Radiation, and Cortisol on the In Vitro Wound Healing Process.Cells. 2023 Jan 7;12(2):246. doi: 10.3390/cells12020246. Cells. 2023. PMID: 36672184 Free PMC article.
-
Effects of microgravity and other space stressors in immunosuppression and viral reactivation with potential nervous system involvement.Neurol India. 2019 May-Jun;67(Supplement):S198-S203. doi: 10.4103/0028-3886.259125. Neurol India. 2019. PMID: 31134910 Review.
-
Altered cytokine production by specific human peripheral blood cell subsets immediately following space flight.J Interferon Cytokine Res. 2000 Jun;20(6):547-56. doi: 10.1089/10799900050044741. J Interferon Cytokine Res. 2000. PMID: 10888111
Cited by
-
Carbon ion irradiation mobilizes antitumor immunity: from concept to the clinic.Radiat Oncol. 2025 May 22;20(1):85. doi: 10.1186/s13014-025-02647-2. Radiat Oncol. 2025. PMID: 40405246 Free PMC article. Review.
-
Omics Studies of Tumor Cells under Microgravity Conditions.Int J Mol Sci. 2024 Jan 11;25(2):926. doi: 10.3390/ijms25020926. Int J Mol Sci. 2024. PMID: 38255998 Free PMC article. Review.
-
Considerations for oral and dental tissues in holistic care during long-haul space flights.Front Physiol. 2024 Jul 11;15:1406631. doi: 10.3389/fphys.2024.1406631. eCollection 2024. Front Physiol. 2024. PMID: 39055690 Free PMC article. Review.
-
Effects of simulated space conditions on CD4+ T cells: a multi modal analysis.Front Immunol. 2024 Sep 2;15:1443936. doi: 10.3389/fimmu.2024.1443936. eCollection 2024. Front Immunol. 2024. PMID: 39286254 Free PMC article.
References
-
- Afshinnekoo E., Scott R.T., MacKay M.J., Pariset E., Cekanaviciute E., Barker R., Gilroy S., Hassane D., Smith S.M., Zwart S.R., et al. Fundamental Biological Features of Spaceflight: Advancing the Field to Enable Deep-Space Exploration. Cell. 2020;183:1162–1184. doi: 10.1016/j.cell.2020.10.050. - DOI - PMC - PubMed
-
- Durante M., Cucinotta F.A. Physical basis of radiation protection in space travel. Rev. Mod. Phys. 2011;83:1245. doi: 10.1103/RevModPhys.83.1245. - DOI
-
- Durante M. Space radiobiology on the Moon. Planet. Space Sci. 2012;74:72–77. doi: 10.1016/j.pss.2012.05.004. - DOI
MeSH terms
Substances
Grants and funding
LinkOut - more resources
Full Text Sources
Miscellaneous
