. 2023 Nov 30;24(23):16974.
doi: 10.3390/ijms242316974.

SMALL PLANT AND ORGAN 1 (SPO1) Encoding a Cellulose Synthase-like Protein D4 (OsCSLD4) Is an Important Regulator for Plant Architecture and Organ Size in Rice

Affiliations

SMALL PLANT AND ORGAN 1 (SPO1) Encoding a Cellulose Synthase-like Protein D4 (OsCSLD4) Is an Important Regulator for Plant Architecture and Organ Size in Rice

Lei Qiao et al. Int J Mol Sci. .

Abstract

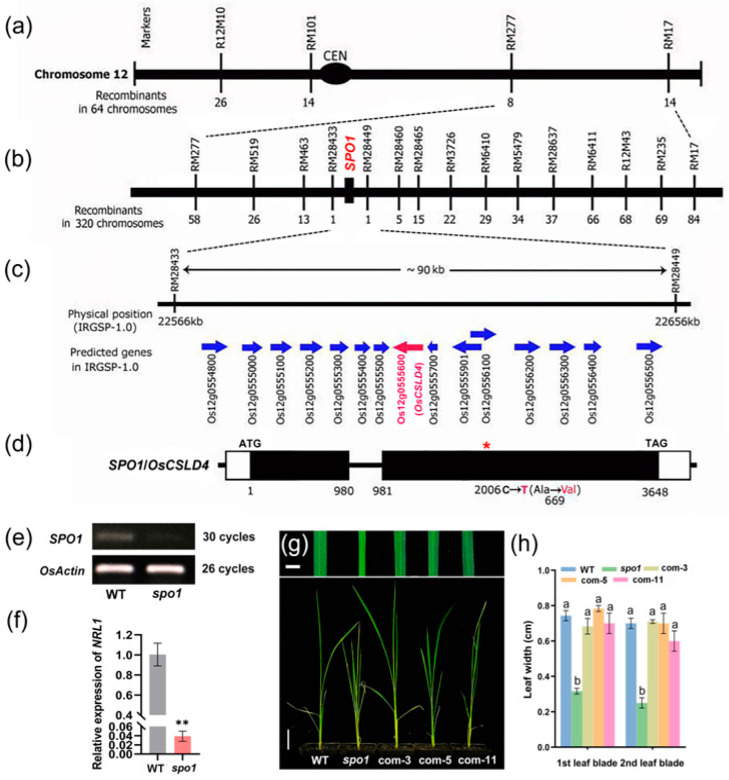
Plant architecture and organ size are considered as important traits in crop breeding and germplasm improvement. Although several factors affecting plant architecture and organ size have been identified in rice, the genetic and regulatory mechanisms remain to be elucidated. Here, we identified and characterized the small plant and organ 1 (spo1) mutant in rice (Oryza sativa), which exhibits narrow and rolled leaf, reductions in plant height, root length, and grain width, and other morphological defects. Map-based cloning revealed that SPO1 is allelic with OsCSLD4, a gene encoding the cellulose synthase-like protein D4, and is highly expressed in the roots at the seedling and tillering stages. Microscopic observation revealed the spo1 mutant had reduced number and width in leaf veins, smaller size of leaf bulliform cells, reduced cell length and cell area in the culm, and decreased width of epidermal cells in the outer glume of the grain. These results indicate the role of SPO1 in modulating cell division and cell expansion, which modulates plant architecture and organ size. It is showed that the contents of endogenous hormones including auxin, abscisic acid, gibberellin, and zeatin tested in the spo1 mutant were significantly altered, compared to the wild type. Furthermore, the transcriptome analysis revealed that the differentially expressed genes (DEGs) are significantly enriched in the pathways associated with plant hormone signal transduction, cell cycle progression, and cell wall formation. These results indicated that the loss of SPO1/OsCSLD4 function disrupted cell wall cellulose synthase and hormones homeostasis and signaling, thus leading to smaller plant and organ size in spo1. Taken together, we suggest the functional role of SPO1/OsCSLD4 in the control of rice plant and organ size by modulating cell division and expansion, likely through the effects of multiple hormonal pathways on cell wall formation.

Keywords: SPO1/OsCSLD4; cell division and expansion; narrow and rolled leaf; organ size; plant architecture; plant hormone.


Conflict of interest statement

The authors declare no conflict of interest.

Figures

Figure 1
Figure 1
Characterization of WT (Nipponbare) and spo1 mutant morphology. (a) Two-week-old WT and spo1 seedlings. (b) Gross morphology of WT and spo1 plants at the mature stage. (c) Morphology of the top three leaf blades between WT and spo1 mutant and the transverse sections of WT and spo1 mature leaves. (d) Features of internodes (I, II, III, IV, and V) among WT and spo1 mutant at the mature stage. (e) Panicles, paddy rice grains, and brown rice grains of WT and spo1 plants. (f) Roots of WT and spo1 plants. (gl) Quantification data of plant height (g), internode length (h), leaf width (i), leaf rolling index (LRI) (j), grain width (k) and length (l) of WT and spo1 mutant at mature stage. At least 12 samples of WT and spo1 mutant were measured for each. Data are means ± SD, asterisks indicate significant differences according to Student’s t-test (* p < 0.05; ** p < 0.01, ns means no significance). Scale bars: (a) 2.5 cm; (b) 10 cm; (c) 0.35 cm and 6 cm; (d) 5 cm; (e) 4 cm, 0.35 cm, and 0.4 cm; (f) 2 cm.
Figure 2
Figure 2
Map-based cloning of SPO1. (a) Linkage map of the gene SPO1 on the long arm of chromosome 12. (b) Fine-mapping of the SPO1 locus. The genetic linkage map is derived from 32 F2 mutant individuals and 160 F2 mutant individuals for fine-mapping. Marker names are above the vertical lines and the number of recombinants is displayed under the vertical lines. (c) According to IRGSP1.0 database annotation, the 90-kb region contains 15 annotated genes. (d) Gene structure of SPO1/OsCSLD4/Os12g0555600 and the corresponding positions of intron and exons. The white boxes indicate the 5′ and 3′ untranslated regions, the black boxes indicate the exons, and the black line between the two black boxes indicate the intron. The start codon (ATG) and the stop codon (TAG) are indicated. The spo1 mutant has a base substitution (C to T) in the second exon at position 2006 of the coding regions. (e) RT-PCR analysis of SPO1 expression in spo1. (f) qRT-PCR analysis of SPO1 expression in spo1. Data are means ± SD, asterisks indicate significant differences according to Student’s t-test (** p < 0.01). (g) Genetic complementation of spo1. Three representative lines (com-3, com-5, and com-11) of complementation with young plants are shown. (h) Statistical analysis of the leaf blades width of WT, spo1, and complementary lines (com-3, com-5, and com-11) at seedling stage. Data presented are means ± SD: different letters indicate significant differences between means, according to Duncan’s multiple range test (5% α). Scale bars: (g) 0.6 cm and 4 cm, respectively.
Figure 3
Figure 3
qRT-PCR analysis of the tissue-specific and stressed-induced expression pattern of SPO1. (a) The tissue-specific expression pattern of SPO1. The expression of SPO1 in leaves at seedling stage was set to 1. (b) Expression of SPO1 in leaves of two-week-old seedlings treated with 100 μM IAA, 50 μM GA, 100 μM ABA, and 100 μM MeJA at different time points. (c) Expression of SPO1 in leaves of two-week-old seedlings treated with 200 mM NaCl, 20%PEG6000, 15 μM MV, heat (42 °C), and cold (4 °C) at different time points. The OsActin1 gene was used as a control. The data are shown by the mean ± SD with three biological replicates.
Figure 4
Figure 4
Histological analysis of the leaf blades, stems, and grains between WT and spo1 mutant plants. (a) Cross sections of leaf blades of WT and spo1 mutant. (b) Cross section of midrib, large vein, and small vein at the middle of the second leaf from the top of WT and spo1 mutant at tillering stage. (cg) Statistics analysis of a number of large veins (c) and small veins (d) per leaf, width of veins (e), number of BCs (f), area of BCs (g). (h) Longitudinal sections of stems between WT and spo1 mutant. (i) The length of stem cells. (j) The area of stem cells. (k) Grain morphology and scanning electron microscopy of the outer surfaces of WT and spo1 glumes. (l,m) Cell width (l) and length (m) of outer glume of the grain. At least 30 samples of WT and spo1 mutant were measured for each. Data are means ± SD, asterisks indicate significant differences according to Student’s t-test (* p < 0.05; ** p < 0.01, ns means no significance). Abbreviations: Ab, abaxial surface; Ad, adaxial surface; BC, bulliform cell; EC, epidermal cell; LV, large vein; SV, small vein. Scale bars: (a) 500 μm; (b) 100 μm; (h) 100 μm; (k) 0.2 cm and 50 μm.
Figure 5
Figure 5
qRT-PCR analysis of the expression of genes related to leaf shape regulation in the spo1 mutant. Total RNA was extracted from leaves of WT and spo1 mutant at tillering stage. OsActin1 gene was used as a control. Data are the mean ± SD with three biological replicates, asterisks indicate significant differences according to Student’s t-test (* p < 0.05; ** p < 0.01).
Figure 6
Figure 6
Transcriptomic analysis of spo1 mutant. (a) Gene Ontology (GO) enrichment analysis of DEGs in spo1. (b) KEGG pathway enrichment of DEGs in spo1. Leaves of spo1 mutant and wild-type plants in the tillering stage are used as test samples.

References

    1. Xing Y., Zhang Q. Genetic and Molecular Bases of Rice Yield. Annu. Rev. Plant Biol. 2010;61:421–442. doi: 10.1146/annurev-arplant-042809-112209. - DOI - PubMed
    1. Reinhardt D., Kuhlemeier C. Plant architecture. EMBO Rep. 2002;3:846–851. doi: 10.1093/embo-reports/kvf177. - DOI - PMC - PubMed
    1. Wang Y., Li J. Genes controlling plant architecture. Curr. Opin. Biotechnol. 2006;17:123–129. doi: 10.1016/j.copbio.2006.02.004. - DOI - PubMed
    1. Breuninger H., Lenhard M. Plant Development. Elsevier; Amsterdam, The Netherlands: 2010. Control of Tissue and Organ Growth in Plants; pp. 185–220. - PubMed
    1. Li W., Yang Z., Yao J., Li J., Song W., Yang X. Cellulose synthase-like D1 controls organ size in maize. BMC Plant Biol. 2018;18:239. doi: 10.1186/s12870-018-1453-8. - DOI - PMC - PubMed

LinkOut - more resources